Inspiration
Most flood tools focus on showing where water might go. We wanted to answer the more important operational questions: what becomes unreachable, which roads and bridges fail, and which response plan still works as conditions change?
We were inspired by the Nakkhu River corridor in Kathmandu and Lalitpur because it contains dense development, limited crossings, low lying roads, and communities that can quickly lose access to essential services.
A flood becomes especially dangerous when a community is isolated from shelters, hospitals, or evacuation routes. The Ark was designed to help responders understand those consequences before making decisions.
We also wanted to avoid treating machine learning predictions as operational truth. Historical flood reports can help identify possible patterns, but they cannot replace current physical observations or information from emergency responders.
What it does
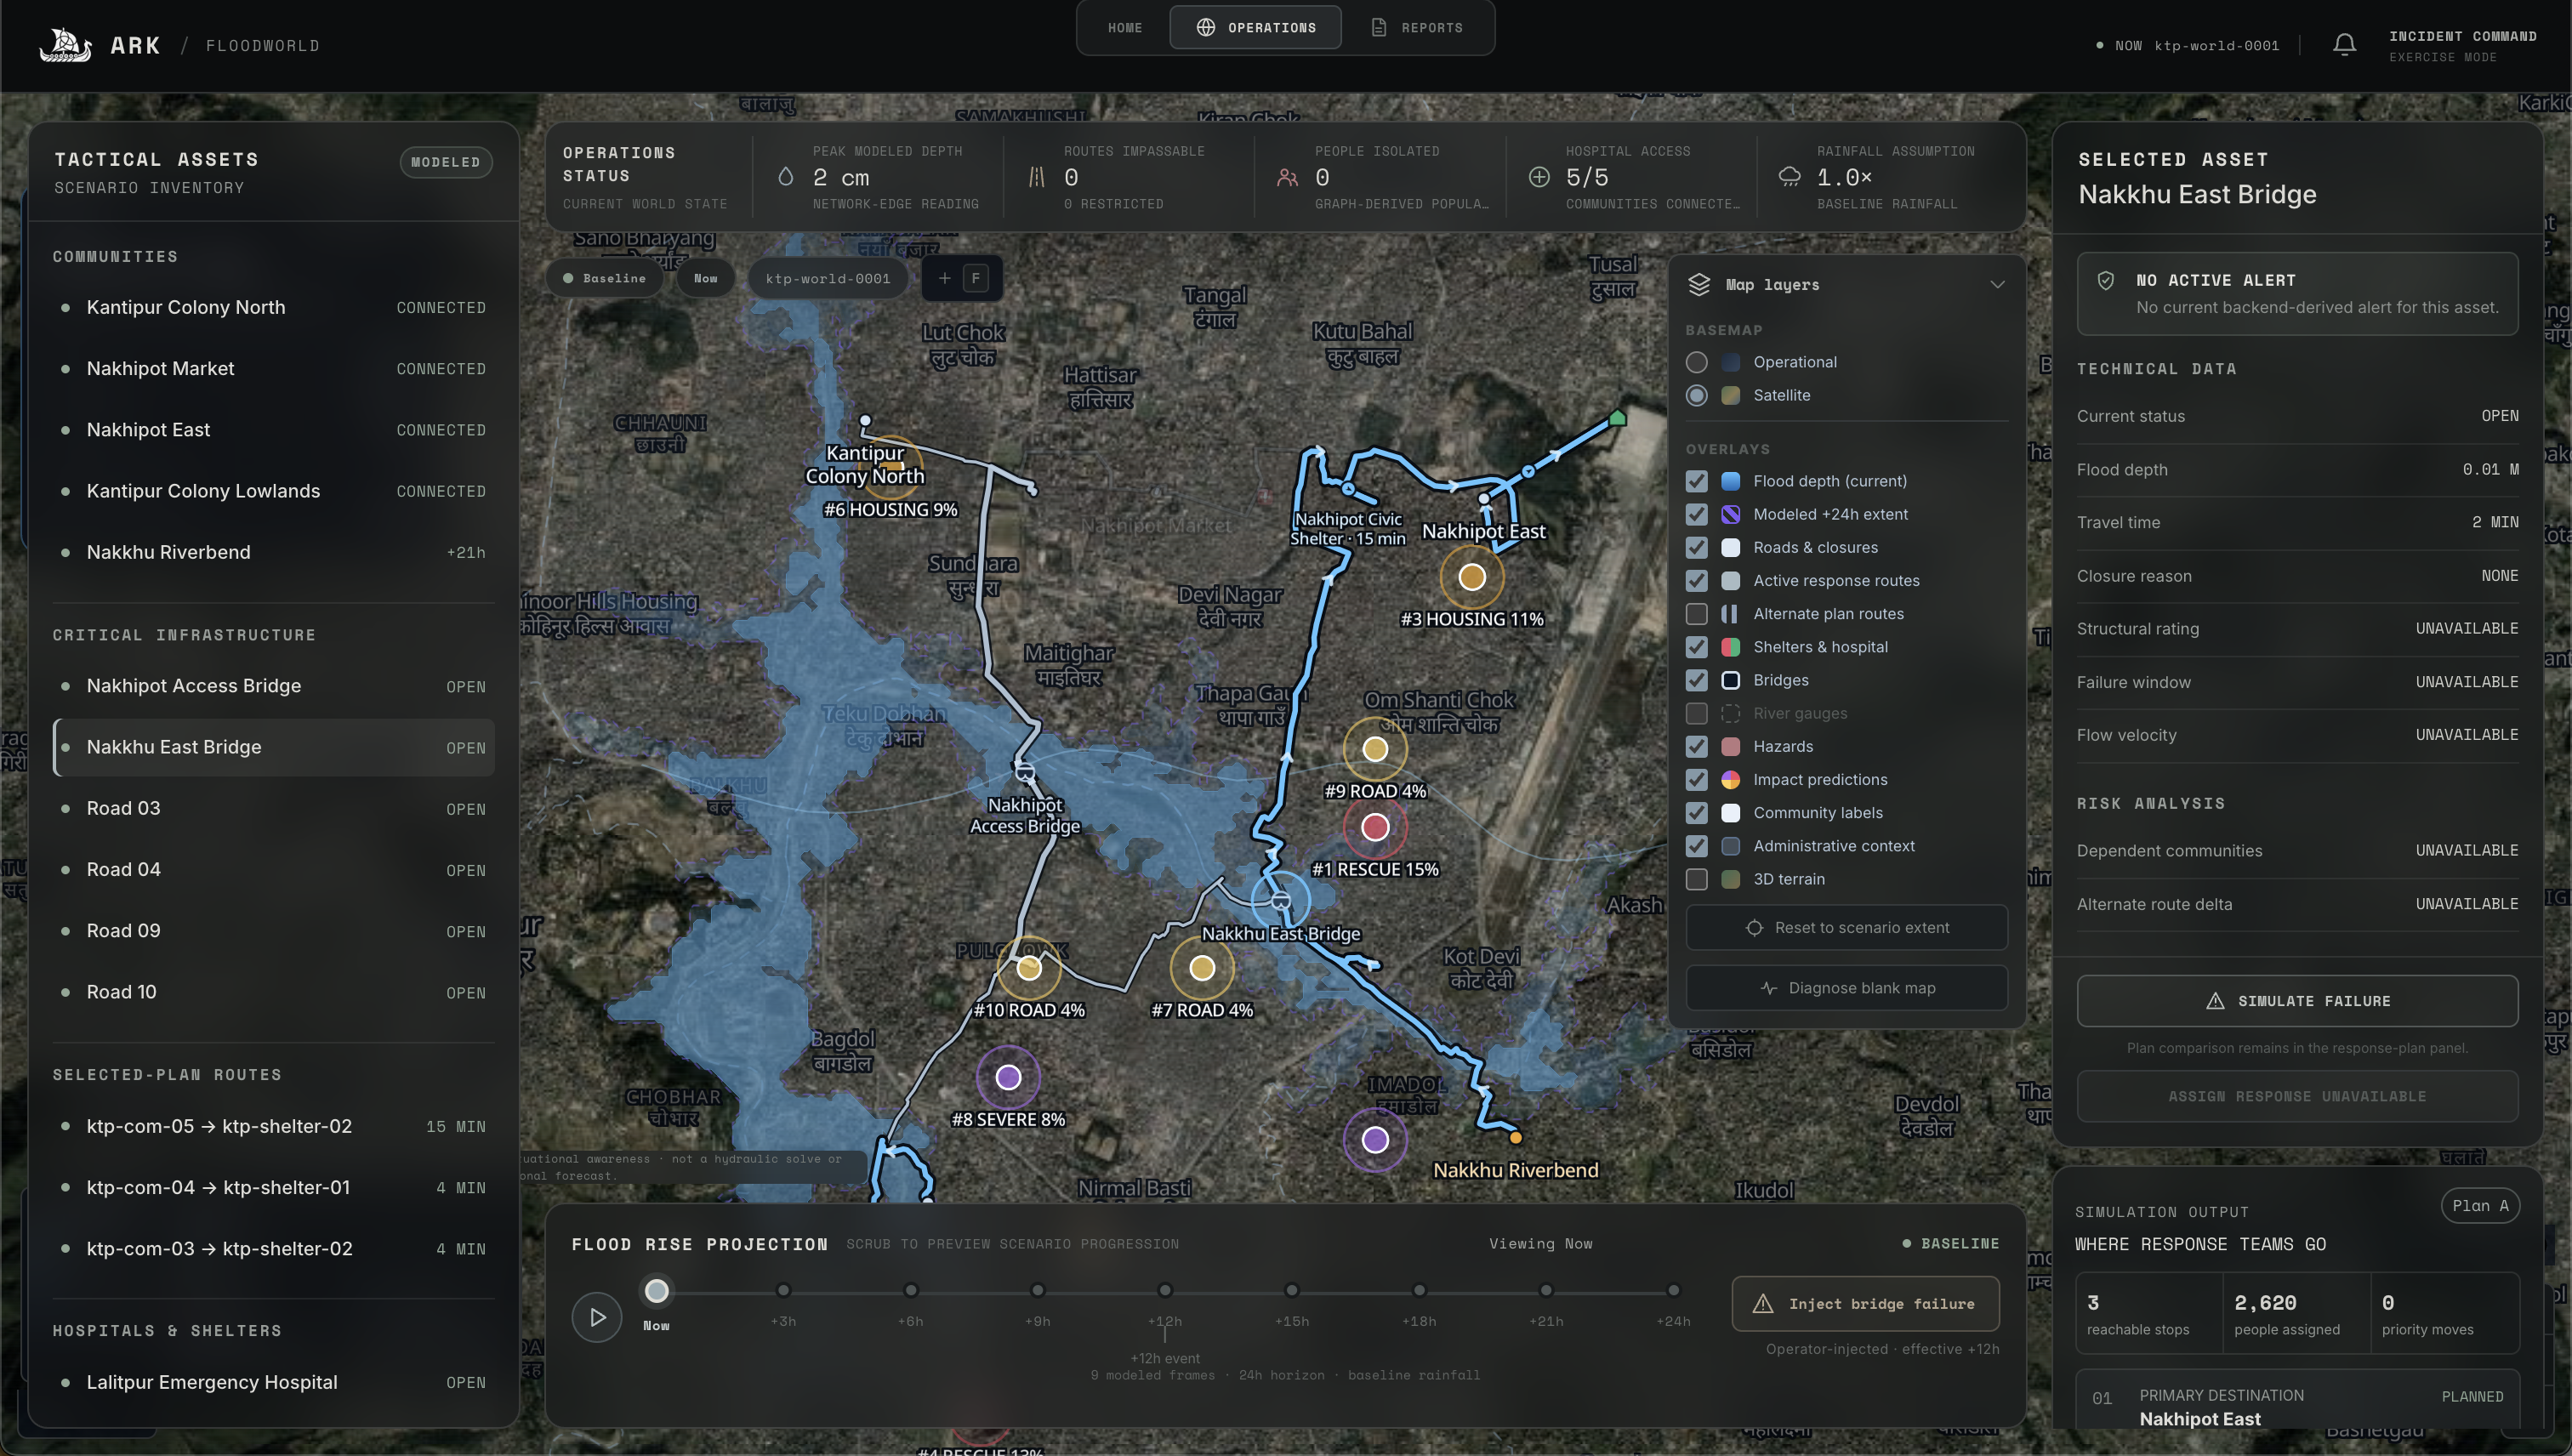
The Ark is a map centered world model for flood emergencies. It is not just a flood prediction dashboard. It helps emergency responders understand how flooding affects communities, roads, bridges, hospitals, shelters, and evacuation plans.
The Ark answers questions such as:
- Which community will be cut off next?
- Which roads and bridges will become unusable?
- Can an ambulance still reach the hospital?
- Which shelters can still be reached?
- Which evacuation plan performs best?
- What happens if a bridge fails or conditions suddenly change?
The system combines flood scenarios, infrastructure connectivity, hospital and shelter access, and operator injected disruptions into one shared world state.
When the situation changes, the system recomputes safe routes, community isolation risk, evacuation outcomes, hospital access, shelter access, and response plan performance.
Our MVP focuses on a replayable corridor along the Nakkhu River in Kathmandu and Lalitpur. It includes five communities, two bridges, one hospital, two shelters, multiple flood stages, and an injected failure of the Nakkhu East Bridge.
The result is more than a map showing where water may go. The Ark shows what becomes unreachable and how different response plans perform as the situation evolves.
The scenario uses synthetic demonstration data. The historical impact model is research only and is not validated for live emergency dispatch.
How we built it
Everything in the application reads from one versioned and timestamped world state. The map, routing engine, plan engine, and reports all use the same underlying information so that the system does not show one situation while scoring plans against another.
Flood surface
Water is computed using terrain data rather than being drawn as arbitrary shapes. AWS Terrarium elevation tiles are processed to understand the shape of the land and how water can move through the river corridor.
The system uses terrain features to create flood surfaces that follow the valley and surrounding landscape. Flood stages are then applied to the scenario to show how the affected area grows over time.
These flood surfaces are used to inform the demonstration visuals. The system keeps visual flood areas separate from infrastructure closures and routing decisions so that each decision remains explainable.
Infrastructure graph
The scenario contains roads, bridges, communities, shelters, and hospitals connected through an infrastructure graph.
Road and bridge locations are shown using OpenStreetMap data, while routing and domain results use stable infrastructure identifiers. This allows the system to calculate travel routes and closures consistently.
Bridges are modeled as the sections that actually cross the river rather than as entire roads. This makes it possible to simulate the consequences of a specific bridge failure.
Routing and plans
Flood conditions and operator injected events can close roads or bridges according to deterministic rules.
The system then recalculates:
- Safe paths
- Hospital access
- Shelter access
- Community isolation
- Evacuation outcomes
- Response plan performance
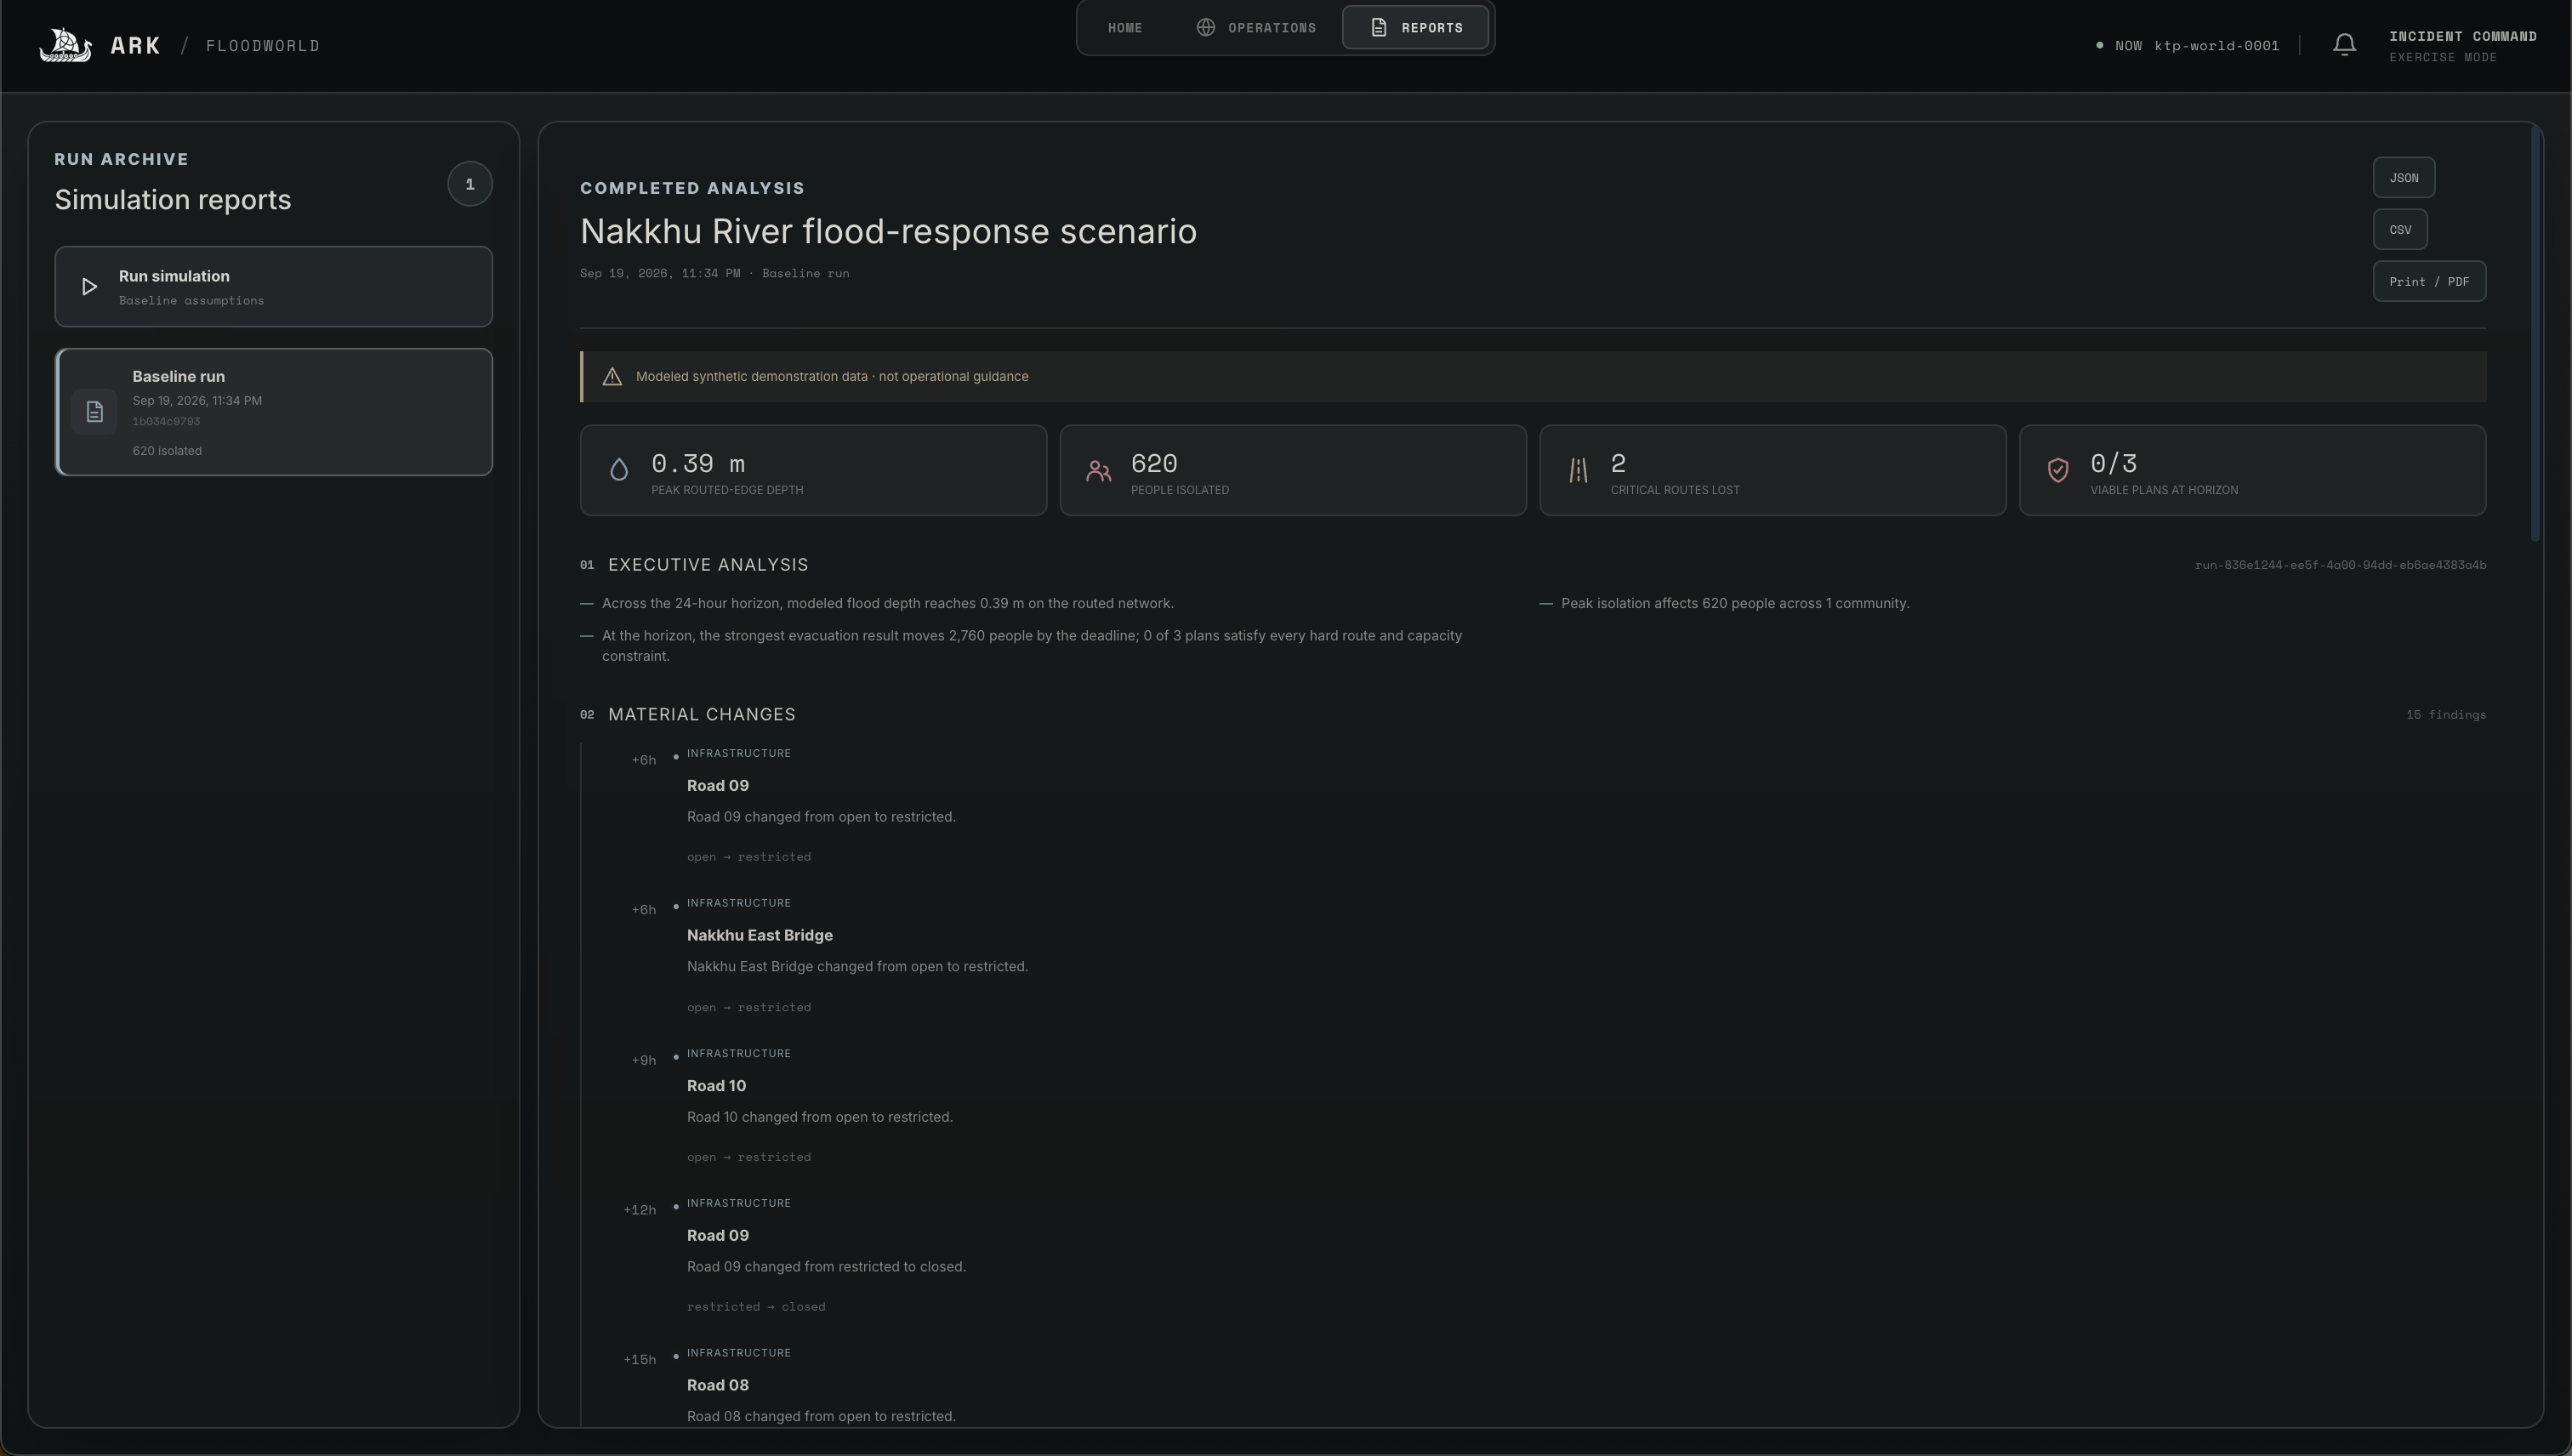
Plans A, B, and C are evaluated using the same scenario state. The system compares how many people are isolated, how many people can be evacuated, how quickly the plan can be completed, which critical routes are lost, whether hospitals remain accessible, and whether shelters have enough capacity.
When the east bridge fails, the previous results are marked as stale and a new world state is created. The older results remain available for comparison and audit.
Impact prior
The project also includes a research only machine learning model trained on historical flood reports from Nepal.
The model provides additional prediction pings that can help visualize possible areas of impact. However, those predictions are intentionally separated from routing, isolation calculations, plan scoring, and operational conclusions.
This separation ensures that the system clearly distinguishes between modeled predictions, scenario assumptions, operator inputs, and operationally derived results.
Technology
- FastAPI and Pydantic
- React and TypeScript
- MapLibre GL
- Self hosted Protomaps PMTiles
- SQLite for immutable scenario runs
The frontend does not independently calculate domain logic. It displays the results produced by the backend world model.
If the map tiles fail, the application falls back to an SVG schematic showing the same derived state.
Challenges we ran into
Creating one source of truth
The map, router, and plan scorer initially had separate ways of representing the situation. This created a risk that different parts of the application could show contradictory results.
We solved this by requiring every subsystem to consume a versioned world state. The user interface acts as a projection of that state rather than maintaining a second version of the system’s logic.
Building honest flood visuals
Our early flood visuals looked like simple rectangles placed over the city. We improved them by using terrain derived flood surfaces that follow the shape of the river corridor.
We also had to ensure that the visual progression of the scenario remained useful for demonstration without presenting synthetic values as real measurements.
Avoiding misleading machine learning claims
Historical flood data is incomplete and inconsistent. We harmonized reports from multiple sources and used several holdout strategies to reduce the risk of leakage.
The model was evaluated on a locked Nakkhu scenario and did not perform well enough to support operational decisions. Instead of hiding that result, we labeled the model as research only and kept it separate from the response system.
Keeping the visuals consistent
The system follows a freeze, clone, and score workflow:
- Freeze the current world state.
- Clone it with a new event.
- Score the response plans again.
- Mark the previous results as stale.
- Preserve both versions for audit.
This makes it clear how a new disruption changed the situation and prevents the application from silently rewriting history.
Making a small demo meaningful
The scenario is intentionally small. It contains five communities, two bridges, one hospital, and two shelters.
This limited scope makes the system easy to understand while still creating meaningful tradeoffs. A bridge failure can isolate a community, block hospital access, overload shelters, and change which response plan performs best.
Accomplishments that we are proud of
- Built a replayable flood response world model instead of a static flood map.
- Created a shared world state used by the map, router, plan engine, and reports.
- Derived flood shapes from terrain rather than drawing arbitrary polygons.
- Modeled roads, bridges, communities, hospitals, and shelters as an infrastructure graph.
- Added operator injected disruptions, including the Nakkhu East Bridge failure.
- Compared multiple response plans under the same scenario conditions.
- Preserved previous results for audit instead of silently overwriting them.
- Kept the research only machine learning model separate from operational decisions.
- Added an SVG fallback that represents the same derived state when map tiles fail.
- Created a small and explainable scenario that demonstrates the consequences of infrastructure failure.
What we learned
- One shared world state prevents contradictory answers across the application.
- Accessibility is often more important than flood coverage alone.
- Bridge failures need to trigger a complete recomputation of routes and response plans.
- Road geometry and network connectivity serve different purposes.
- Plans must be compared under identical conditions to produce meaningful results.
- Previous results should remain visible after new conditions are introduced.
- A small scenario can still reveal important emergency response tradeoffs.
- Interfaces for emergency response must clearly separate facts, assumptions, model outputs, and operator inputs.
What is next for ARK
The next step toward operational capability is better event time data and more precise physical observations.
Future work includes:
- Live river stage feeds
- Rate of rise calculations
- Upstream rainfall data
- More detailed terrain information
- Satellite flood masks
- Improved road and bridge condition data
- Additional flood corridors and emergency scenarios
- Better evacuation time and shelter capacity modeling
- Authentication and multi operator collaboration
- Validation with local emergency management partners
Until those capabilities exist, The Ark will clearly distinguish between demonstration data, research outputs, and operationally validated information.
Built With
- cursor
- fastapi
- figma
- maplibre
- python
- react
- sqlite
- tailwindcss
- typescript
- vite


Log in or sign up for Devpost to join the conversation.