-
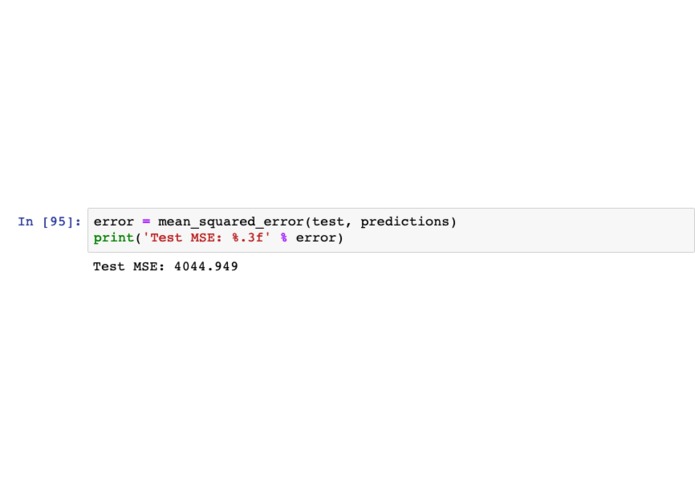
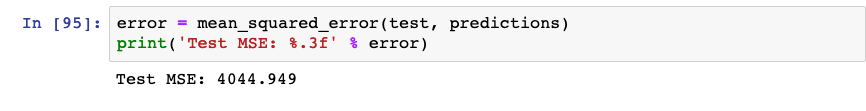
Our mean square error for our predictive model.
-
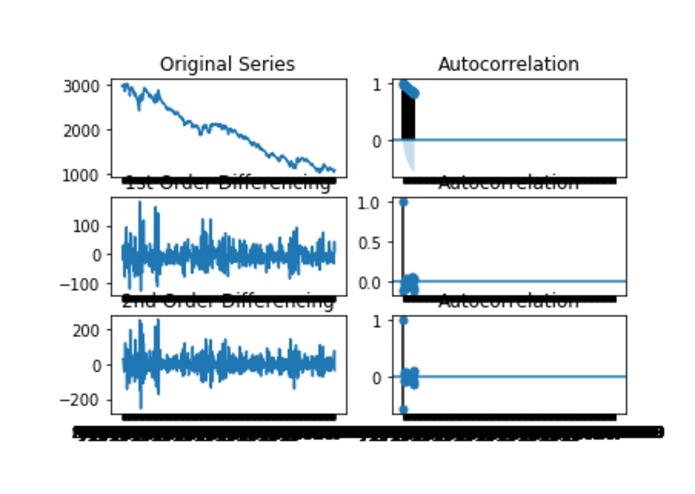
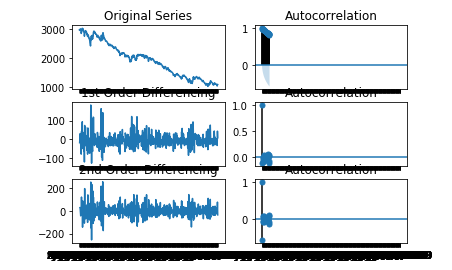
The graphs used to determine the q value of our ARIMA model.
-
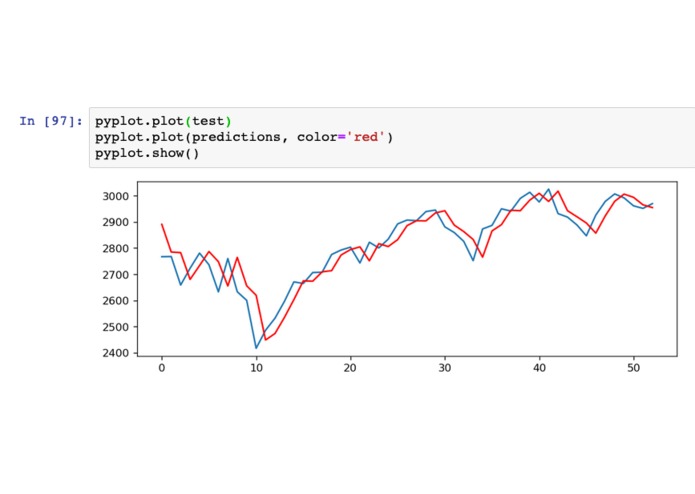
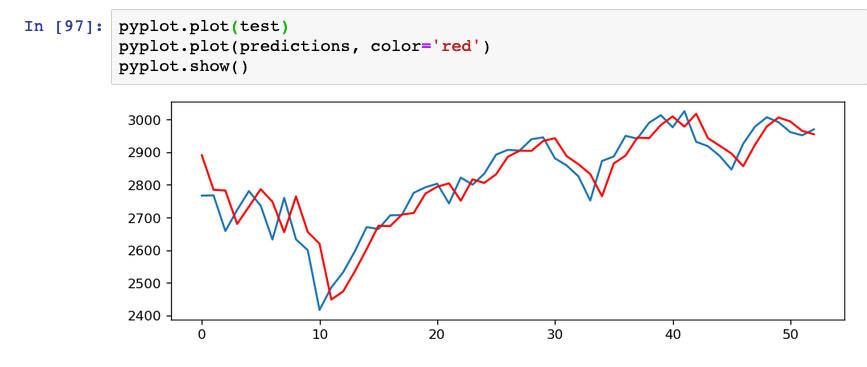
A comparison of our rolling predictive values and the real values. The red data was trained off of approximately 2 years of weekly S&P500.
-
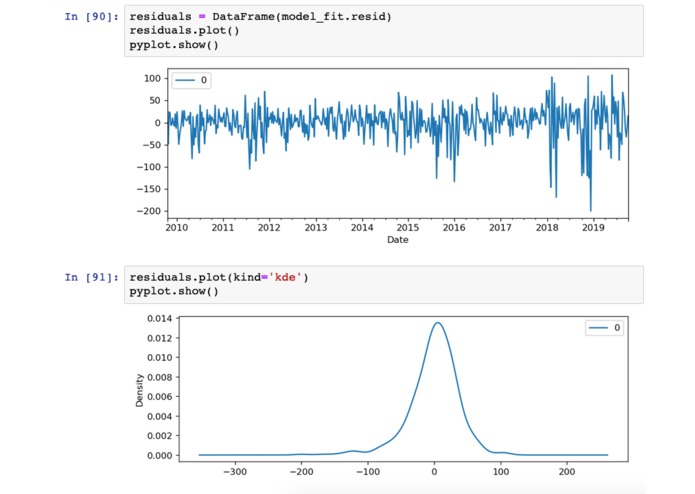
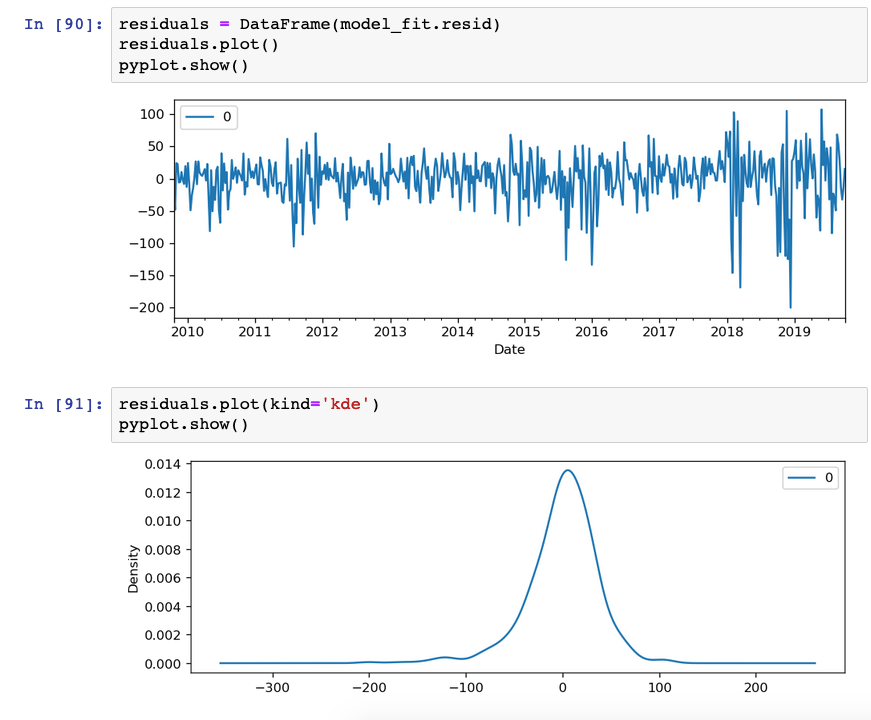
Values used to ballpark the accuracy of our model.
    I saw an interview with the CEO of Renaissance Technologies on the Youtube channel Numberphile a year or so ago. In it, James Simons discussed his background as a math researcher here at UC Berkeley, and how that led him on his path to creating a cutting edge quantitative analysis hedge fund. This inspired me to find interesting ways I could apply the math I had been studying for so long. For me, many of the math classes I take are very far removed from practicality. From proving the infinite-ness of sets to high dimensional space, I was starting to get lost in the abstraction. So, delving into the world of financial models helped me see a whole new world of mathematical beauty and practicality hand-in-hand. This hackathon seemed like the perfect opportunity to try some new techniques in the world of financial modeling.
    We wrote and compiled a Jupyter notebook that takes in a csv of historical data (we pulled from Goldman Sachs Marquee and BlackRock API's) and analysis it using a variety of tests to determine the best variables for creating an ARIMA model. We use the Augmented Dickey-Fuller, KPSS, and Phillips–Perron test to determine the best p, q, and r values to feed into out autoregressive integrated moving average (ARIMA) model.
    There were many many many roadblocks on the way to getting even basic results. My laptop can only run so many training sets so before any testing could begin, we had to port everything to a Google Cloud VM. This in and of itself was quite the finicky ordeal, but through the help of some mentors and our friends, we got it on. We then spend far more hours than we should have reading papers and trying to learn everything we could about ARIMA (and other related) models: from what data sets they are best for to the math behind them. We were able to get a mean squared error of 4044.949 for approximately 2 years of rolling predictions for the S&P 500. Images of our results vs. the real prices are attached.
    We started, but were not able to implement, Twitter sentiment analysis as a factor of our model. We eventually want to add multiple exogenous variables such as other indices, gold prices, oil prices, and foreign exchange rates, but we would have to do a lot more testing to see what would be appropriate in out model. We would also like to add a more advanced sentiment analysis that was able to cover a larger portion of the news cycle than just Twitter. The common argument against ARIMA modeling for stocks is that math can't see a natural disaster or see a CEO doing something outrageous: but the news cycles (and more imminently Twitter) can.
Built With
- goldman-sachs-marquee
- google-cloud
- python

Log in or sign up for Devpost to join the conversation.