ArgusAI — AI-Powered Incident Intelligence
Inspiration
When a production system fails, detecting the failure is only the beginning. Engineers often have to jump between monitoring dashboards, application logs, and alerting systems to understand what went wrong. This manual investigation can delay diagnosis and increase recovery time.
We built ArgusAI to bridge the gap between detecting an incident and understanding it.
Our goal is to create an AI-powered incident intelligence platform that correlates system metrics and application logs with incoming alerts, then produces structured, evidence-backed root cause analysis to help engineers investigate failures faster.
What It Does
ArgusAI transforms incoming system alerts into actionable incident intelligence.
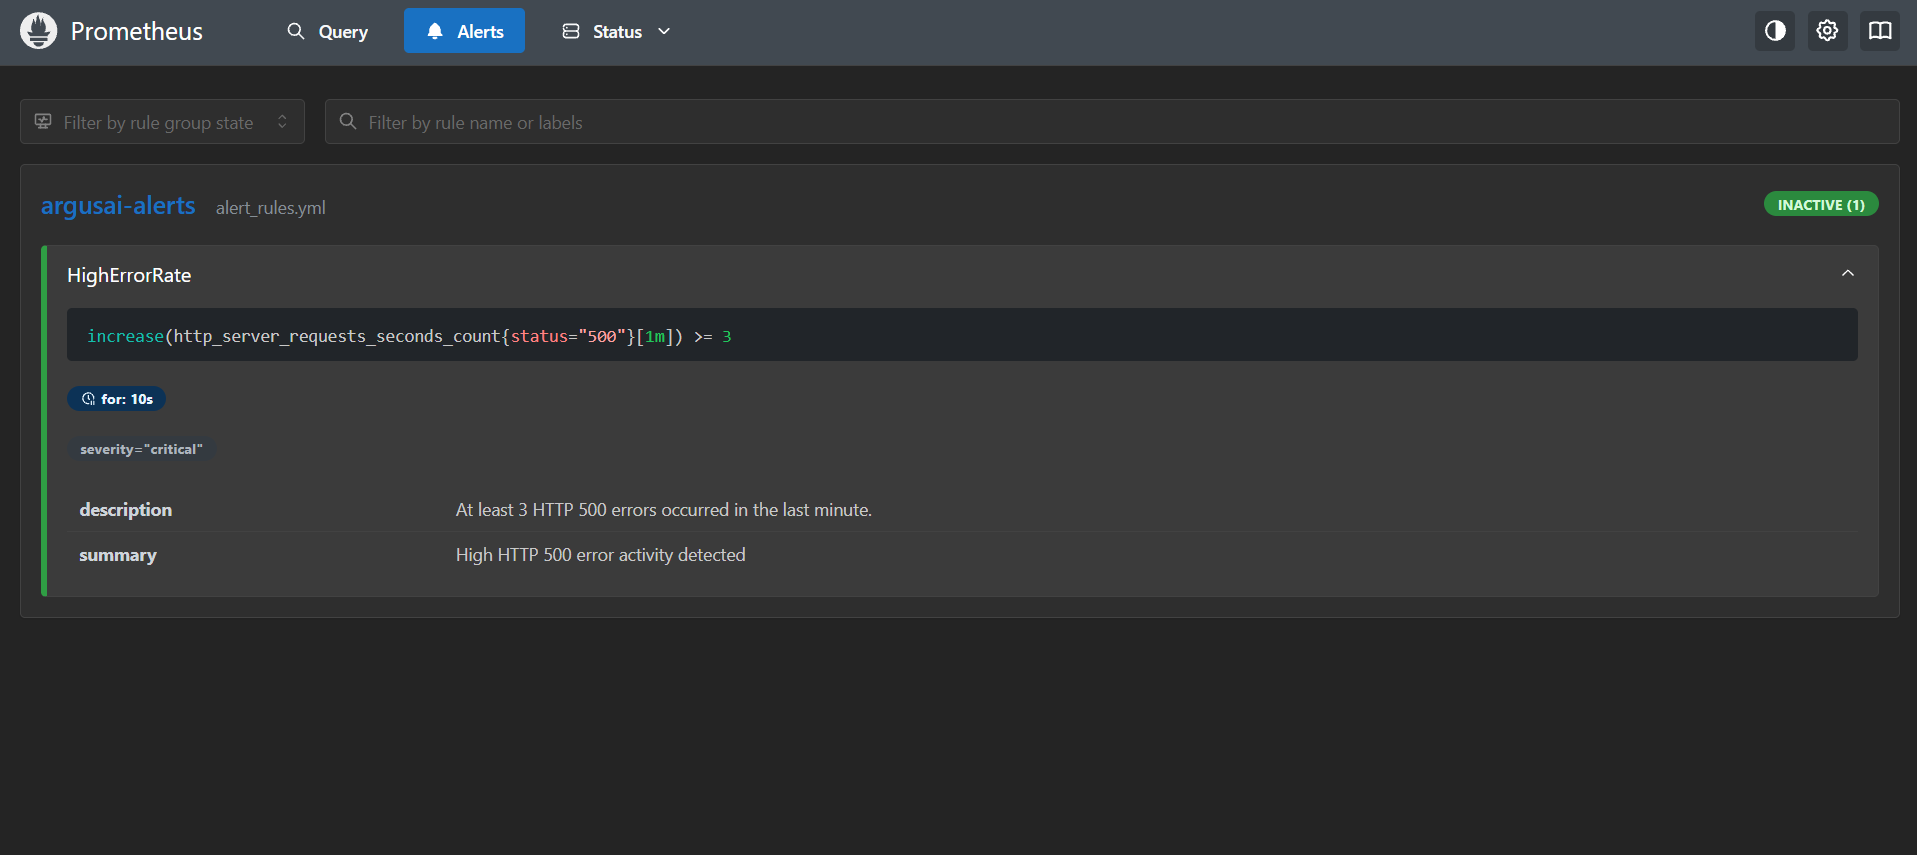
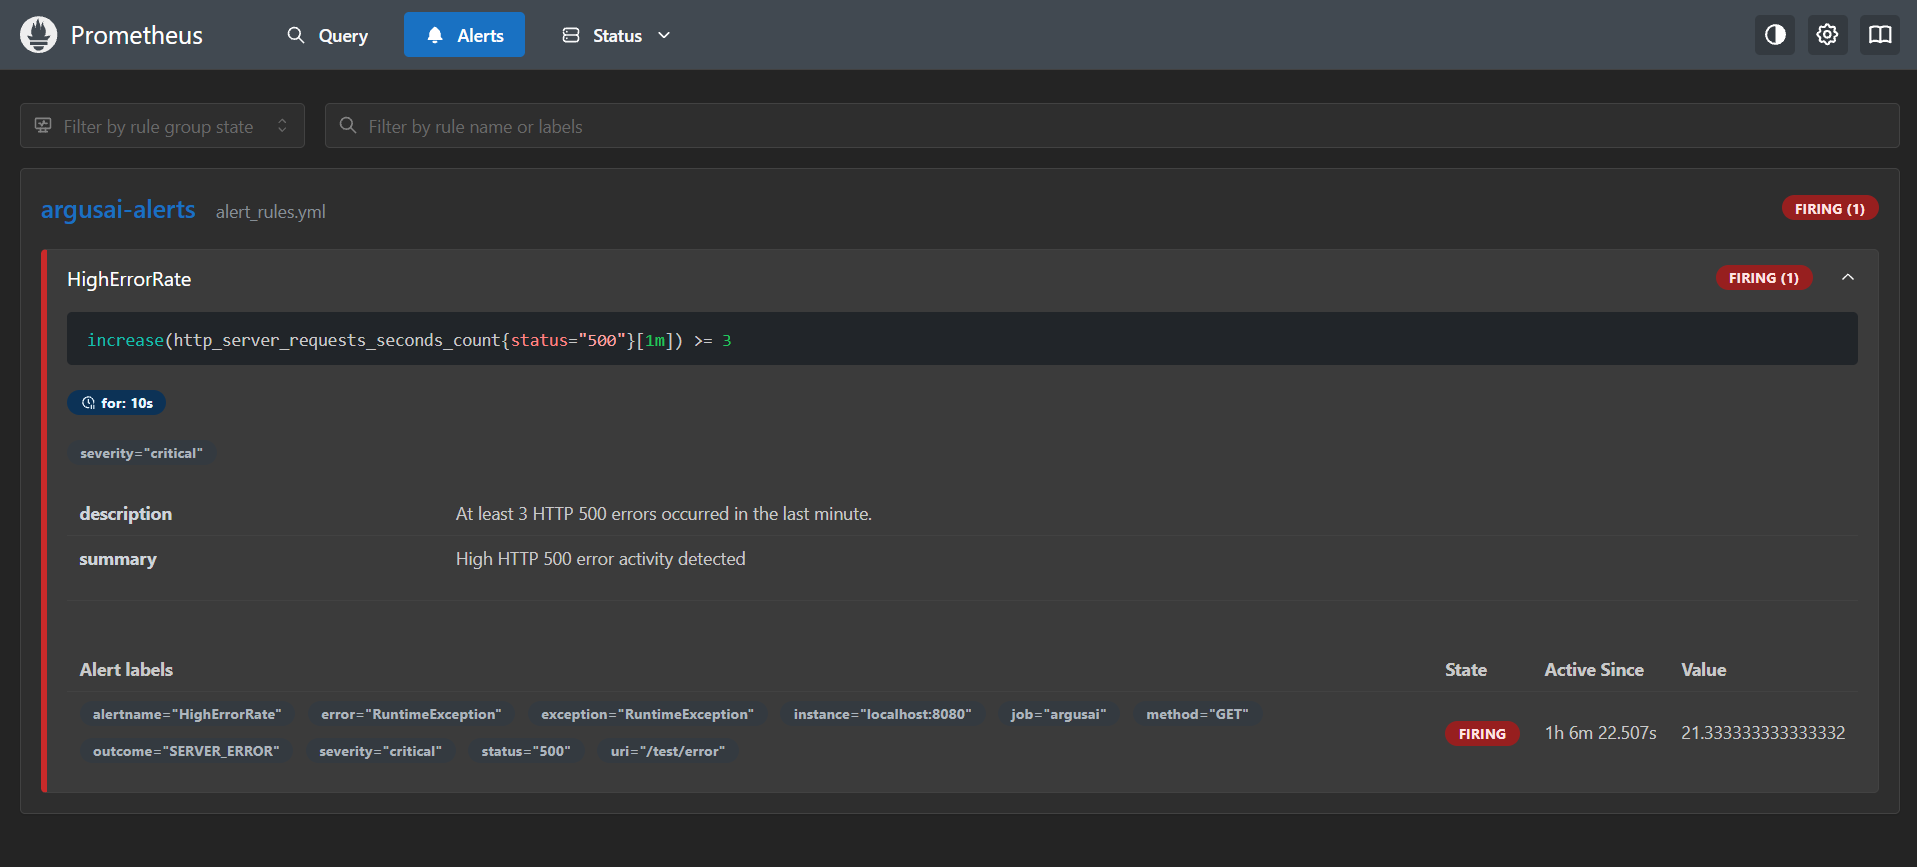
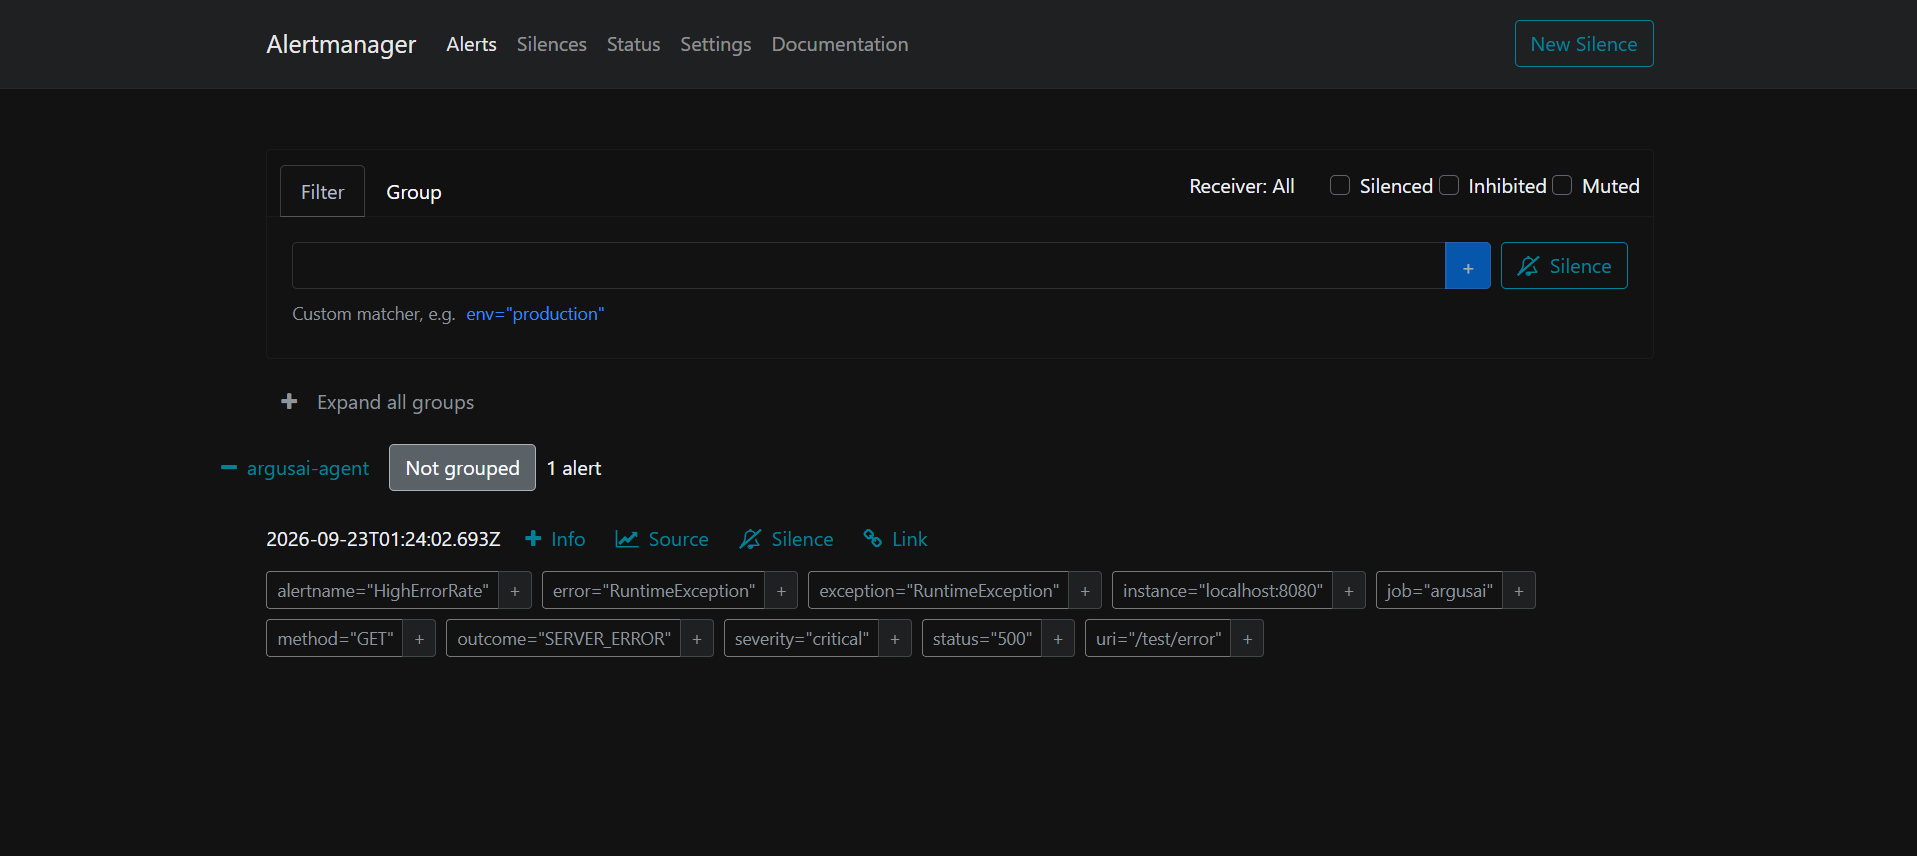
- Incident detection: Receives alerts from Alertmanager when monitored systems encounter problems.
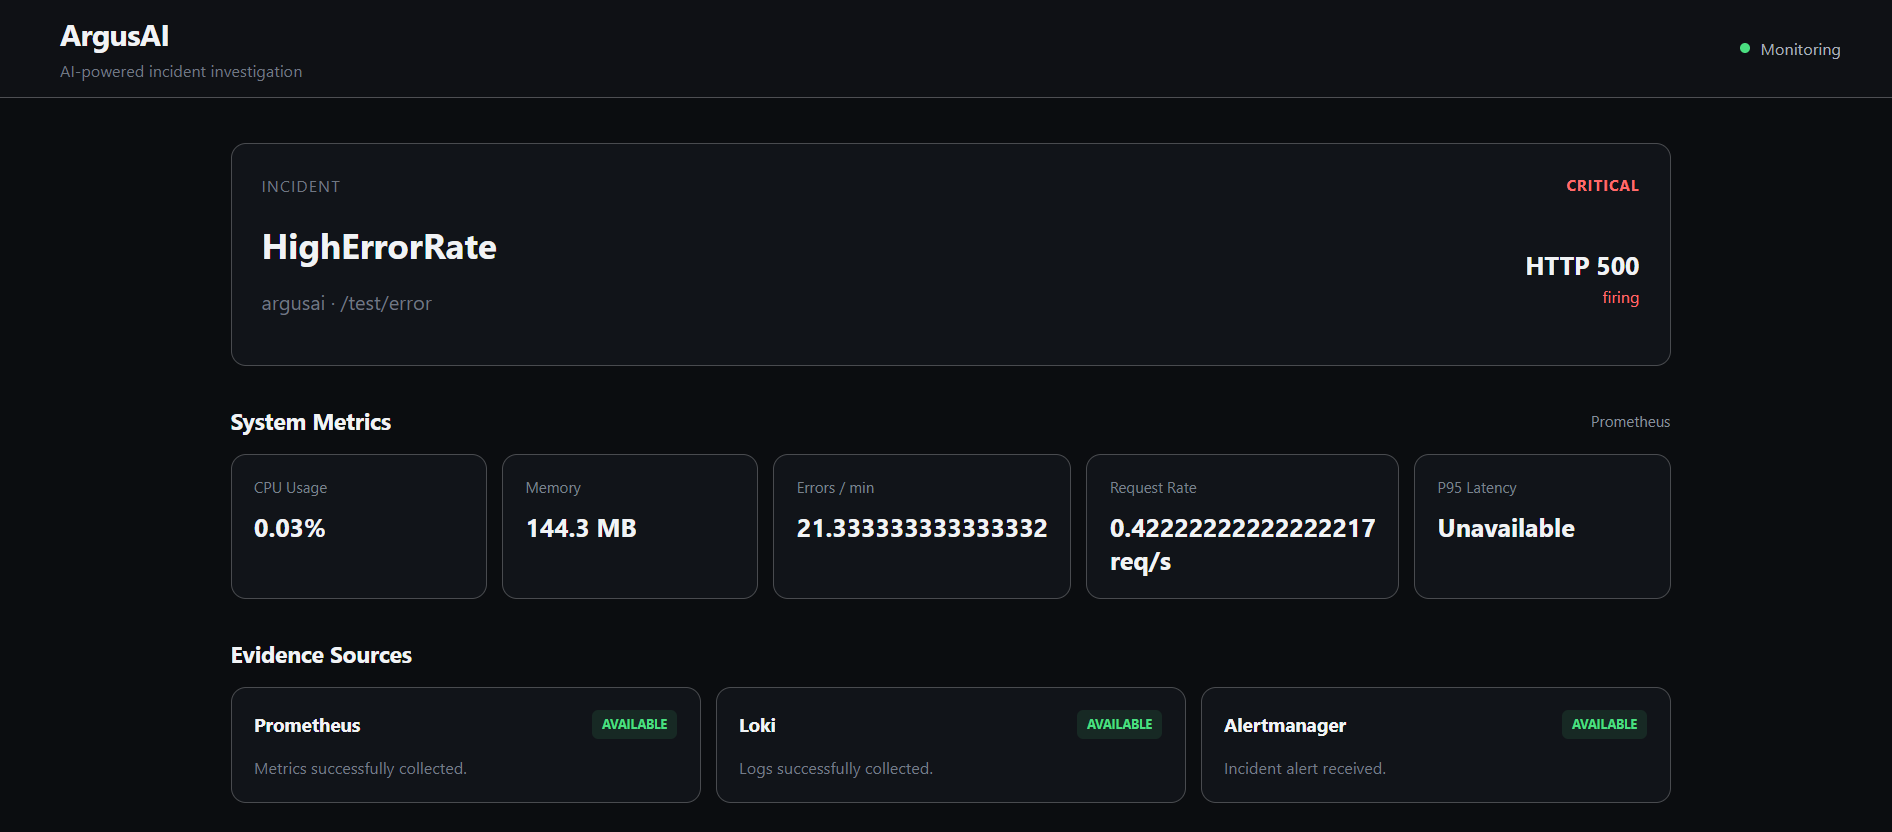
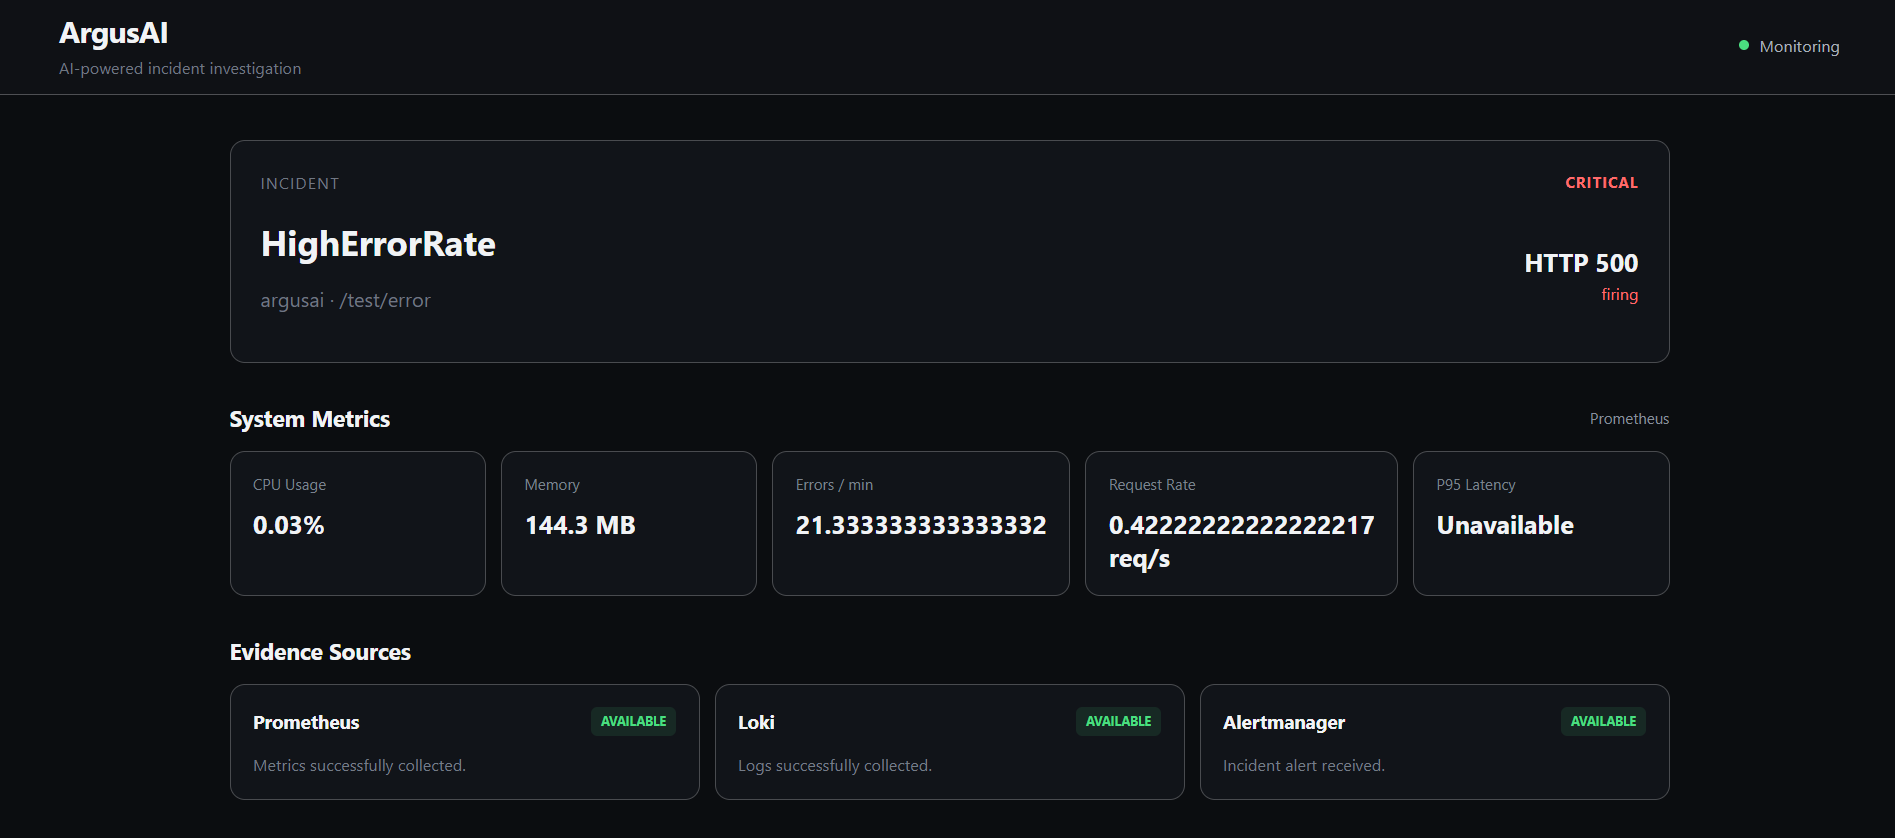
- Metrics collection: Retrieves relevant telemetry from Prometheus, including CPU usage, memory consumption, error counts, request rates, and latency where available.
- Log investigation: Queries Grafana Loki for application logs and exceptions associated with an incident.
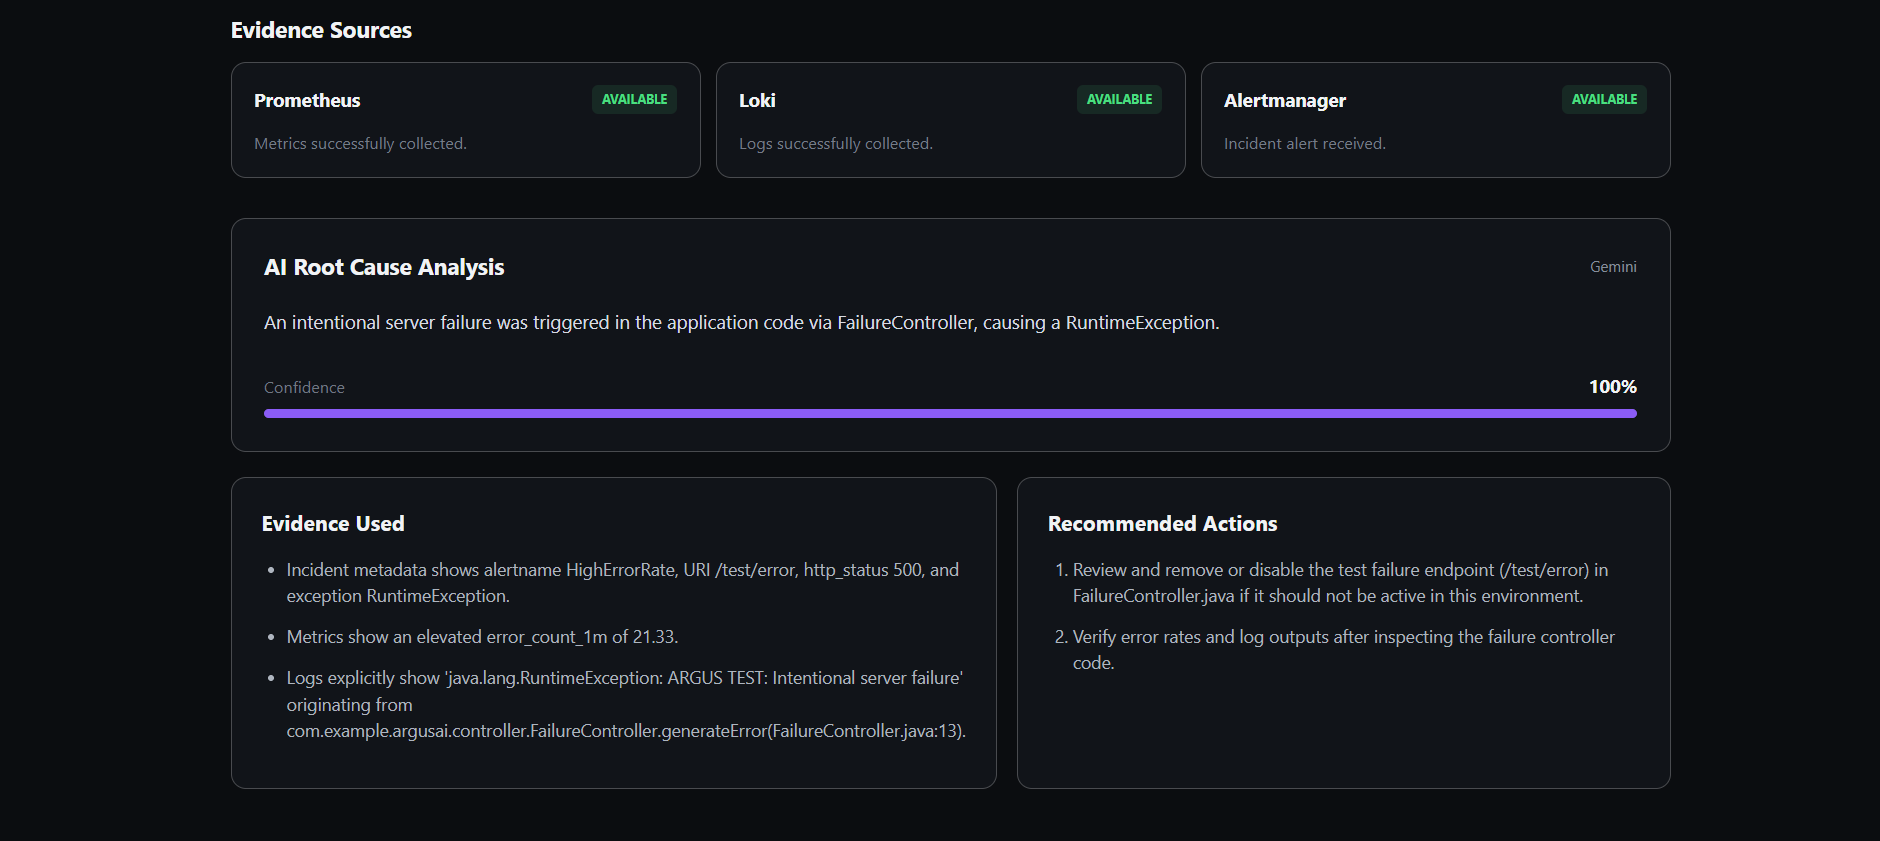
- AI-powered root cause analysis: Uses the Google Gemini API to analyze the collected incident context and identify a probable root cause.
- Evidence-backed recommendations: Produces structured findings, supporting evidence, recommended actions, and a confidence score.
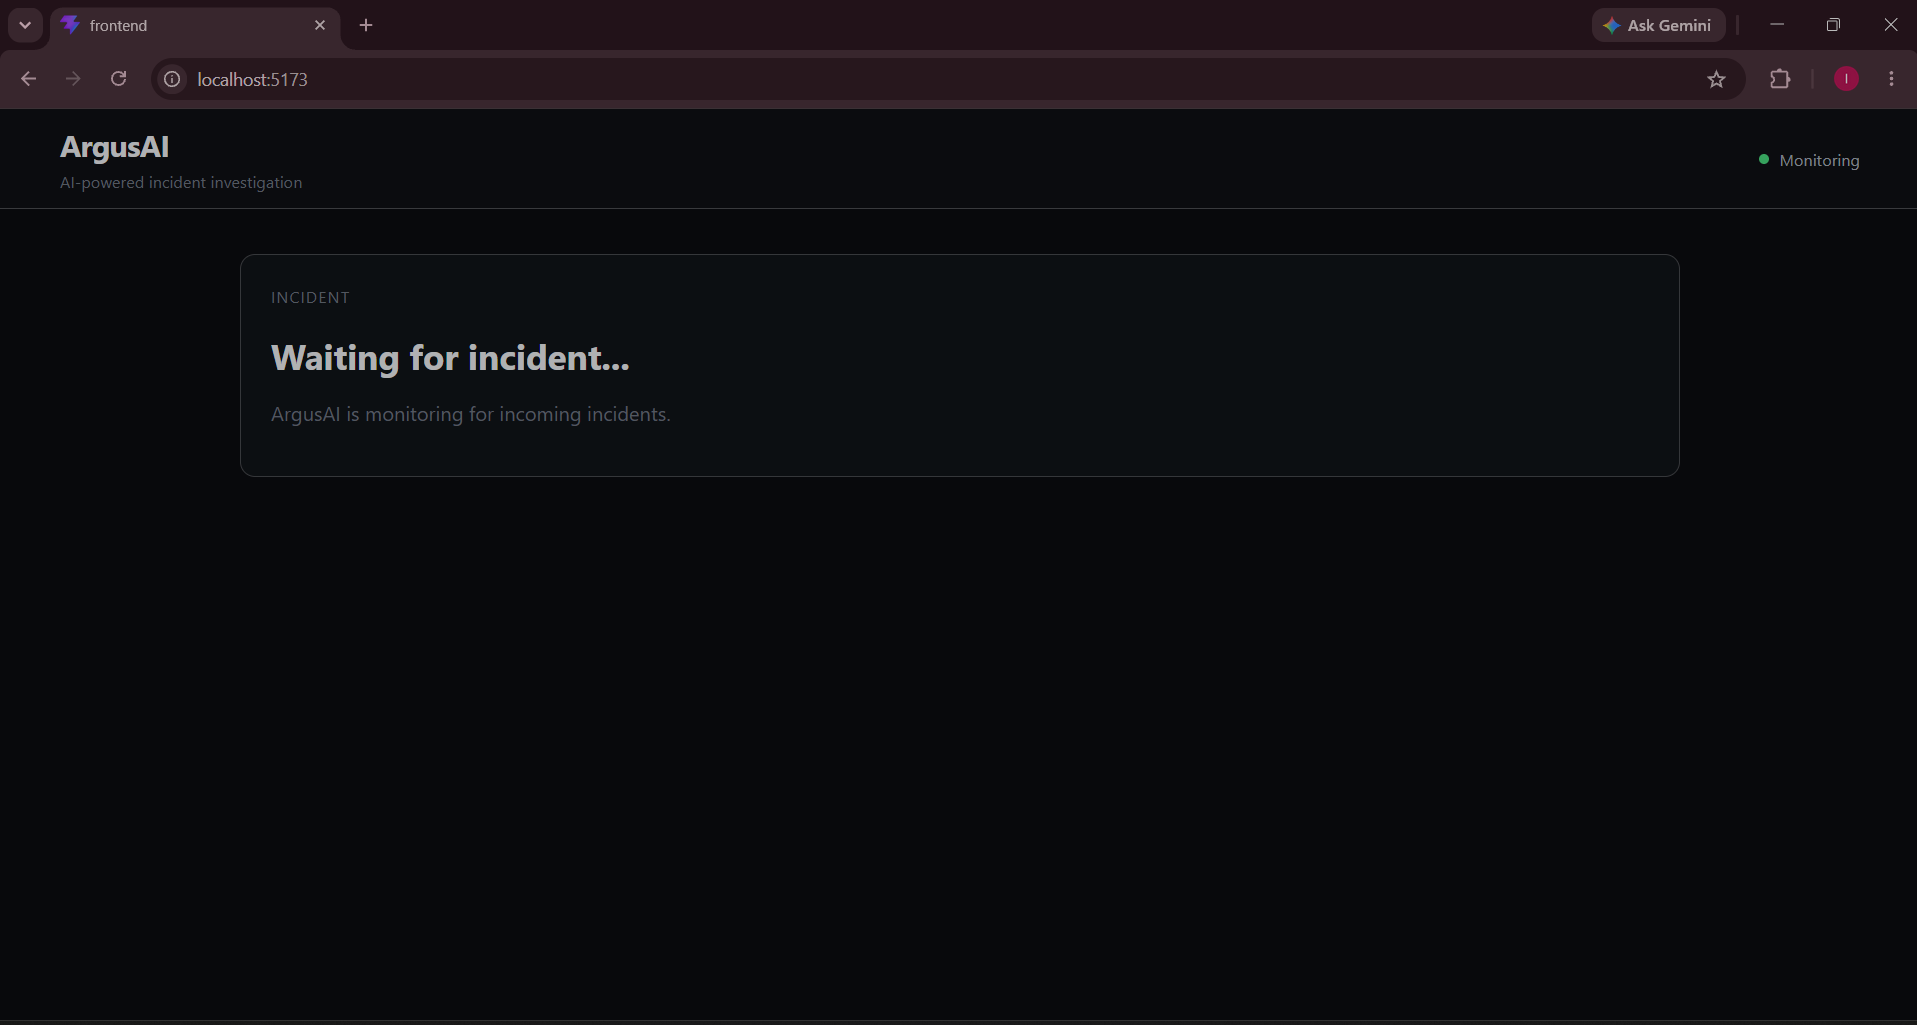
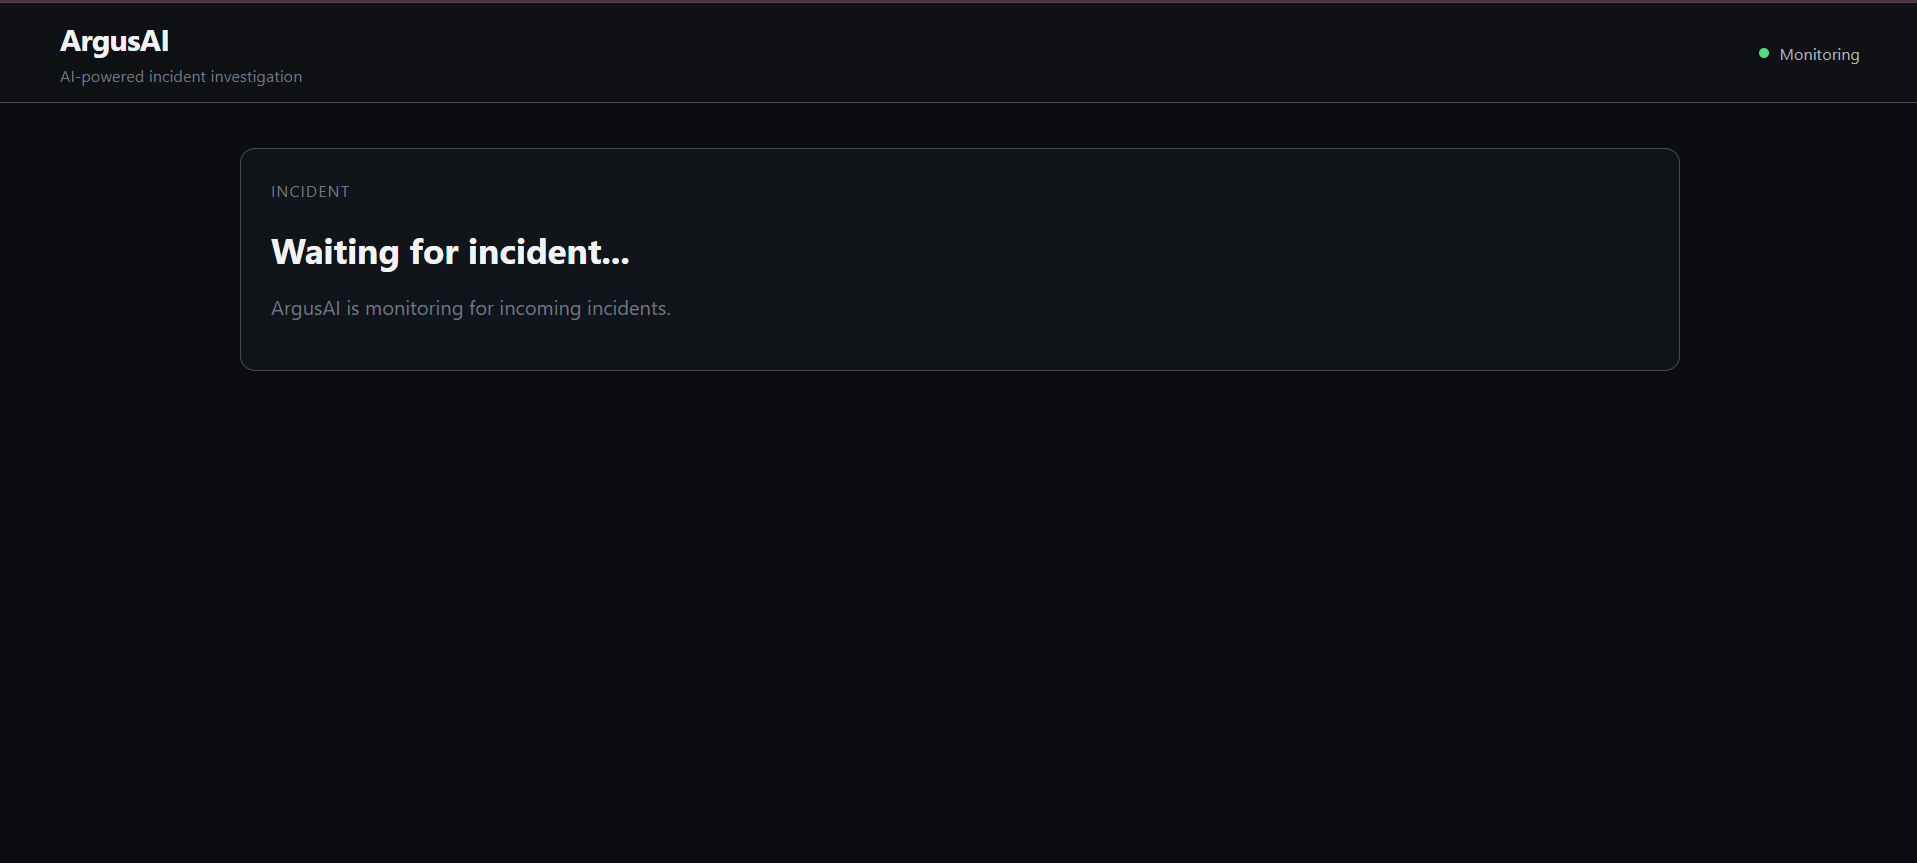
- Real-time incident dashboard: Streams incident updates and analysis to a React frontend using WebSockets.
Instead of making engineers manually correlate multiple sources of telemetry, ArgusAI brings the relevant information together in one workflow.
How We Built It
ArgusAI combines a conventional observability pipeline with an AI-powered analysis service.
Architecture
- Spring Boot application: Generates application telemetry and provides endpoints for testing system failures.
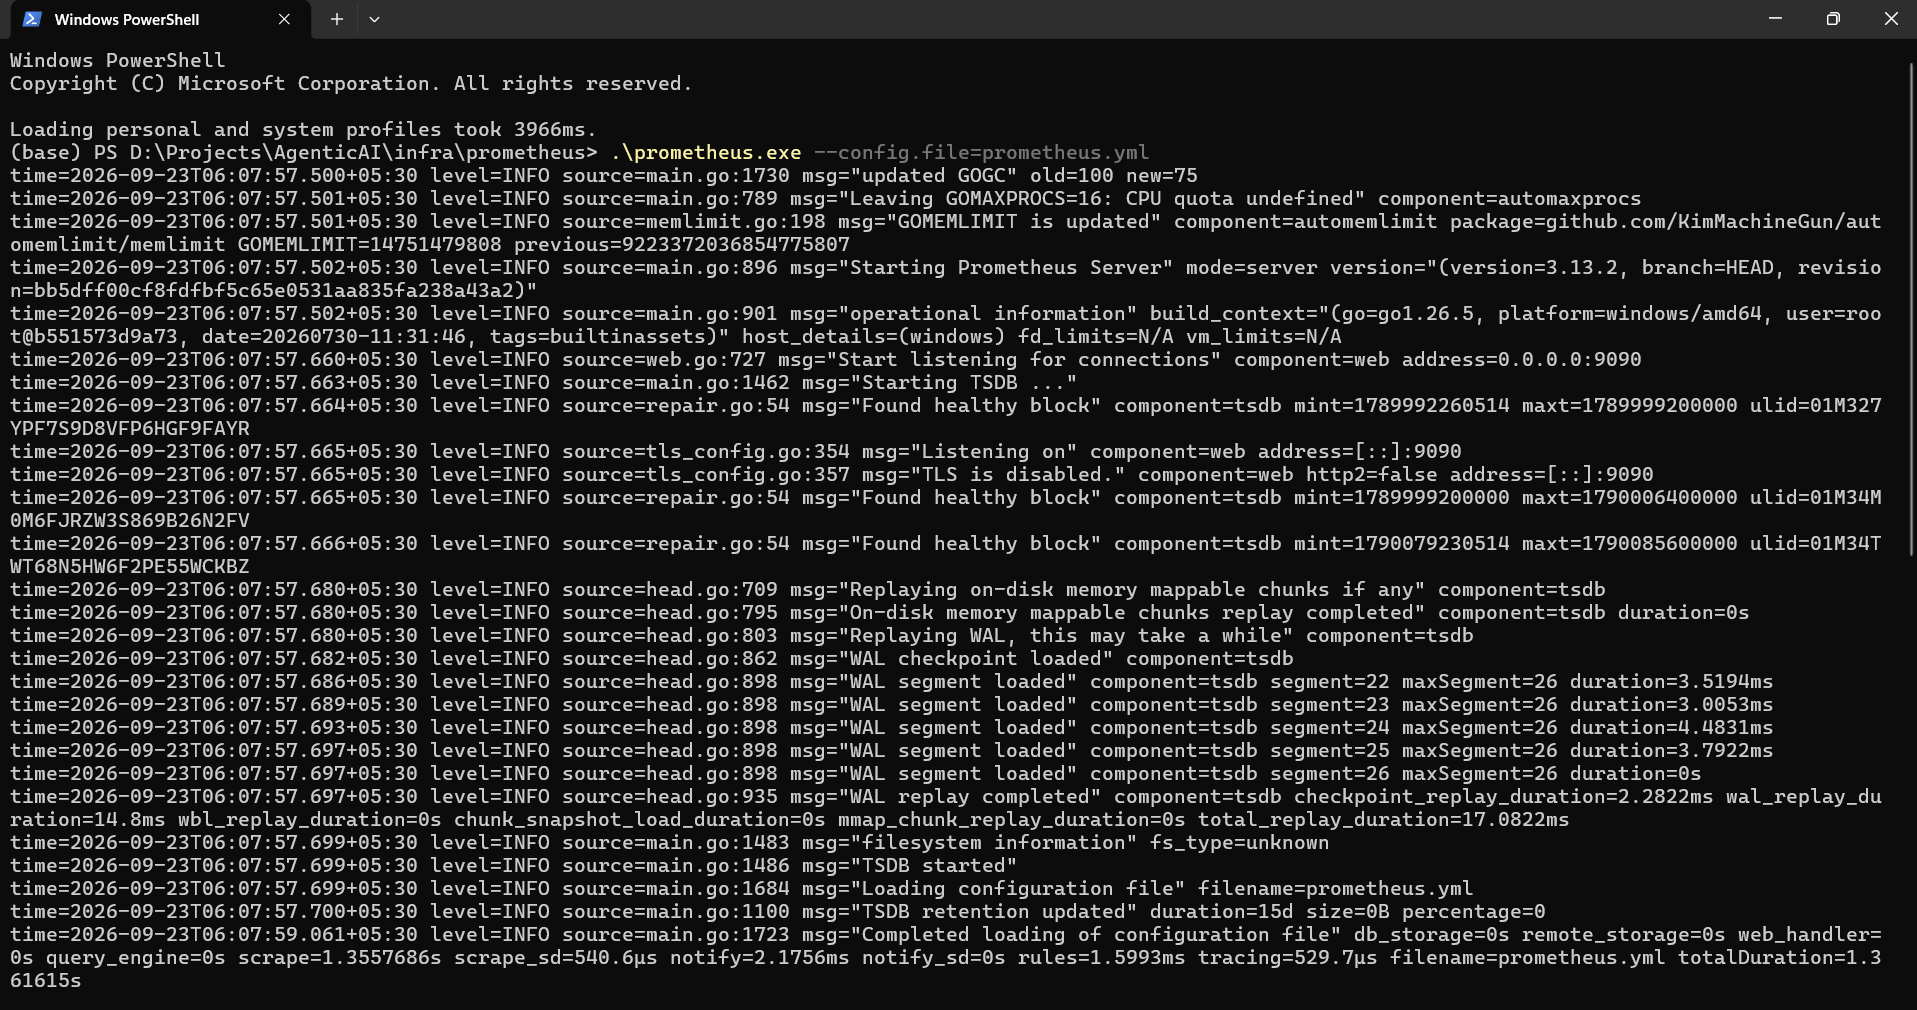
- Prometheus: Collects and stores application metrics.
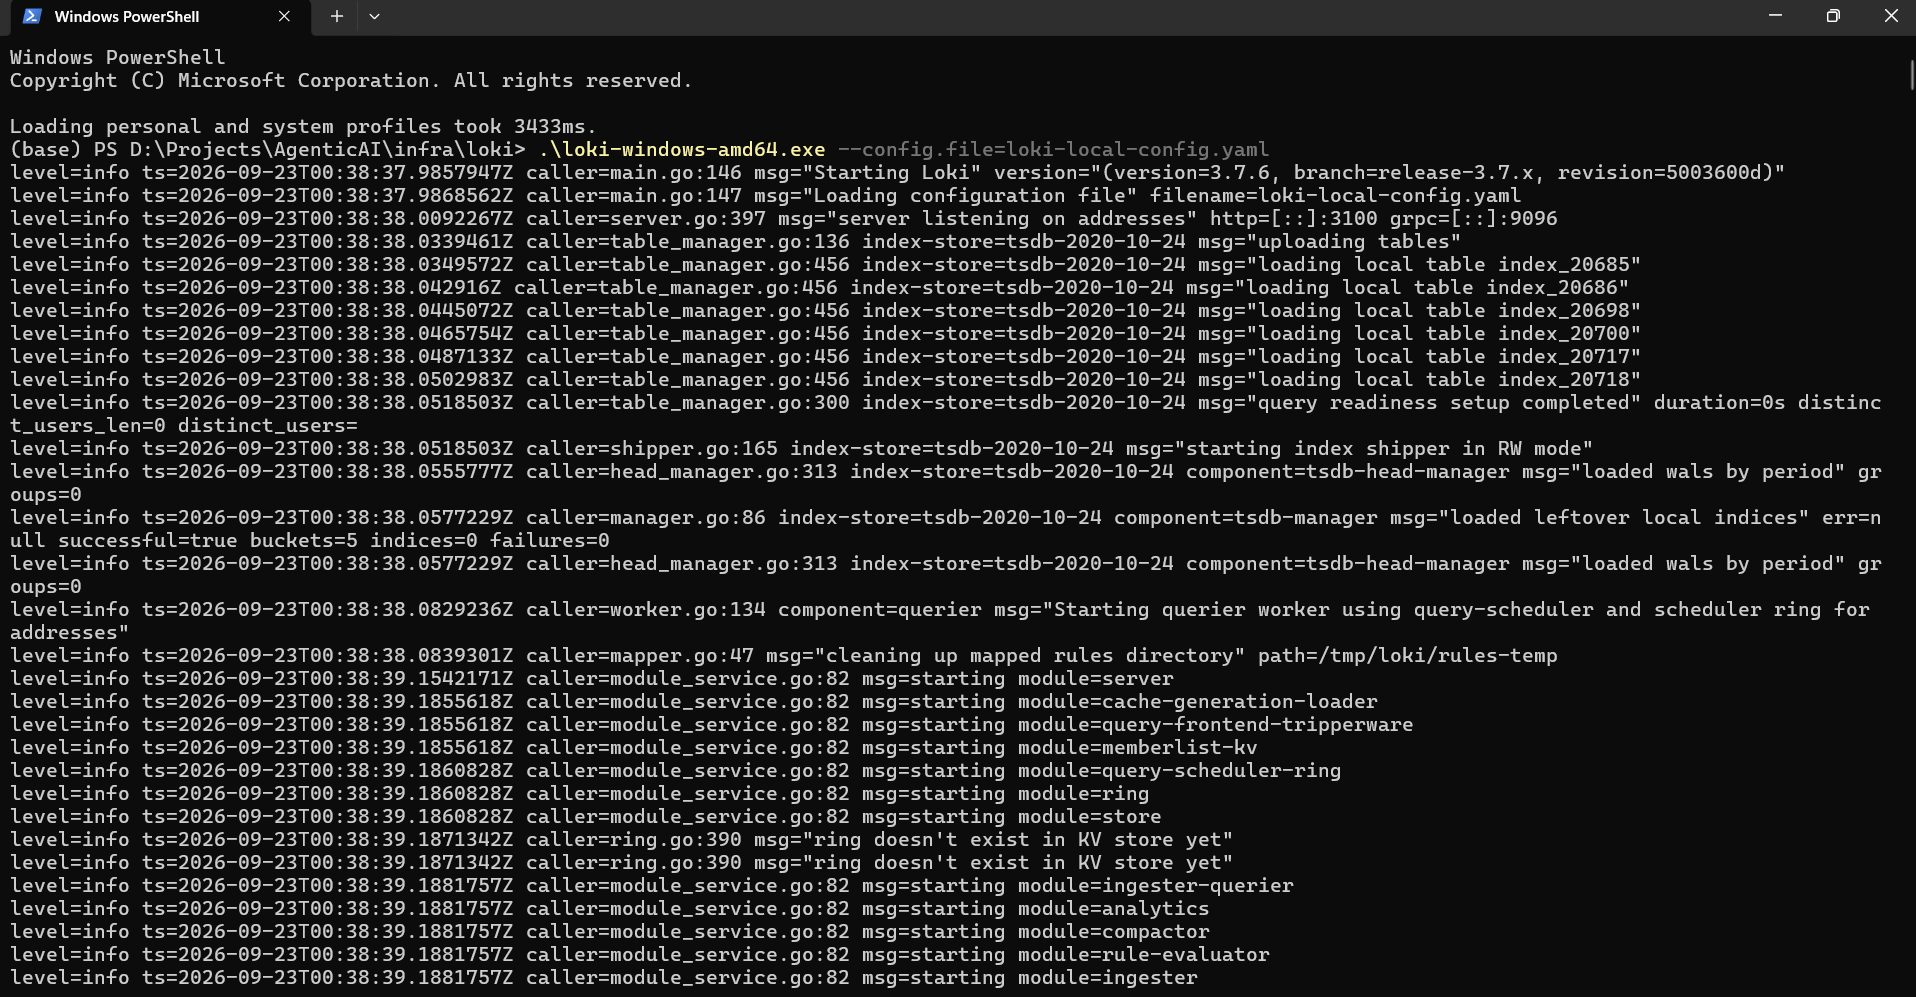
- Grafana Loki and Grafana Alloy: Support application log collection and querying.
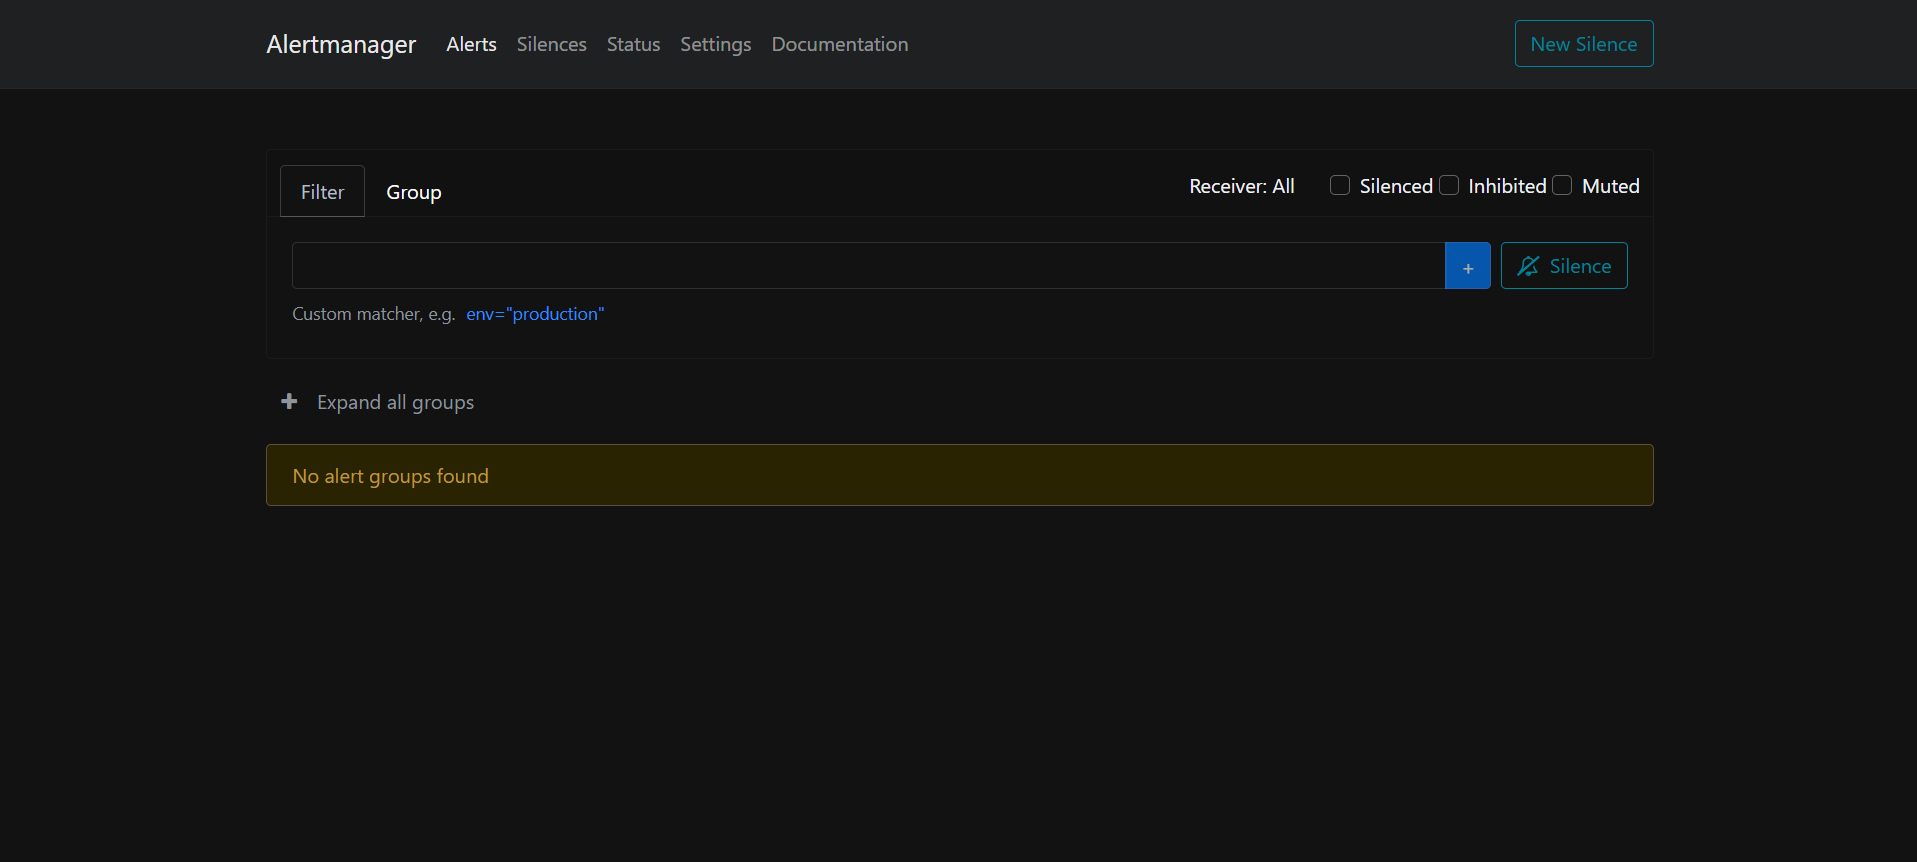
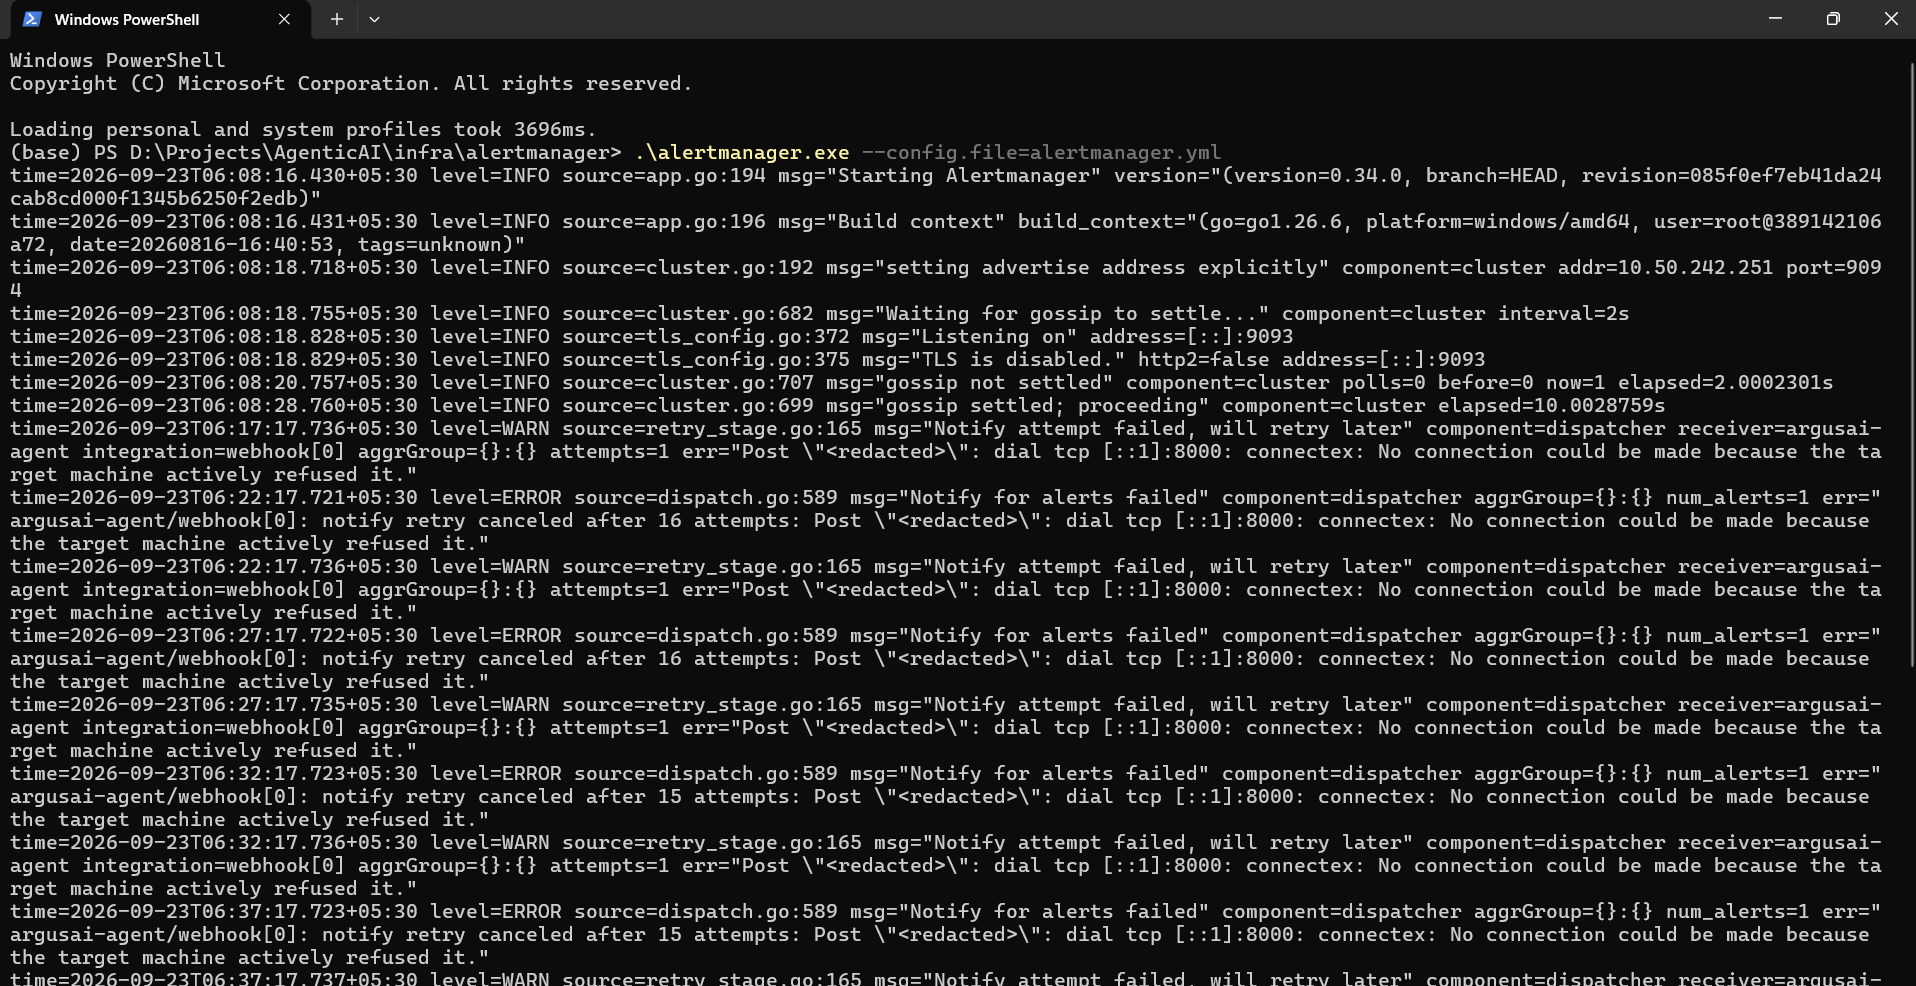
- Alertmanager: Routes triggered alerts to the ArgusAI Agent.
- FastAPI and Python: Receive alerts, retrieve available metrics and logs, and assemble a structured incident context.
- Google Gemini API: Analyzes the incident context and returns a structured root cause analysis, supporting evidence, recommended actions, and confidence.
- React and WebSockets: Display incidents and their analysis through a dashboard that updates in real time.
We separated the monitoring and incident-analysis responsibilities into distinct services so that each component has a clear role in the overall pipeline.
Technology Stack
- Backend: Java, Spring Boot, Python, FastAPI
- Frontend: React, Vite
- AI: Google Gemini API
- Observability: Prometheus, Grafana Loki, Grafana Alloy, Alertmanager
- Communication: REST APIs, WebSockets
Challenges We Faced
Correlating Different Sources of Evidence
Metrics and logs provide different perspectives on the same incident. We needed to collect them into a consistent incident context before sending that information to the AI analysis service.
Making AI Analysis Structured
A free-form AI response is difficult to consume reliably in an application. We used structured data models to organize probable root causes, evidence, recommendations, and confidence scores into a predictable response.
Handling Missing Log Evidence
Log storage and querying may be unavailable even when an alert is received. We implemented graceful Loki failure handling so that an incident can still proceed through analysis when log evidence cannot be retrieved.
Connecting the Backend to a Live Dashboard
We integrated WebSockets to push incident context and AI analysis to the React dashboard, rather than requiring users to refresh the page to see updates.
What We Learned
Building ArgusAI helped us understand how observability systems work together in practice, from collecting application telemetry and routing alerts to retrieving diagnostic evidence and processing incidents through an AI service.
We also learned that an AI-generated explanation is not automatically a verified root cause. Evidence quality, missing telemetry, confidence calibration, and human verification remain important considerations for trustworthy incident analysis.
What's Next
We plan to improve ArgusAI with:
- Better correlation of metrics, logs, and incident timelines.
- More robust handling of monitoring-service failures.
- Stronger validation of AI-generated conclusions against available evidence.
- Incident history, deduplication, and alert-storm handling.
- Human feedback to evaluate the quality of root cause analysis.
- Testing against a wider range of controlled failure scenarios.
The Vision
ArgusAI aims to make incident investigation faster and more systematic by turning fragmented observability data into a clear starting point for engineering action.
Detect the incident. Gather the evidence. Understand the failure. Act with confidence.
Built With
- alertmanager
- artificial-intelligence
- fastapi
- google-gemini-api
- grafana-loki
- java
- large-language-models
- monitoring
- observability
- prometheus
- python
- react
- real-time
- rest-api
- root-cause-analysis
- spring-boot
- vite
- websockets