-
-
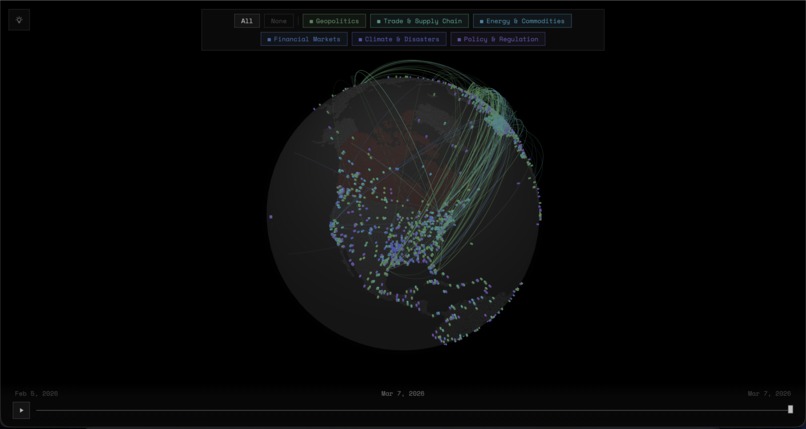
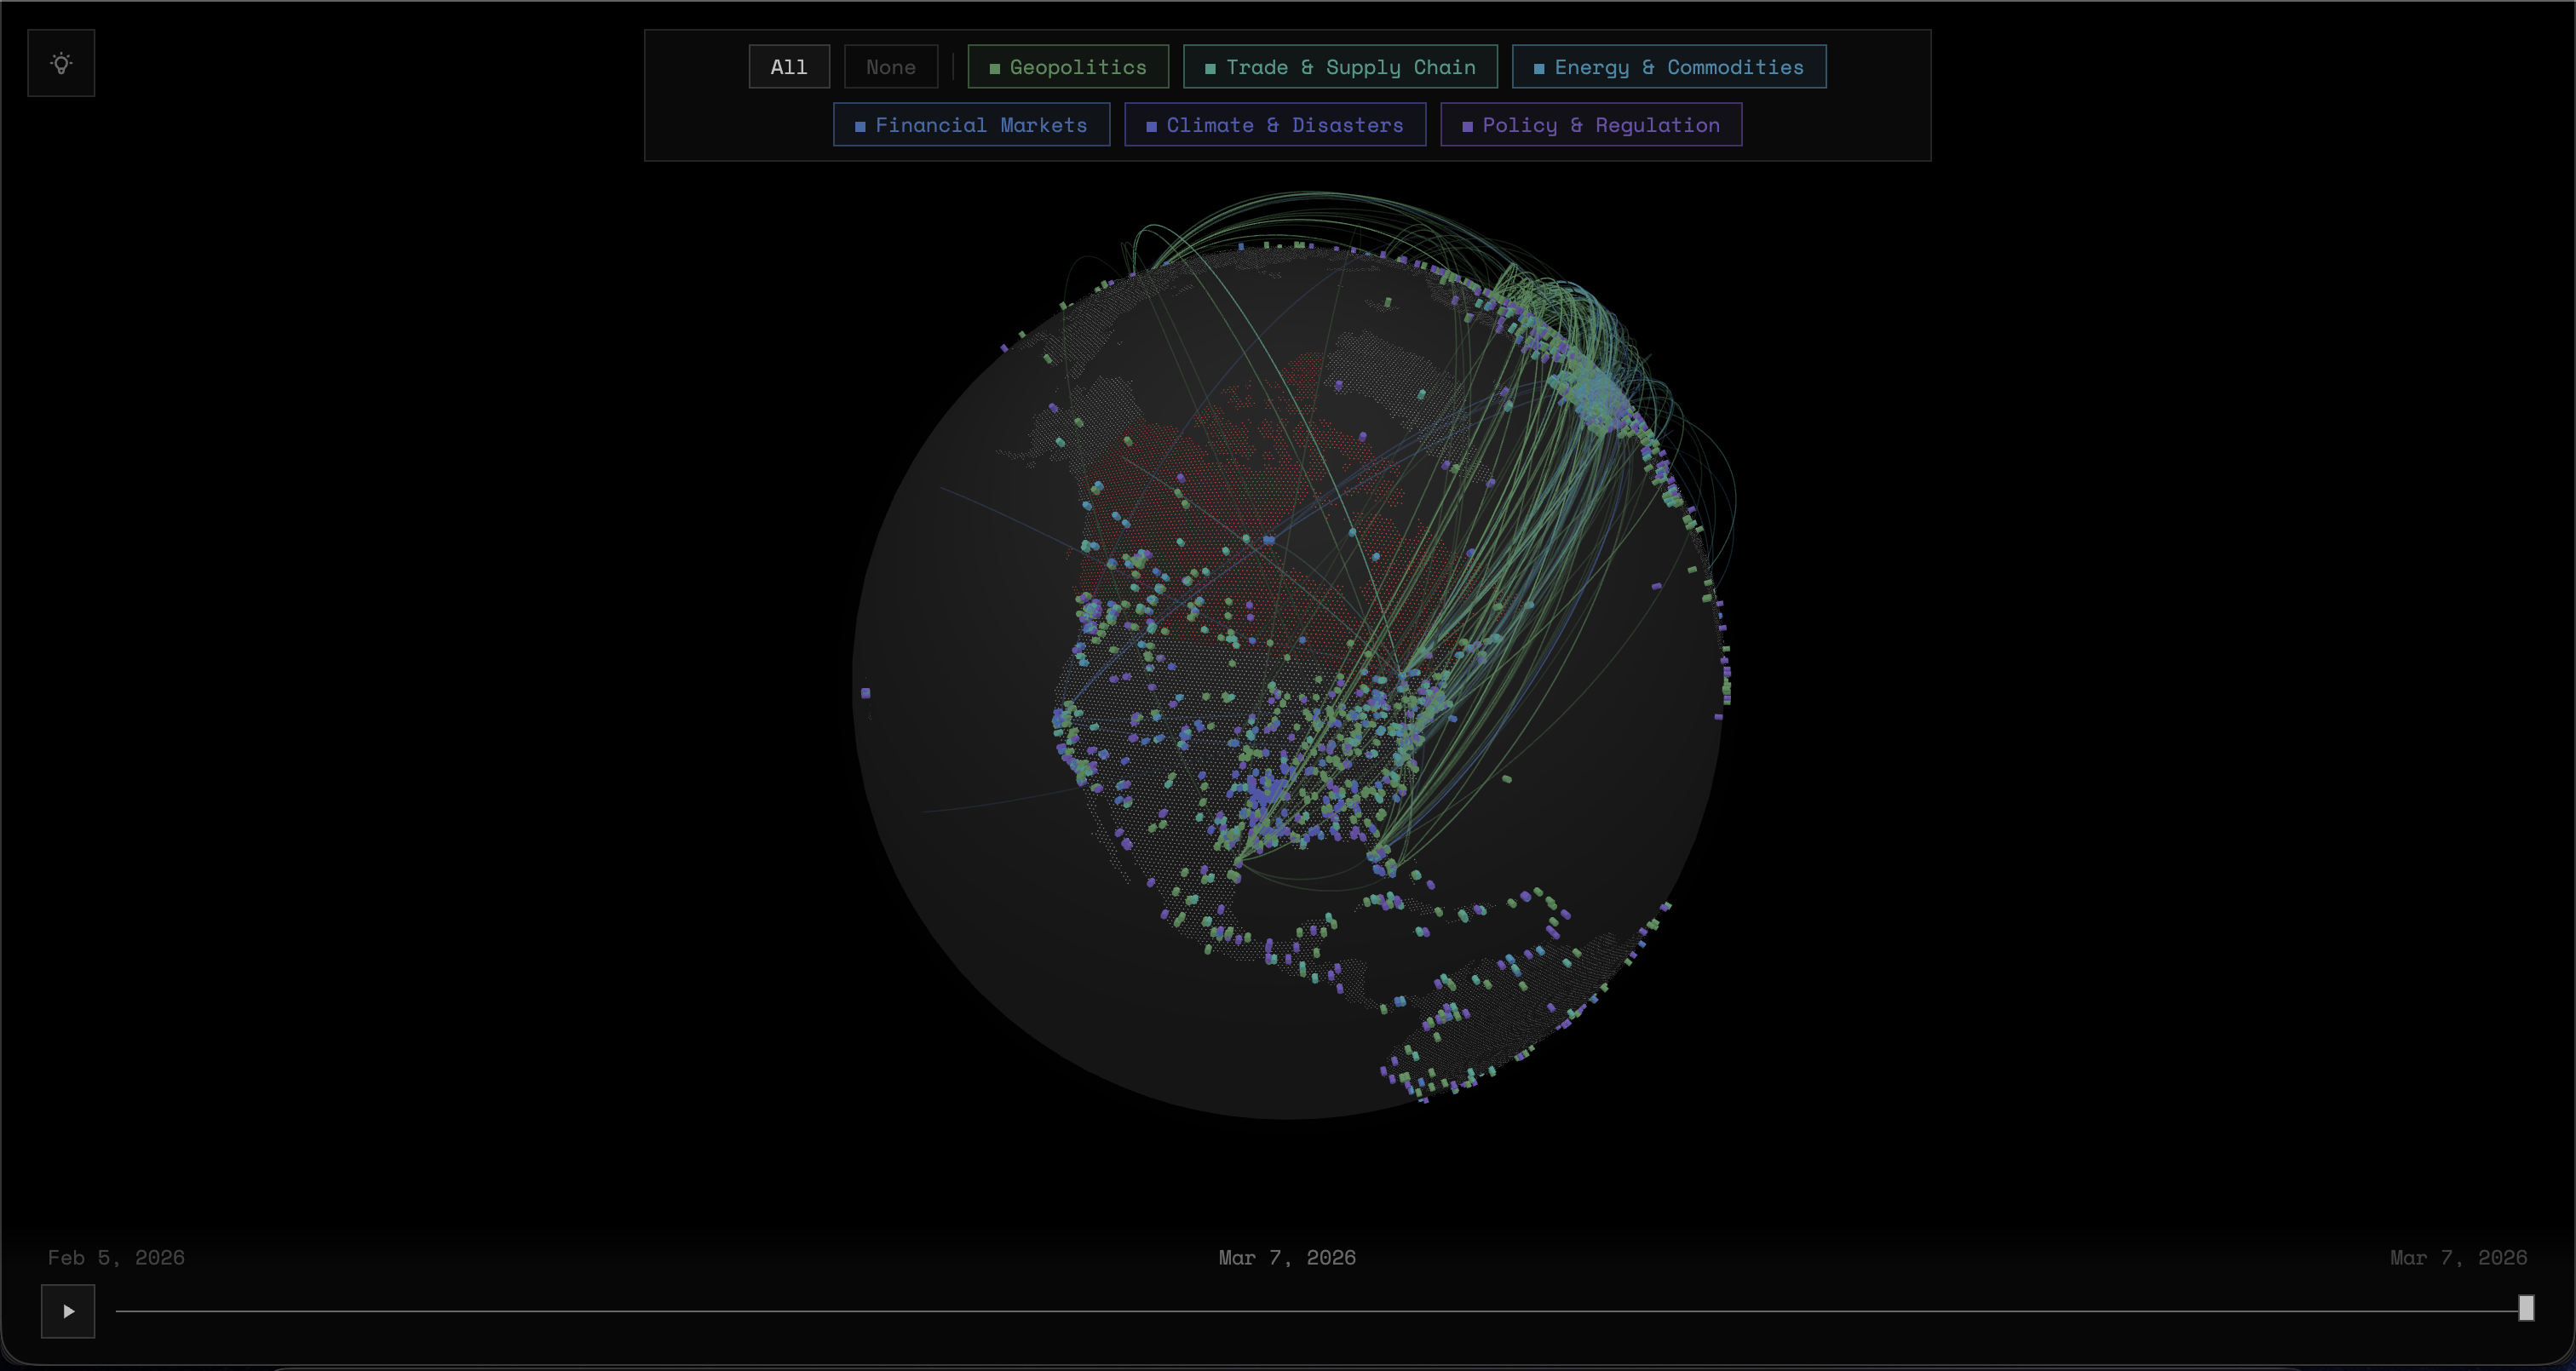
Home View
-
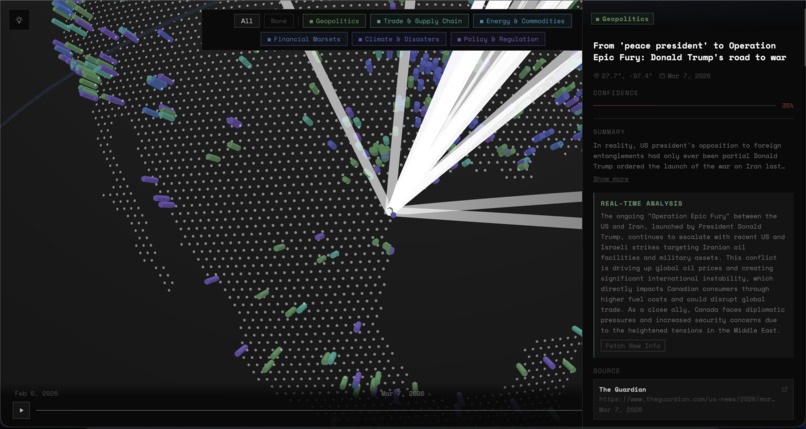
Event Node
-
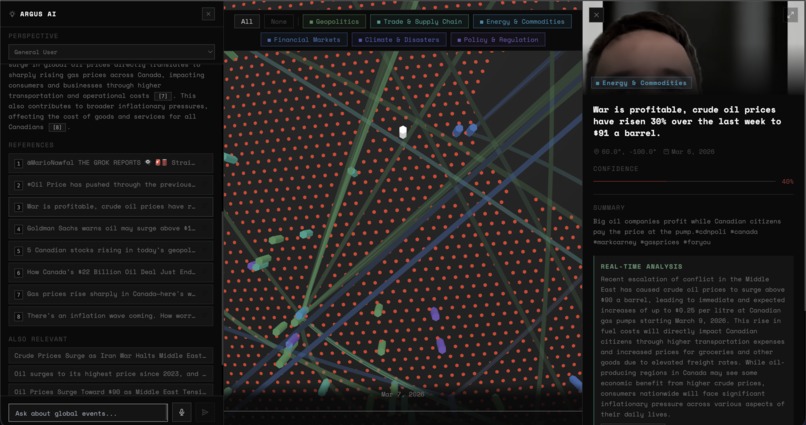
Agent Chat
-

Logo

Inspiration
We believe knowledge about global events should be free, accessible, and understandable for everyone.
Every day, world events shape the Canadian economy. Yet, most people only see fragmented headlines without understanding the larger systems connecting these events.
We built Argus to bridge that gap. Our goal is to give Canadians a clear, intuitive way to explore world events and understand how they directly affect Canada’s economy, markets, and trade.
Inspired by the idea that information should empower citizens, we wanted to transform scattered global data into a visual, intelligent map of cause-and-effect across the planet.
What it does
Argus is a real-time global event intelligence platform that explains why world events matter to the Canadian economy.
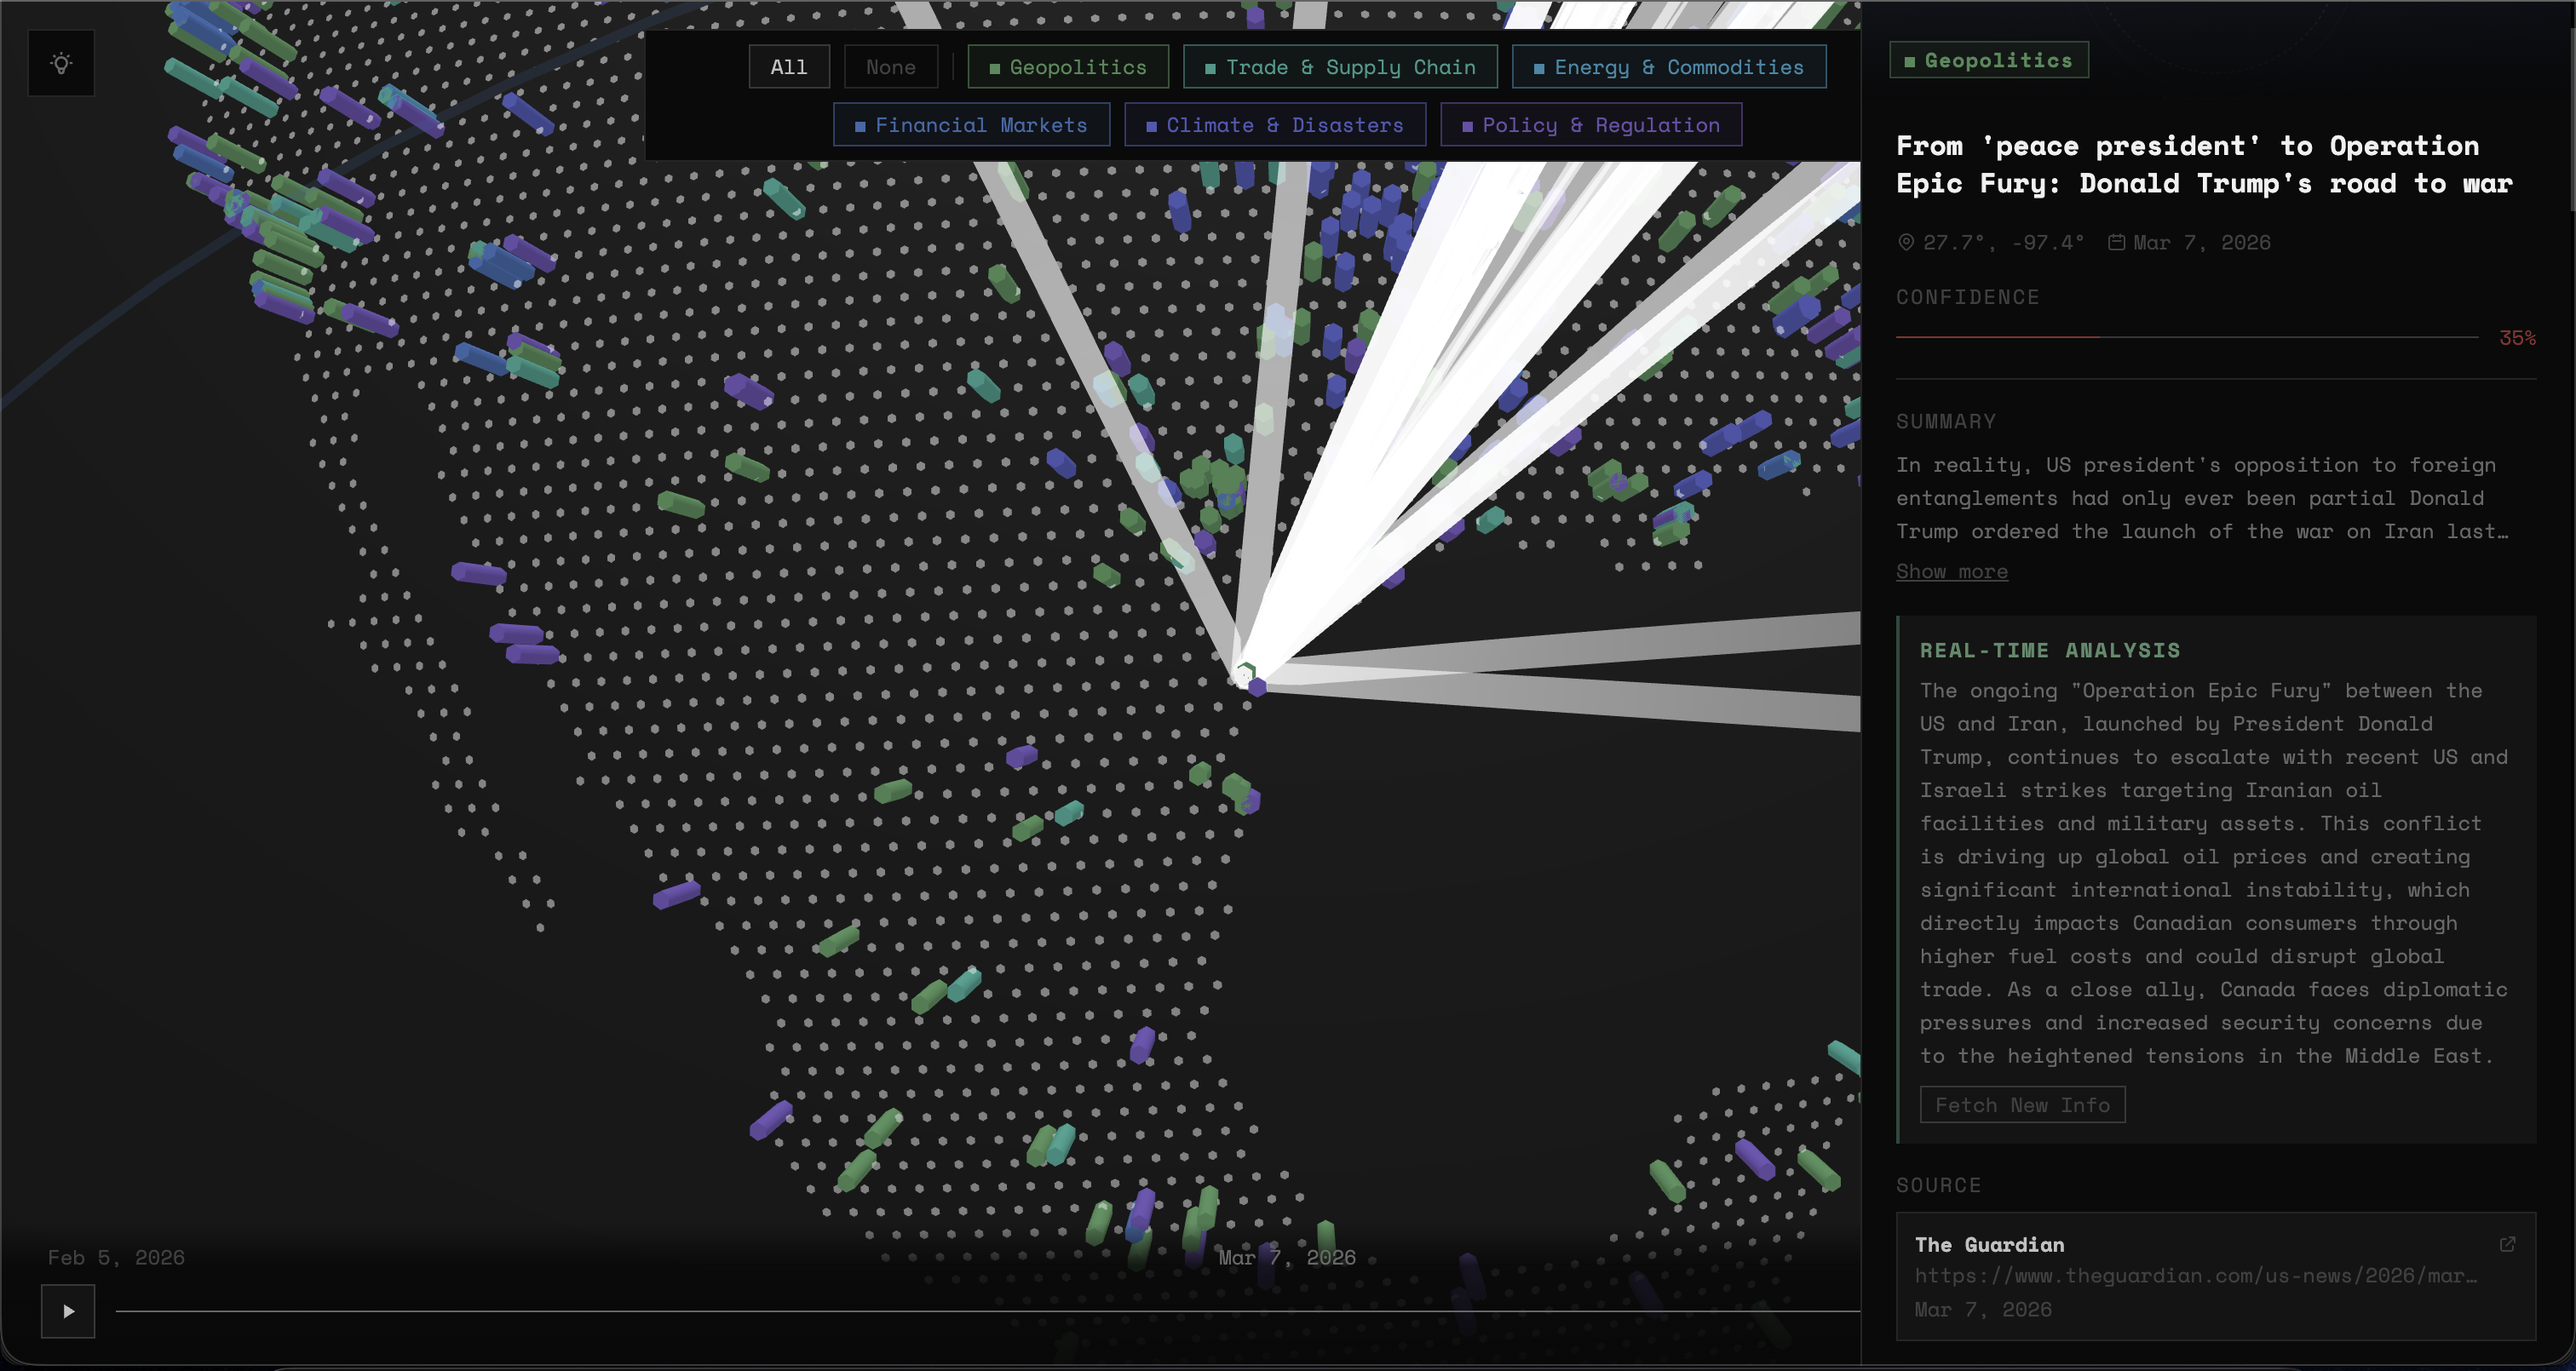
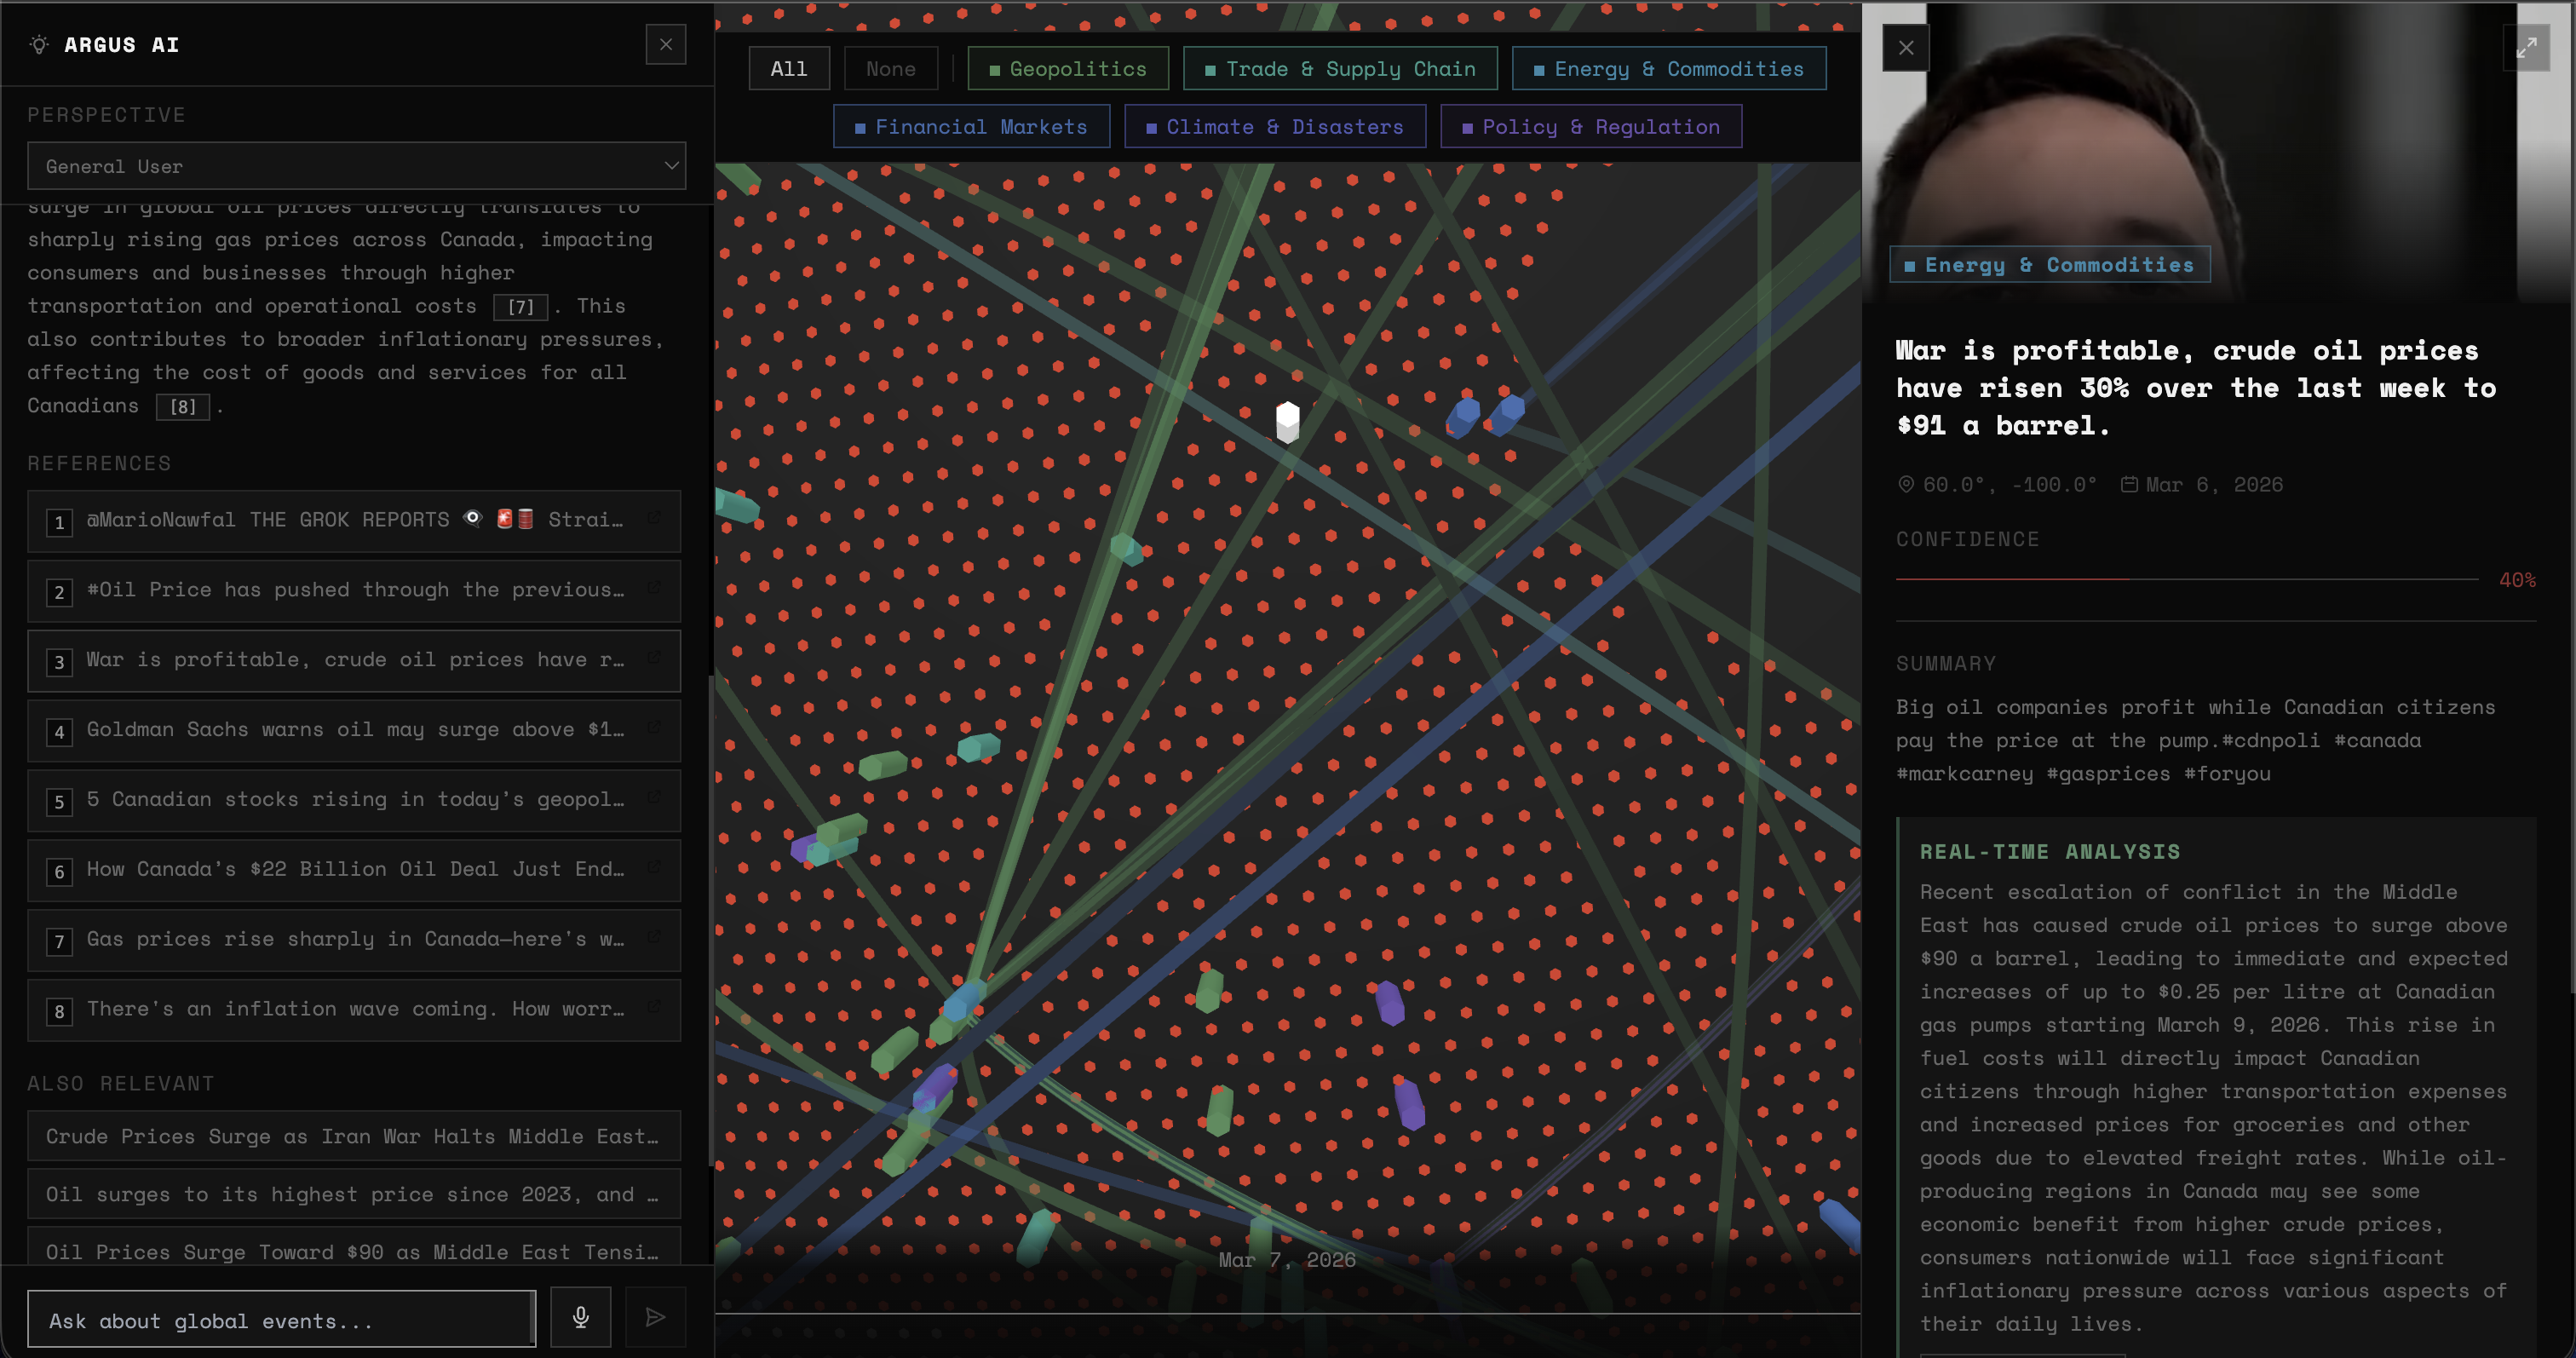
At the center of the experience is an interactive 3D globe where global events appear as dynamic nodes. Each event is categorized by type (geopolitics, trade, energy, financial markets, climate, or policy) and visually connected to related events through relationship arcs.
Users can click on any event to explore:
- A summary of what happened
- An explanation of its impact on Canada
- Related media from News Sources, X, and TikTok
- Supporting sources
- Related events forming larger global narratives
Argus also includes an AI Copilot that allows users to ask natural language questions such as:
- “How could tensions in the Middle East affect Canadian oil prices?”
- “What global events are impacting Canadian supply chains right now?”
The AI analyzes relevant events and navigates the globe to highlight the most important connections, helping users quickly understand the global context behind the news.
How we built it
Argus is a full-stack application combining AI, data pipelines, and 3D visualization.
- Frontend: React + Three.js + Tailwind CSS
- Backend: FastAPI (Python)
- Database: AWS PostgreSQL
- AI:
- Google Gemini (AI agent & analysis)
- Chutes AI (event geocoding)
- ElevenLabs (voice input / speech-to-text)
- Media: Cloudinary (event hero images)
The system aggregates global events, enriches them with AI analysis, and maps them geographically so they can be explored visually on the globe.
Challenges we ran into
Scraping and data collection
One of our biggest challenges was collecting data from multiple online sources while avoiding API rate limits and scraping restrictions. Many platforms restrict automated access, so we had to carefully design our pipeline to prevent bans while still gathering diverse information.
Normalizing messy real-world data
Data scraped from different platforms rarely comes in a consistent format. Many events were missing key attributes like timestamps, locations, or categories.
We built normalization pipelines to infer missing fields and ensure every event contained the parameters required by the system.
Scaling relationship computation
Another major challenge was computing relationships between events. Many connections are not purely semantic, but are logical and causal relationships between markets, commodities, policies, and supply chains.
Computing relationships across tens of thousands of potential events would be extremely expensive. Instead of brute-forcing comparisons across the entire dataset, we designed filtering and similarity strategies to dramatically reduce the number of comparisons while still capturing meaningful connections.
Accomplishments that we're proud of
- Scraping 20,000+ points of data and aggregating them under on centralized platform to be displayed with minimal lag
- Working with countless new APIs and software to deal with the various rules and issues around scraping
- Implementing various SOTA techniques with RAG and context management to handle size of data without context rot
What we learned
Kaibo -> I learned how to build relationships between events beyond simple semantic similarity. I also built web scrapers and data pipelines to aggregate a 20,000+ row PostgreSQL event database, which taught me how to work with messy real-world data and scraping limitations.
Lucas -> I learned how to design systems architecture at a larger scale (with tens of thousands of data points), focusing on concepts like caching, data pipeline design, and efficient database queries
Tony -> I learned how to normalize and turn messy real world data from data from multiple sources into a useable intelligence product by designing ingestion pipelines, structured storage, geospatial visualization, and persona-aware AI analysis.
Ryan -> I learned how to set up large AWS S3 and Postgres databases and assign safe permissions to team members without exposing any open ports to the internet. I learned how to design scalable query tables to efficiently score hundreds of thousands of data columns while ensuring ACID principles.
What's next for Argus
As mentioned, the inspiration and main goal of Argus was to make access to up-to-date and pressing information widely accessible. So, in the future, we would like to expand Argus beyond simply Canadian issues, focusing instead on providing live up-to-date information on the happenings of every single thing around the world. We recognize the difficulty of accomplishing this, especially as more information gets posted on the internet every day. But, we hope that Argus will allow everyone to stay informed, stay safe, and stay protected against any misfortunes that may befall them.
Built With
- amazon-ec2
- amazon-web-services
- beautiful-soup
- cloudinary
- elevenlabs
- fastapi
- playwright
- react
- s3
- sqlite
- three.js


Log in or sign up for Devpost to join the conversation.