-
-
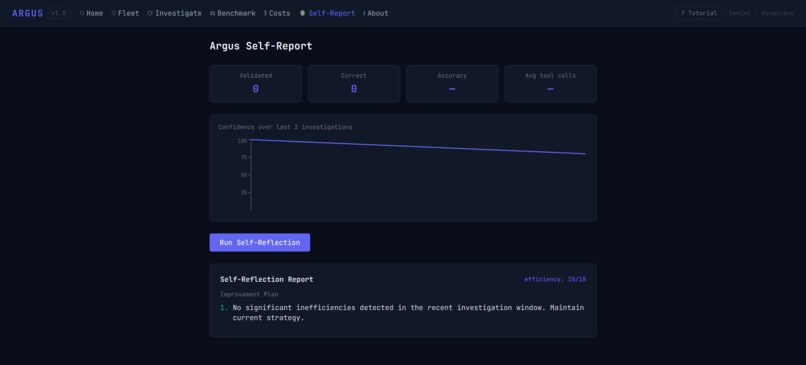
Self-Report
-
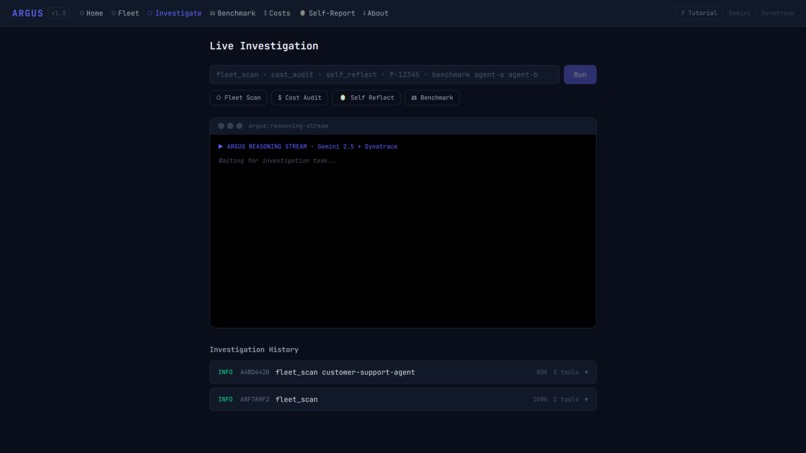
Investigate the Agents
-
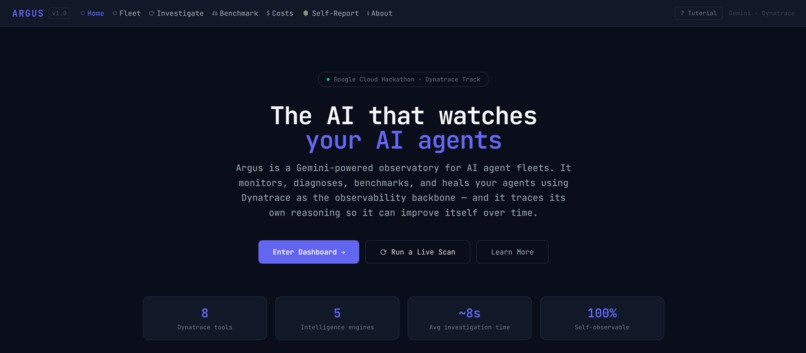
Homepage
-
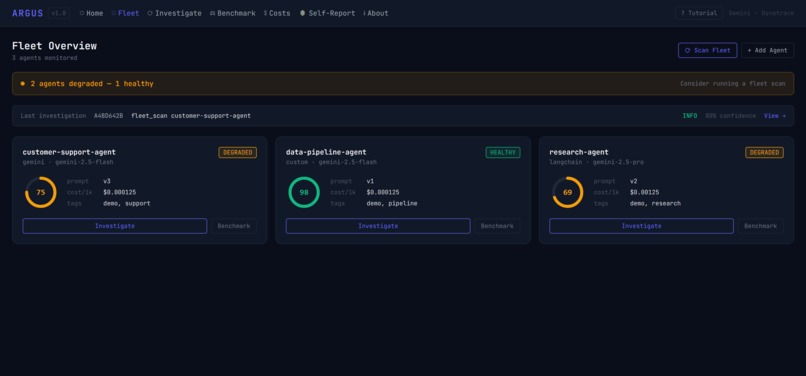
Fleet of Agents
-
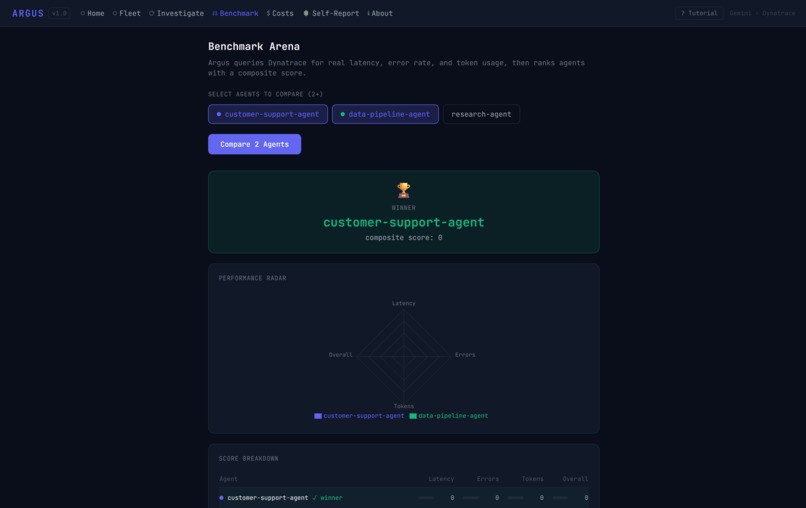
Benchmarks Agents
-
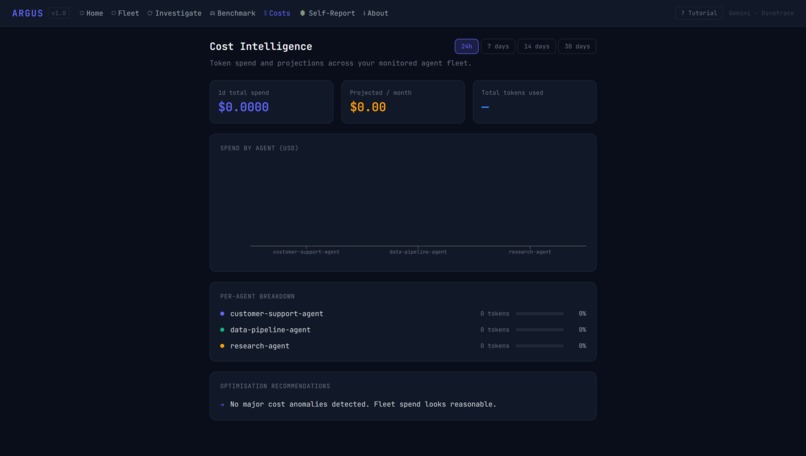
Costs of Agents
-
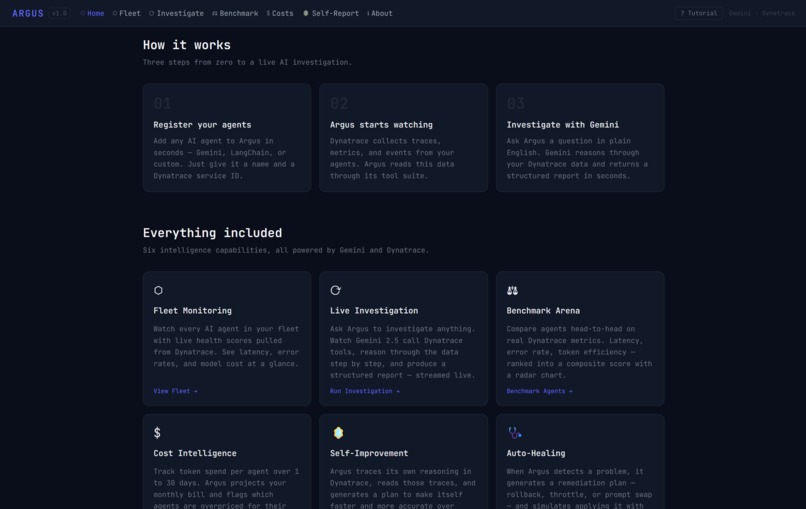
How it Works
-
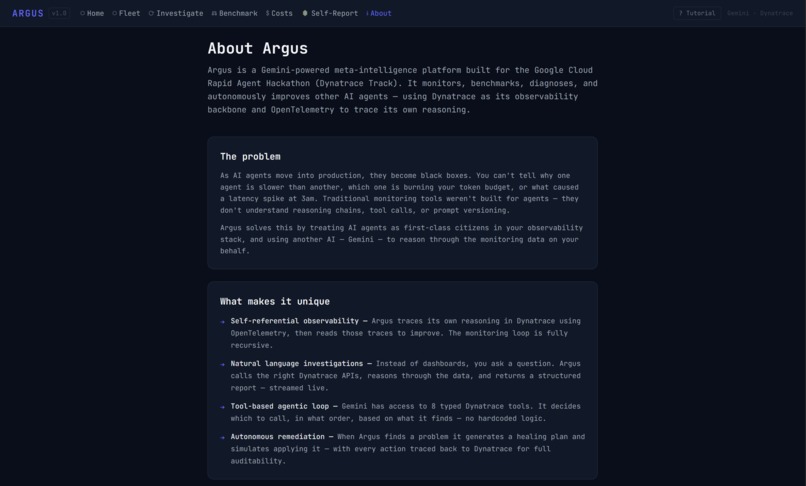
About Argus
What is Argus?
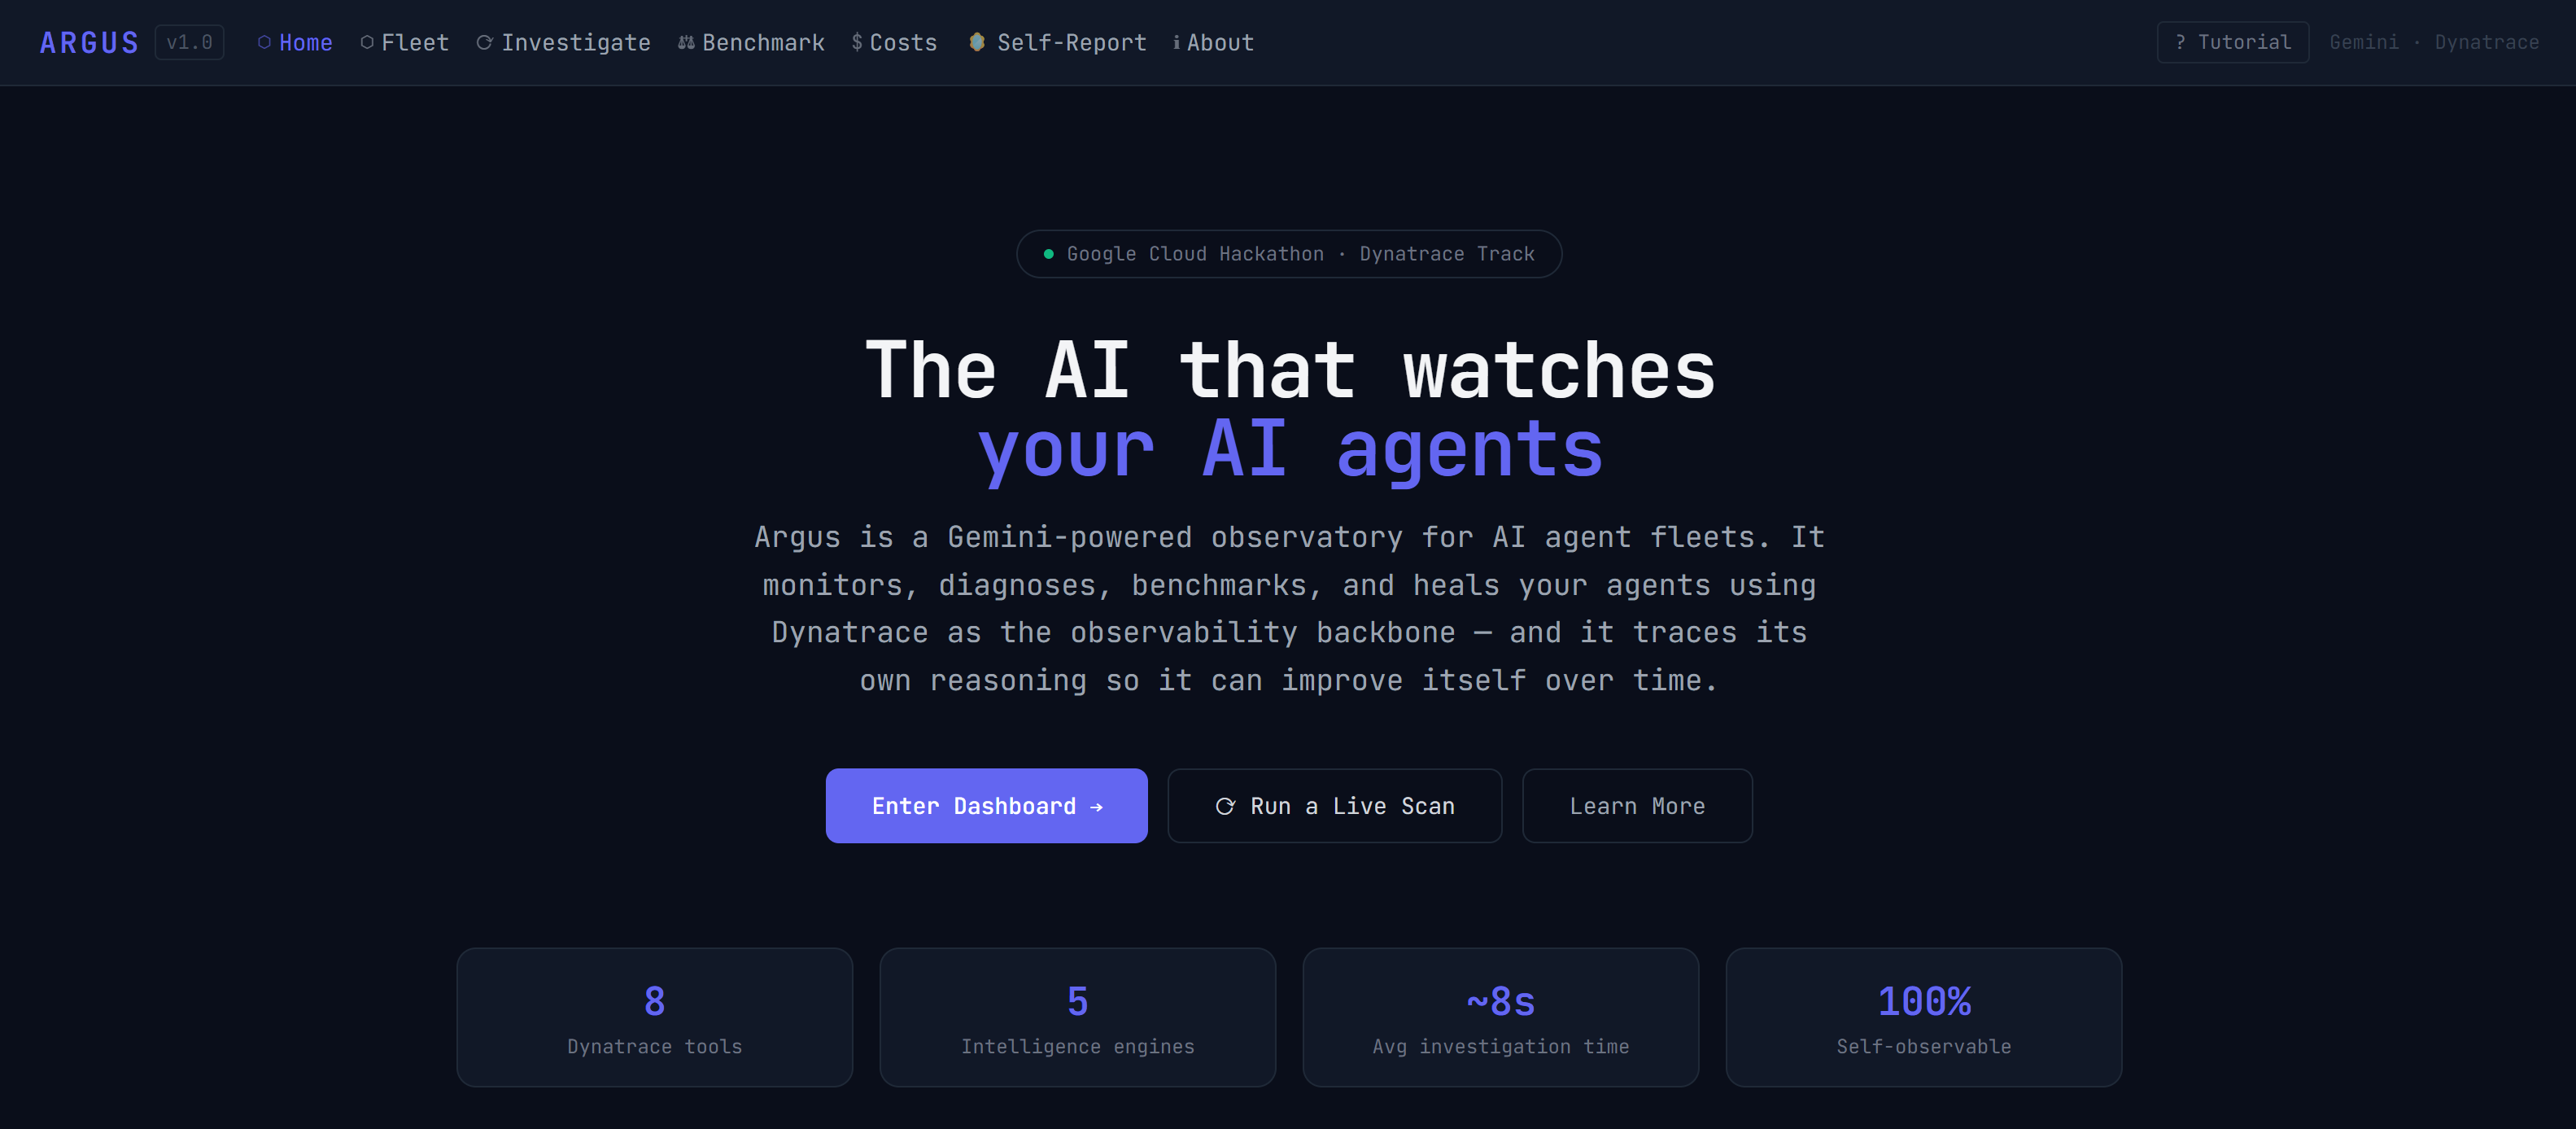
Argus is a Gemini-powered AI observatory that monitors, diagnoses, benchmarks, and autonomously heals other AI agents using Dynatrace as its observability backbone and OpenTelemetry to trace its own reasoning.
The core idea: an AI that watches your AIs, and watches itself.
Inspiration
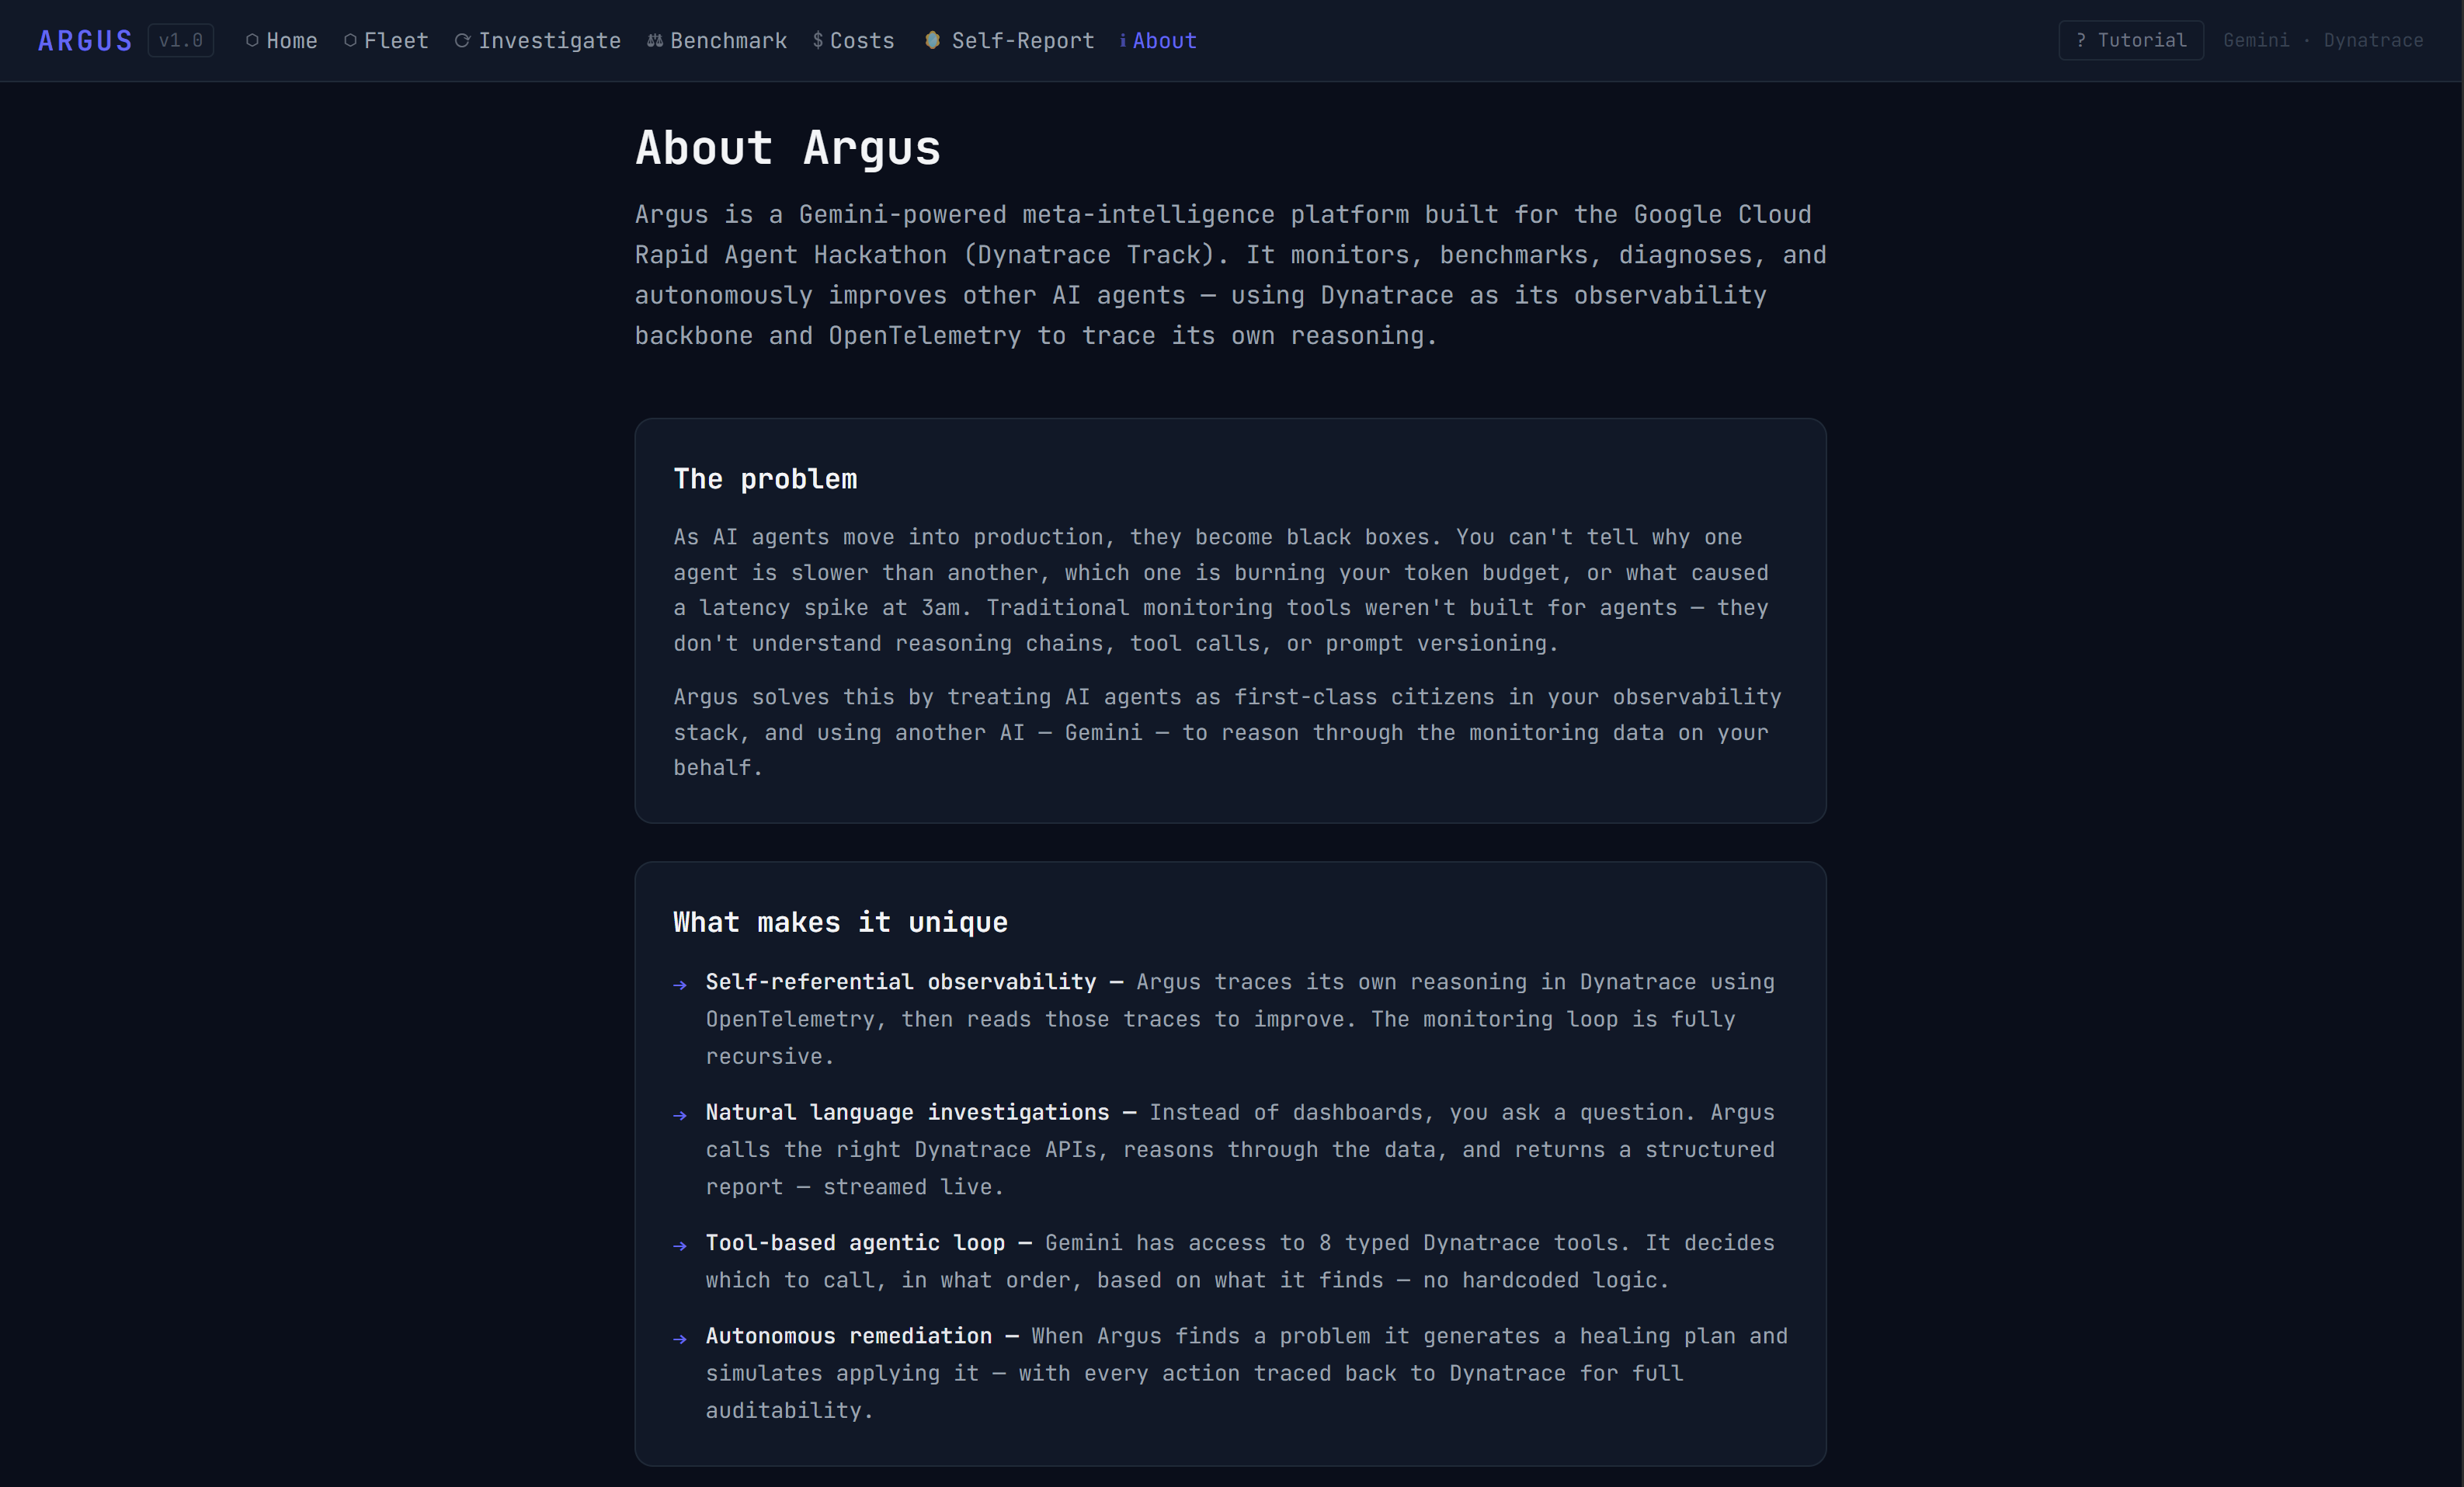
As AI agents move into production, they become black boxes. You can't tell why one agent is slower than another, which one is burning your token budget, or what caused a latency spike at 3am. Traditional monitoring tools weren't built for agents and don't understand reasoning chains, tool calls, or prompt versioning.
We wanted to close that gap by using Gemini to reason through observability data, not just display it.
What it does
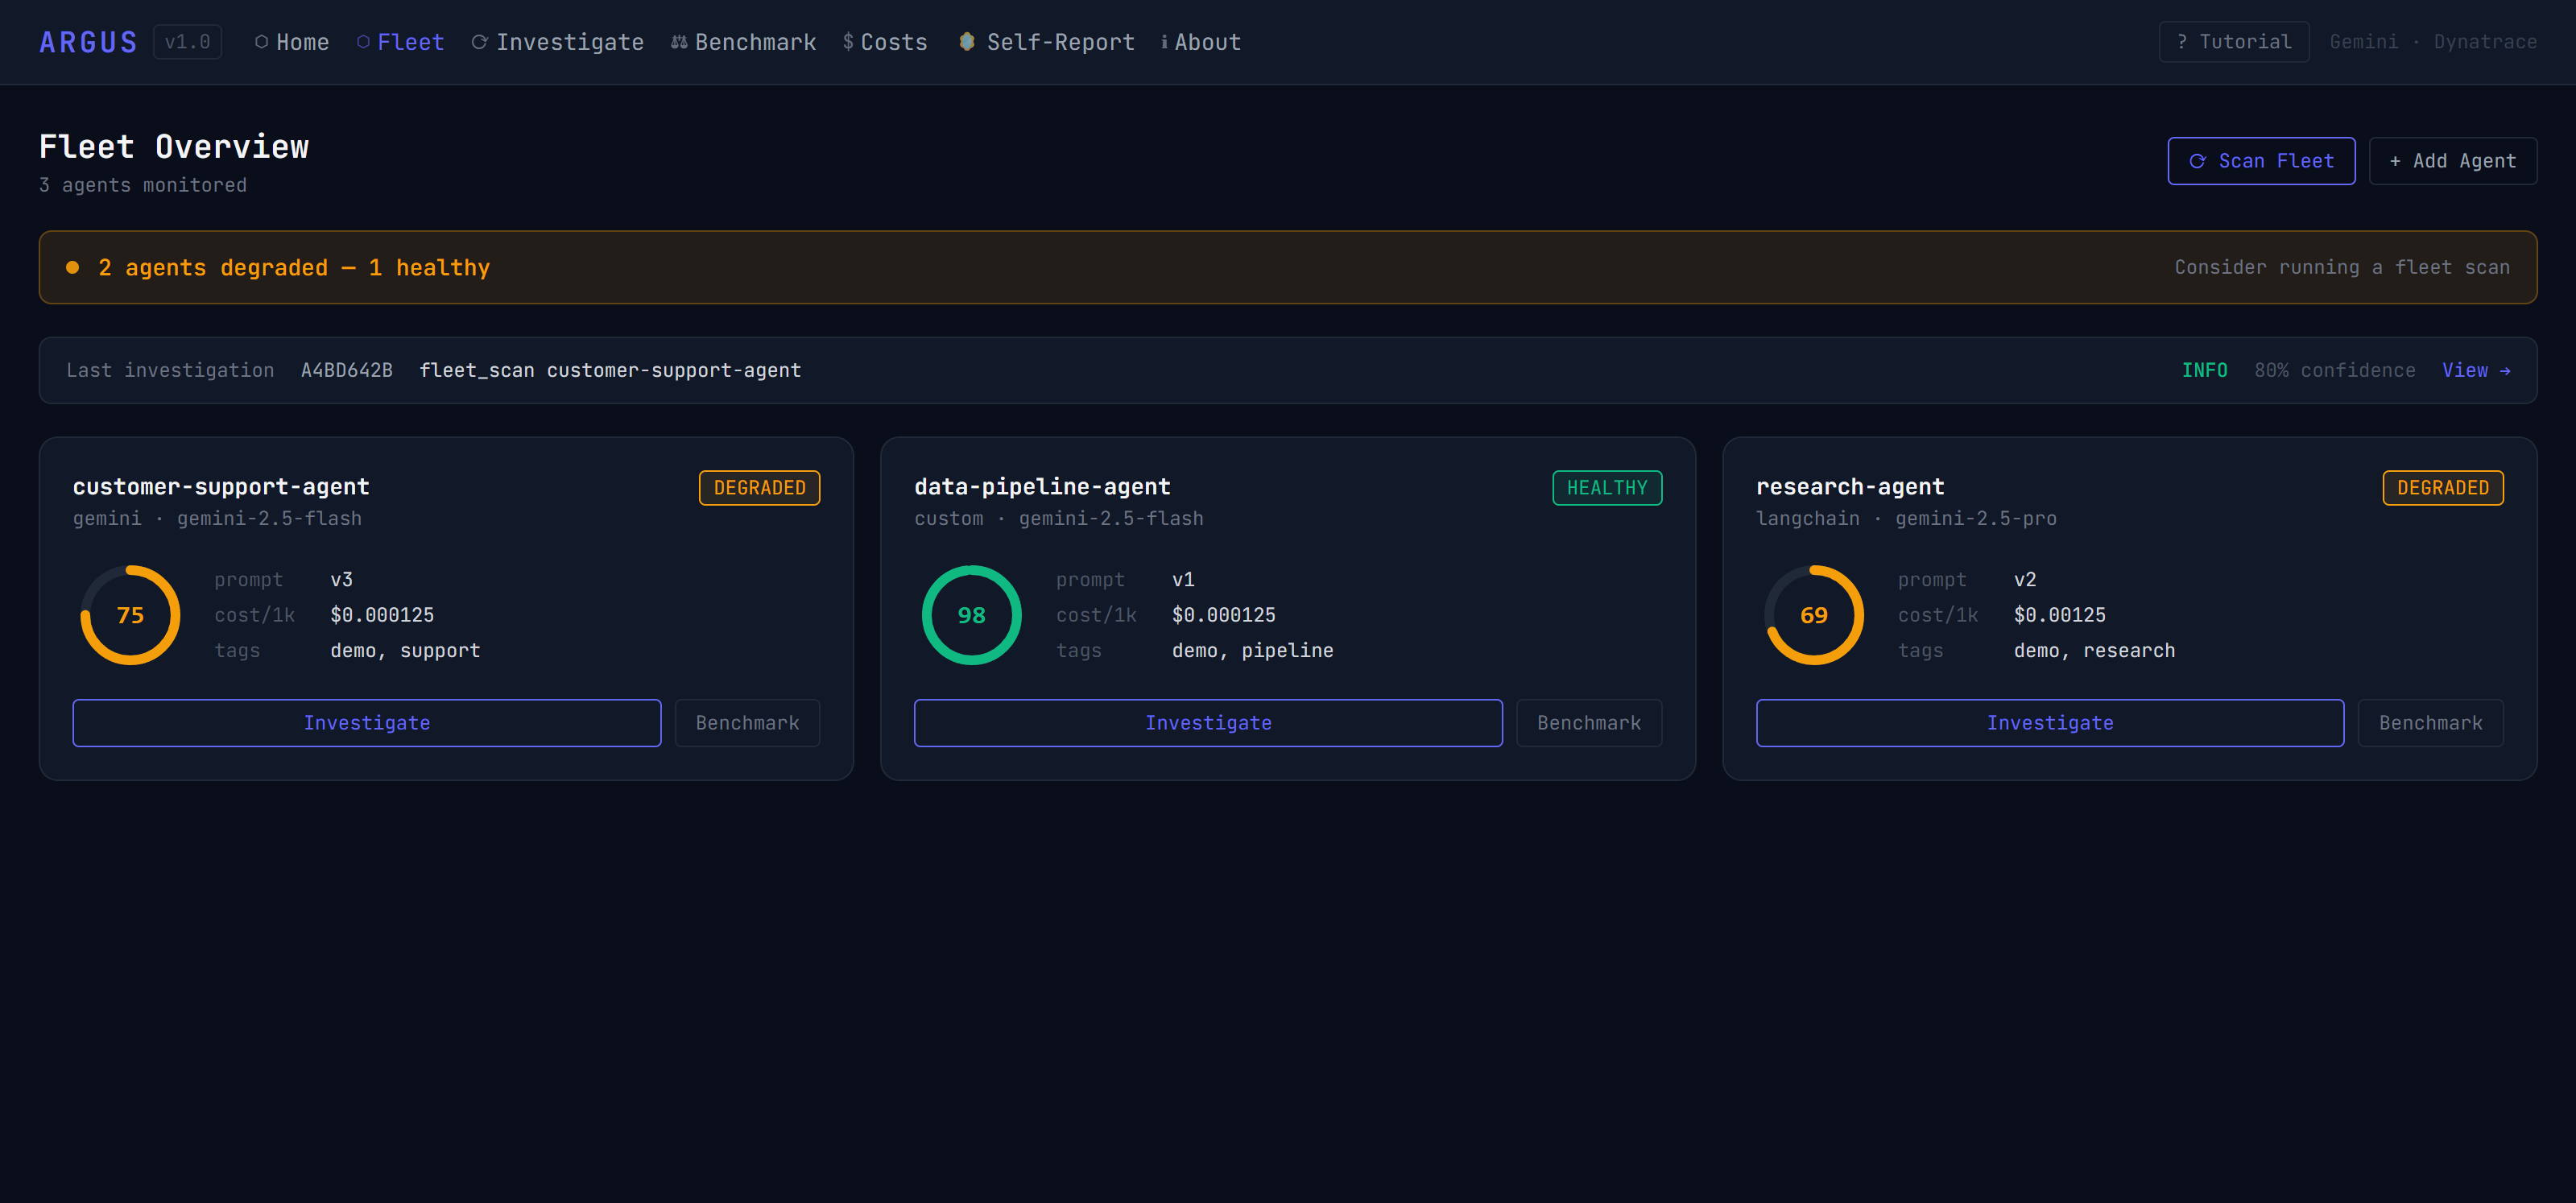
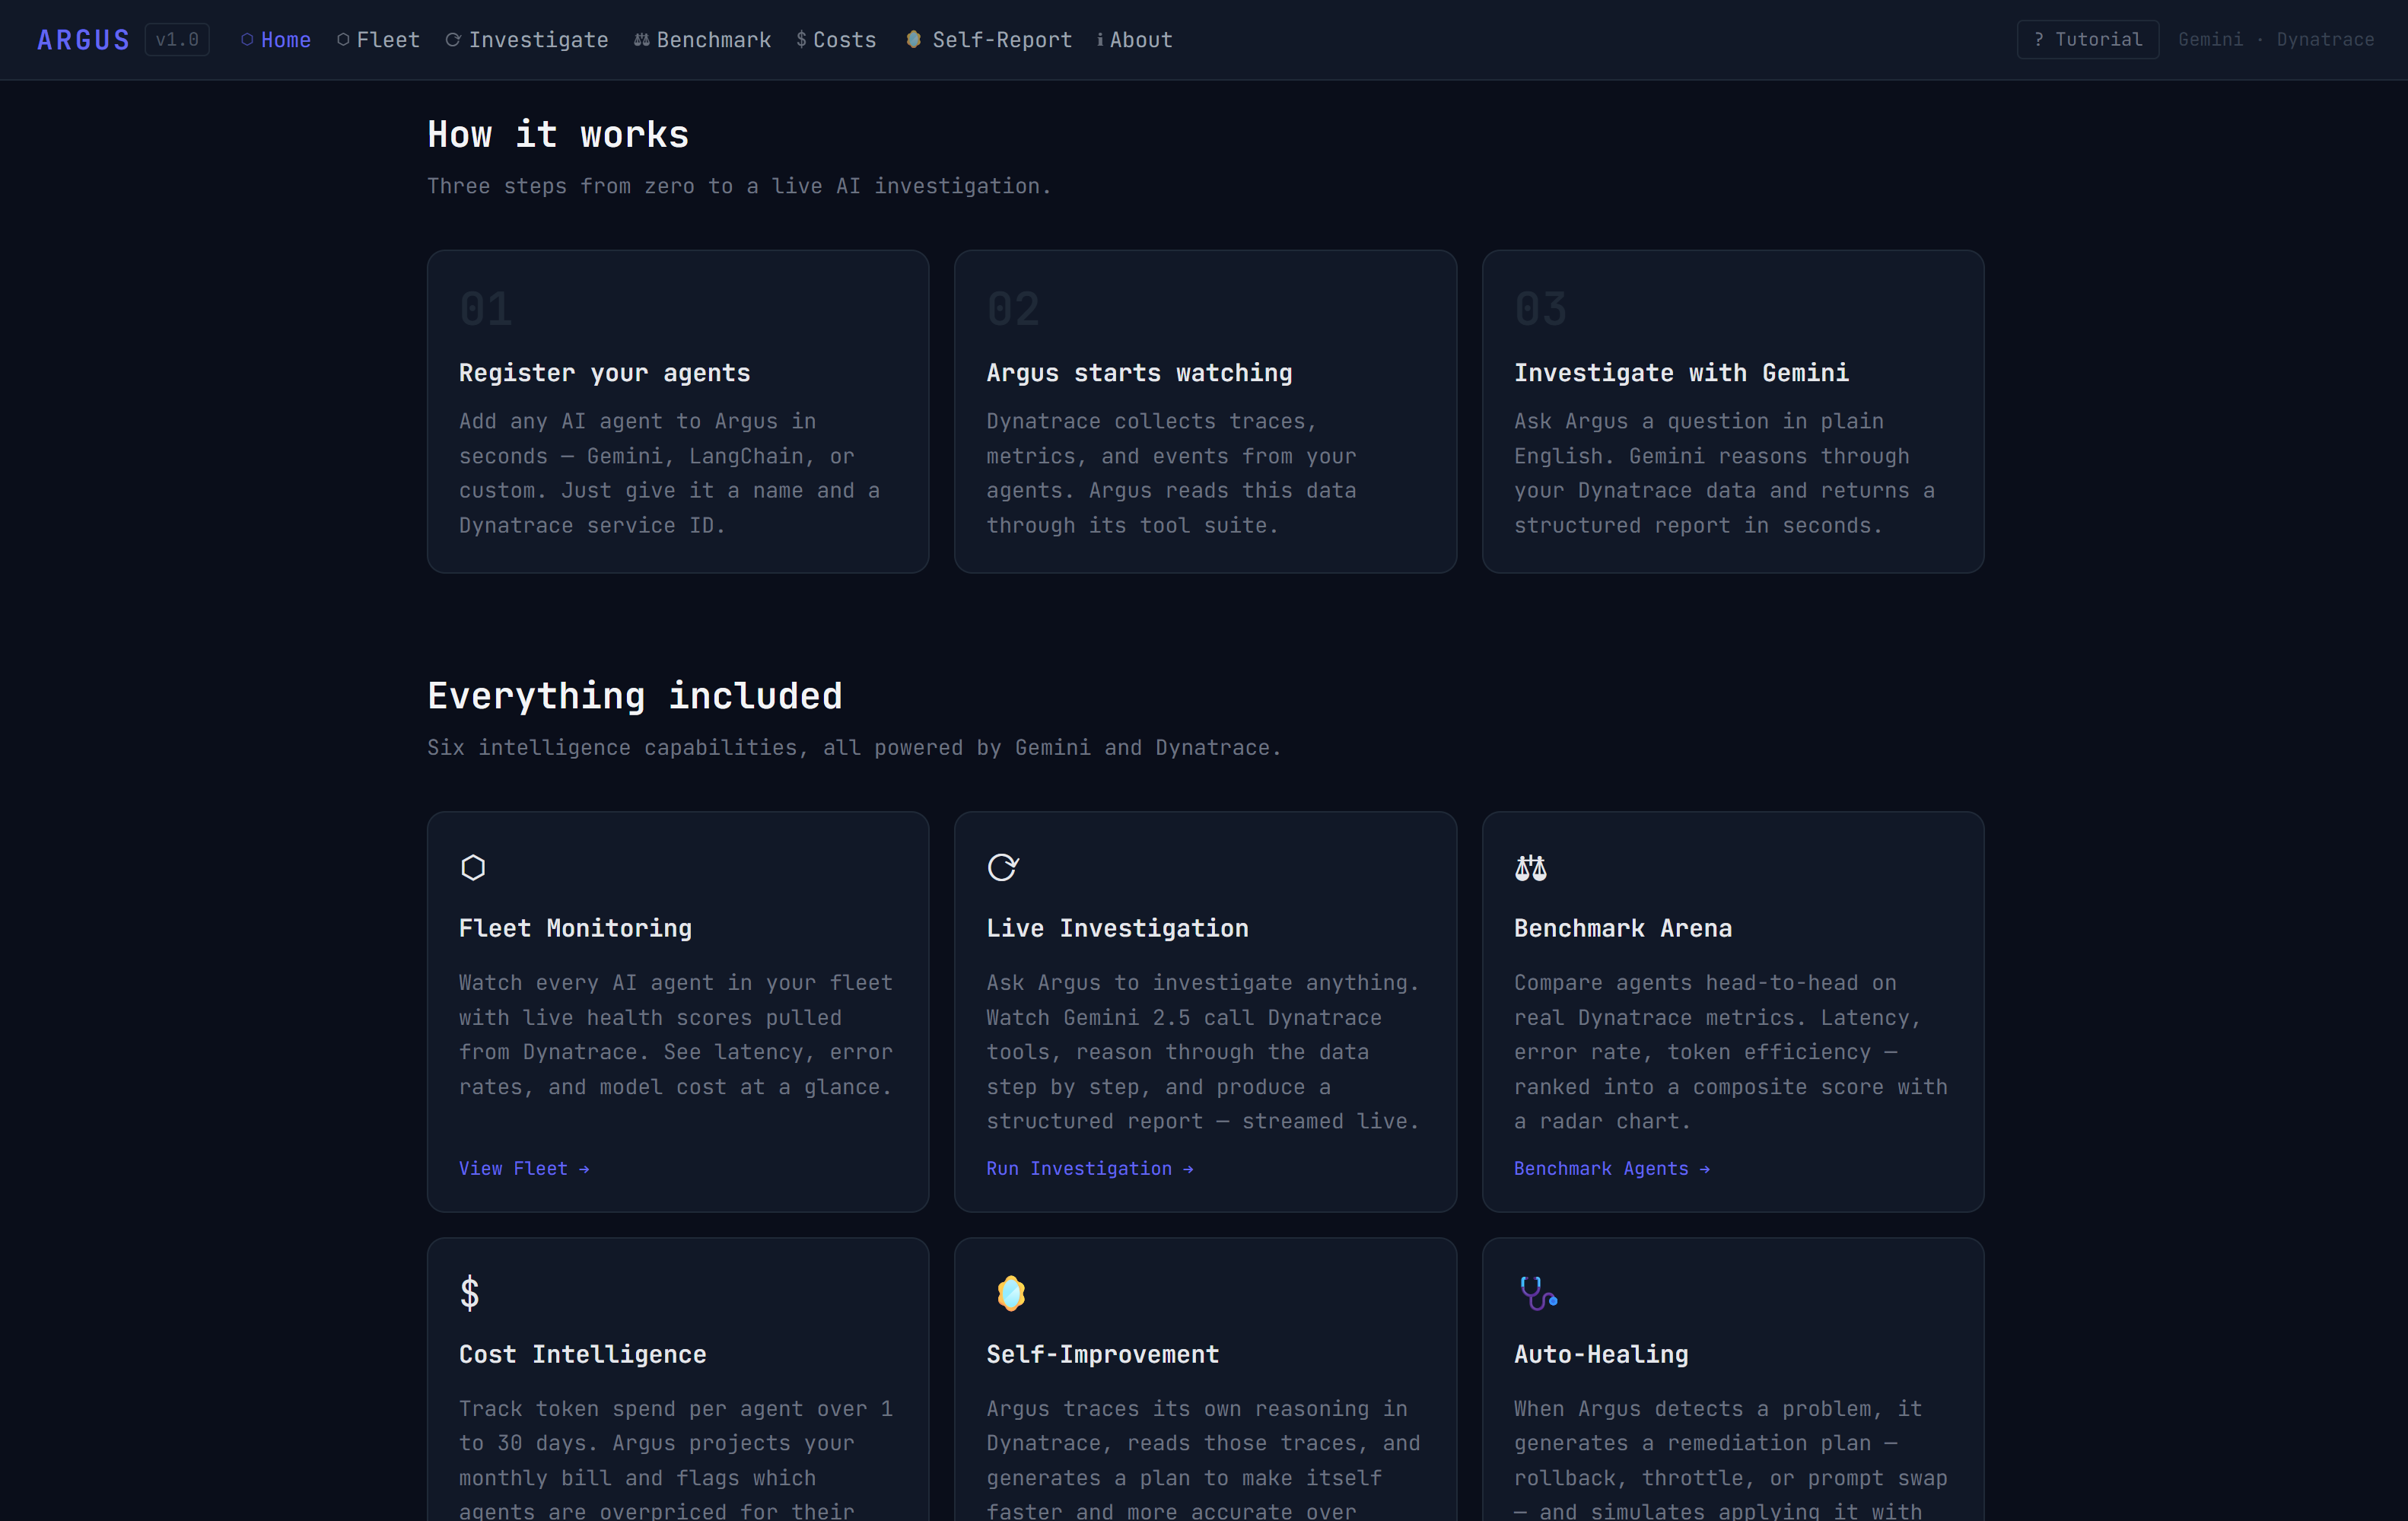
- Fleet Overview: live health scores for every monitored agent, pulled from Dynatrace
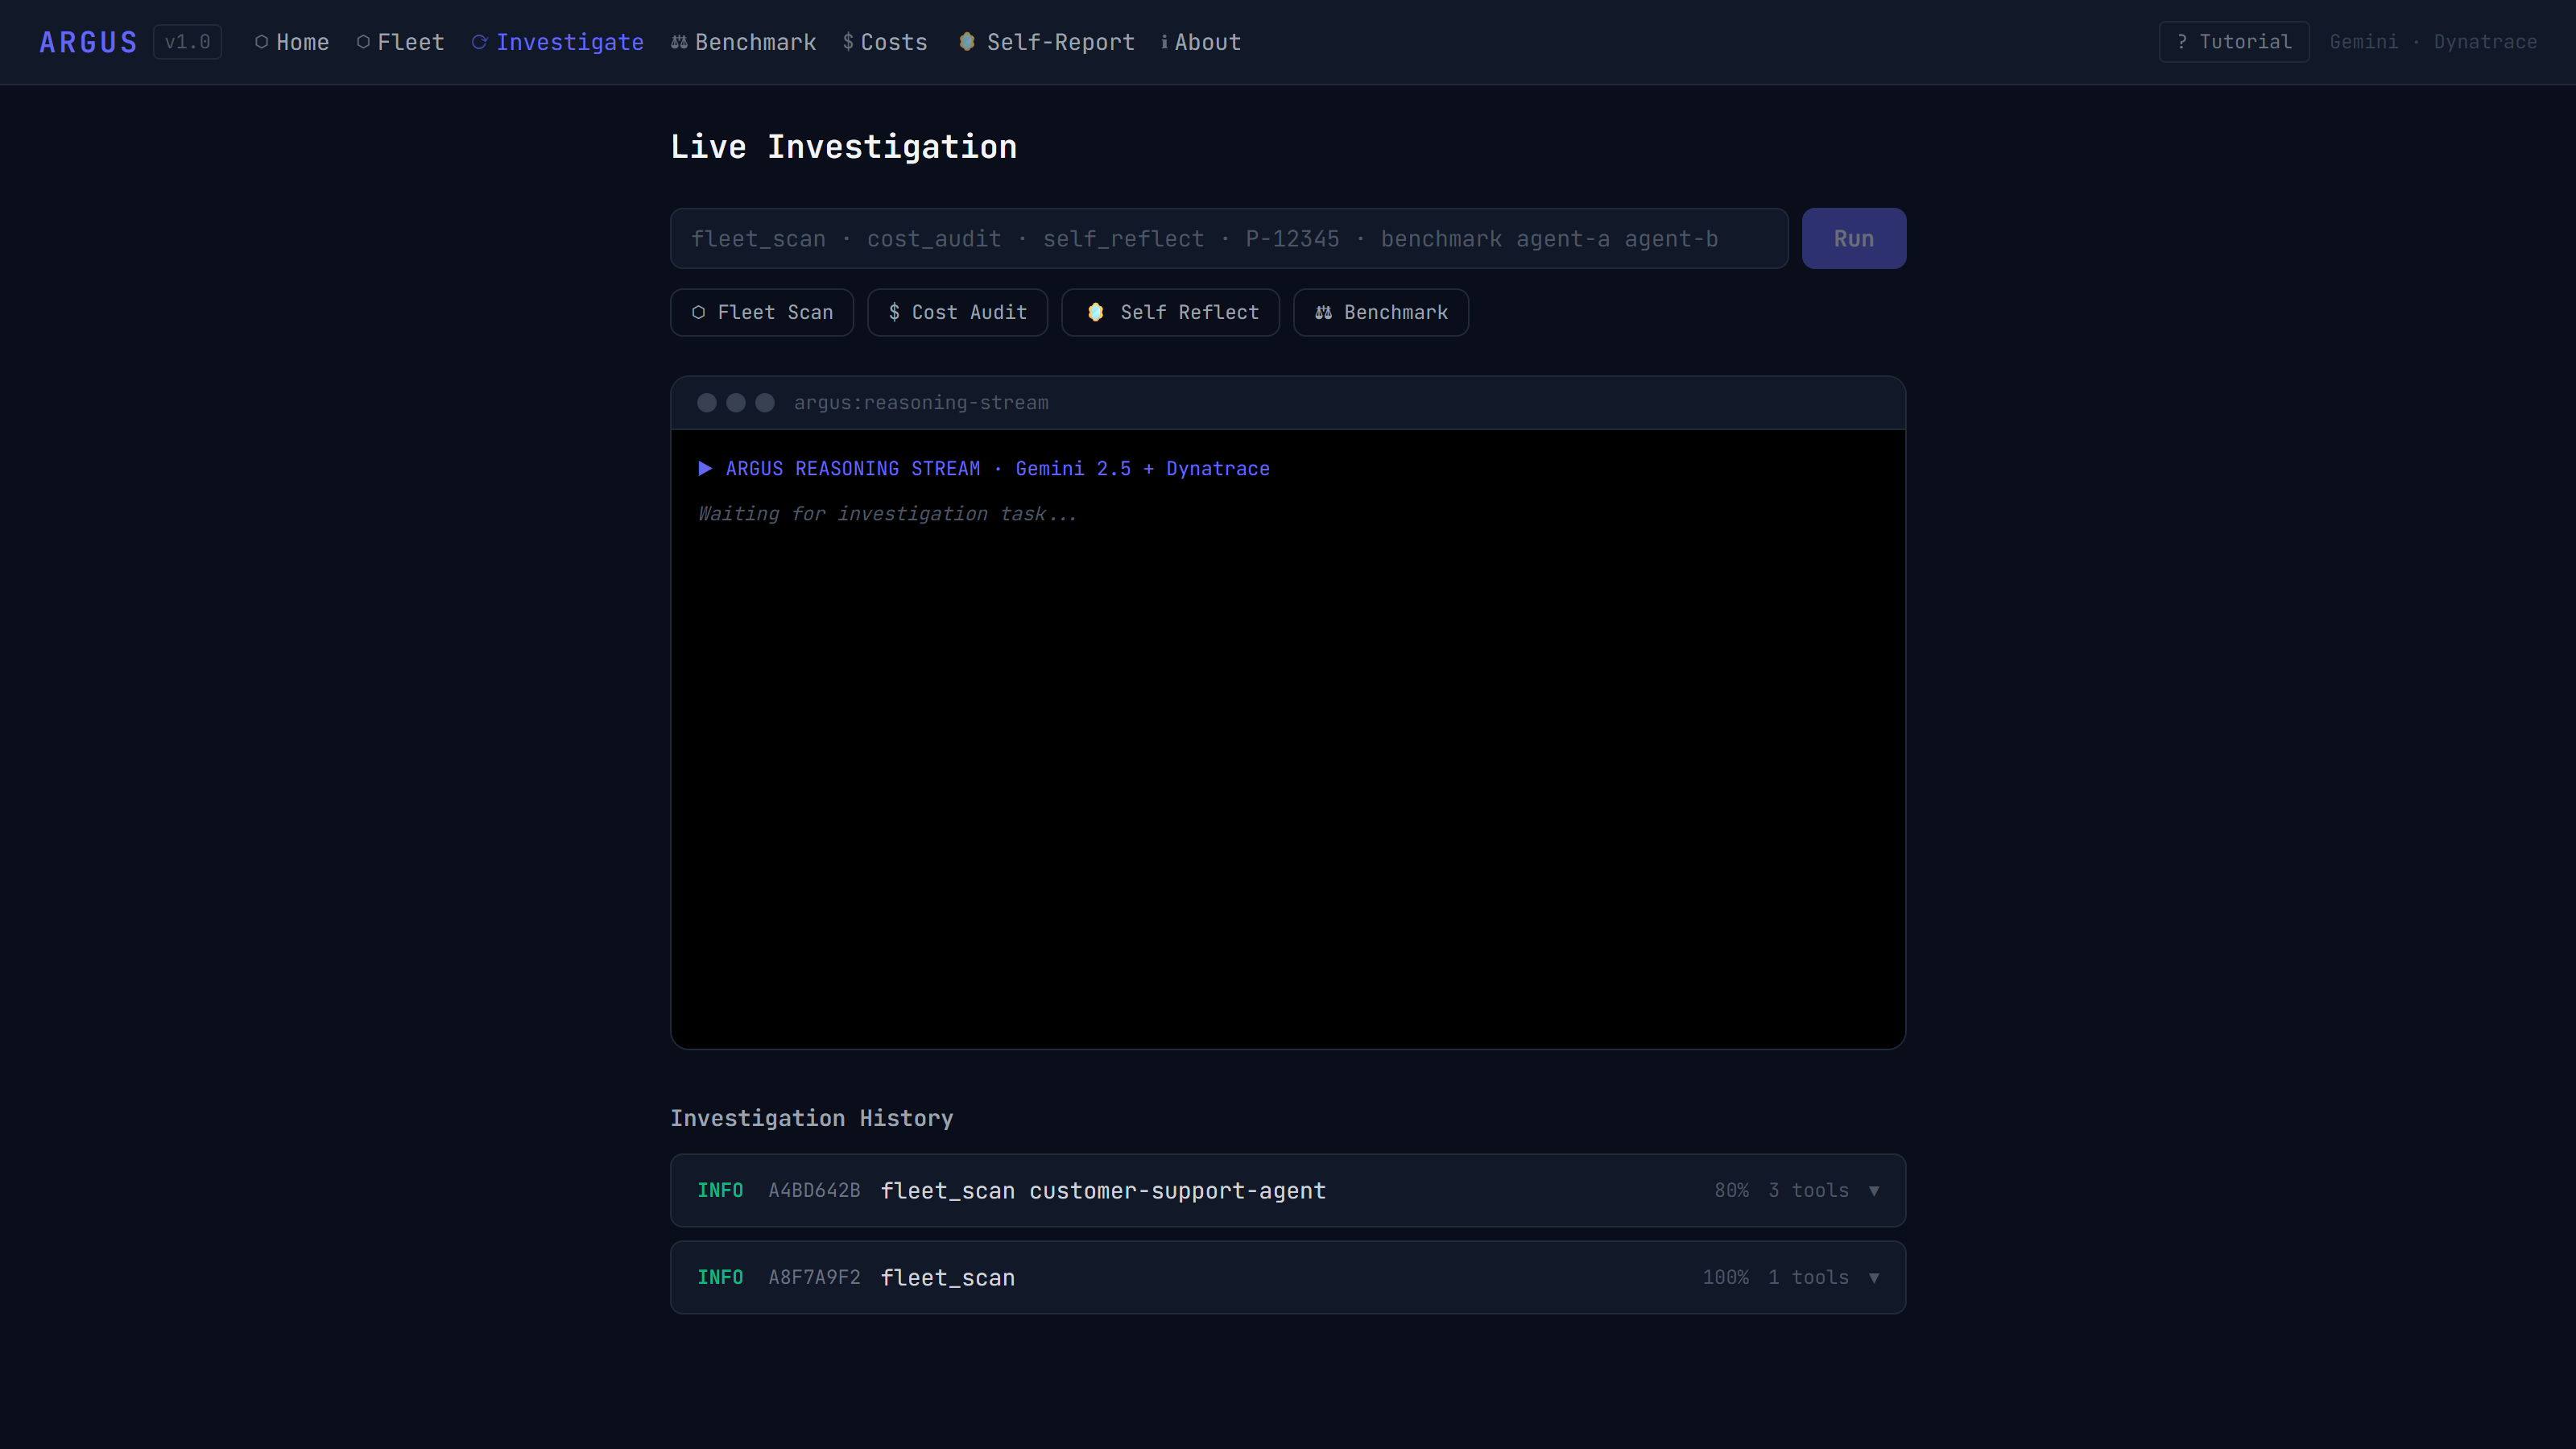
- Live Investigation: ask Argus a question in plain English, watch Gemini call Dynatrace tools and stream its reasoning step by step
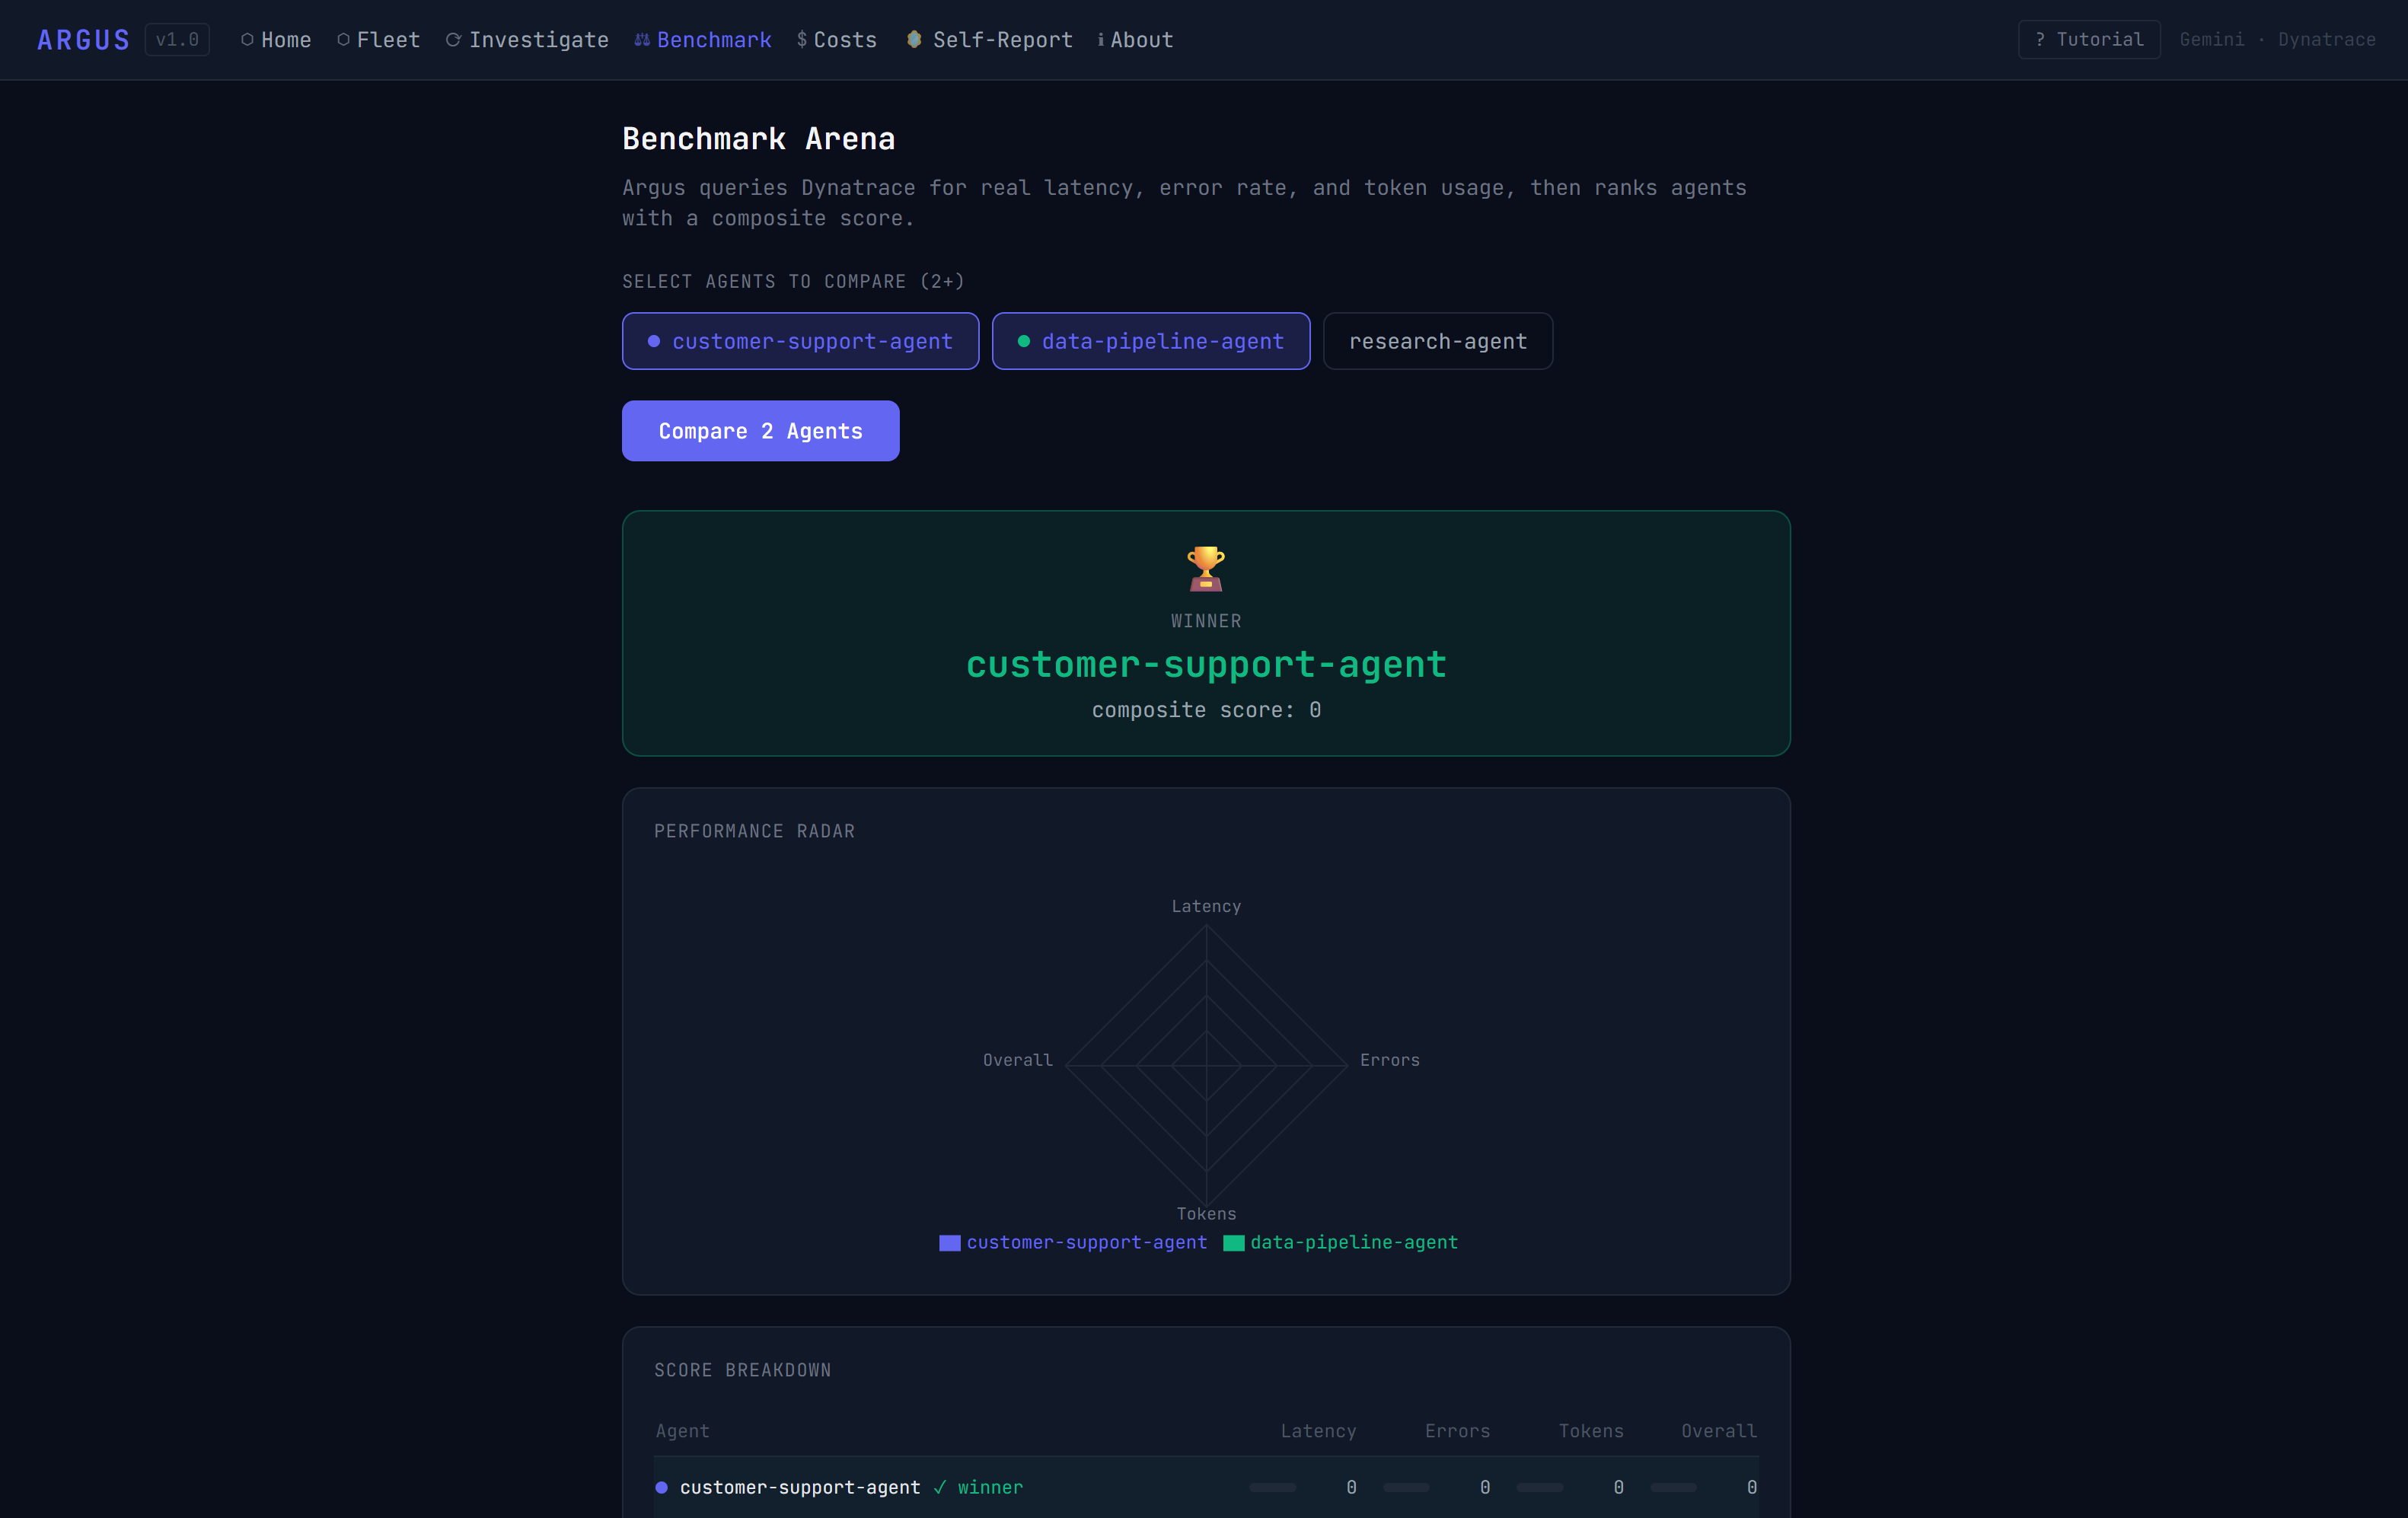
- Benchmark Arena: compare agents head-to-head on real latency, error rate, and token metrics with a composite score and radar chart
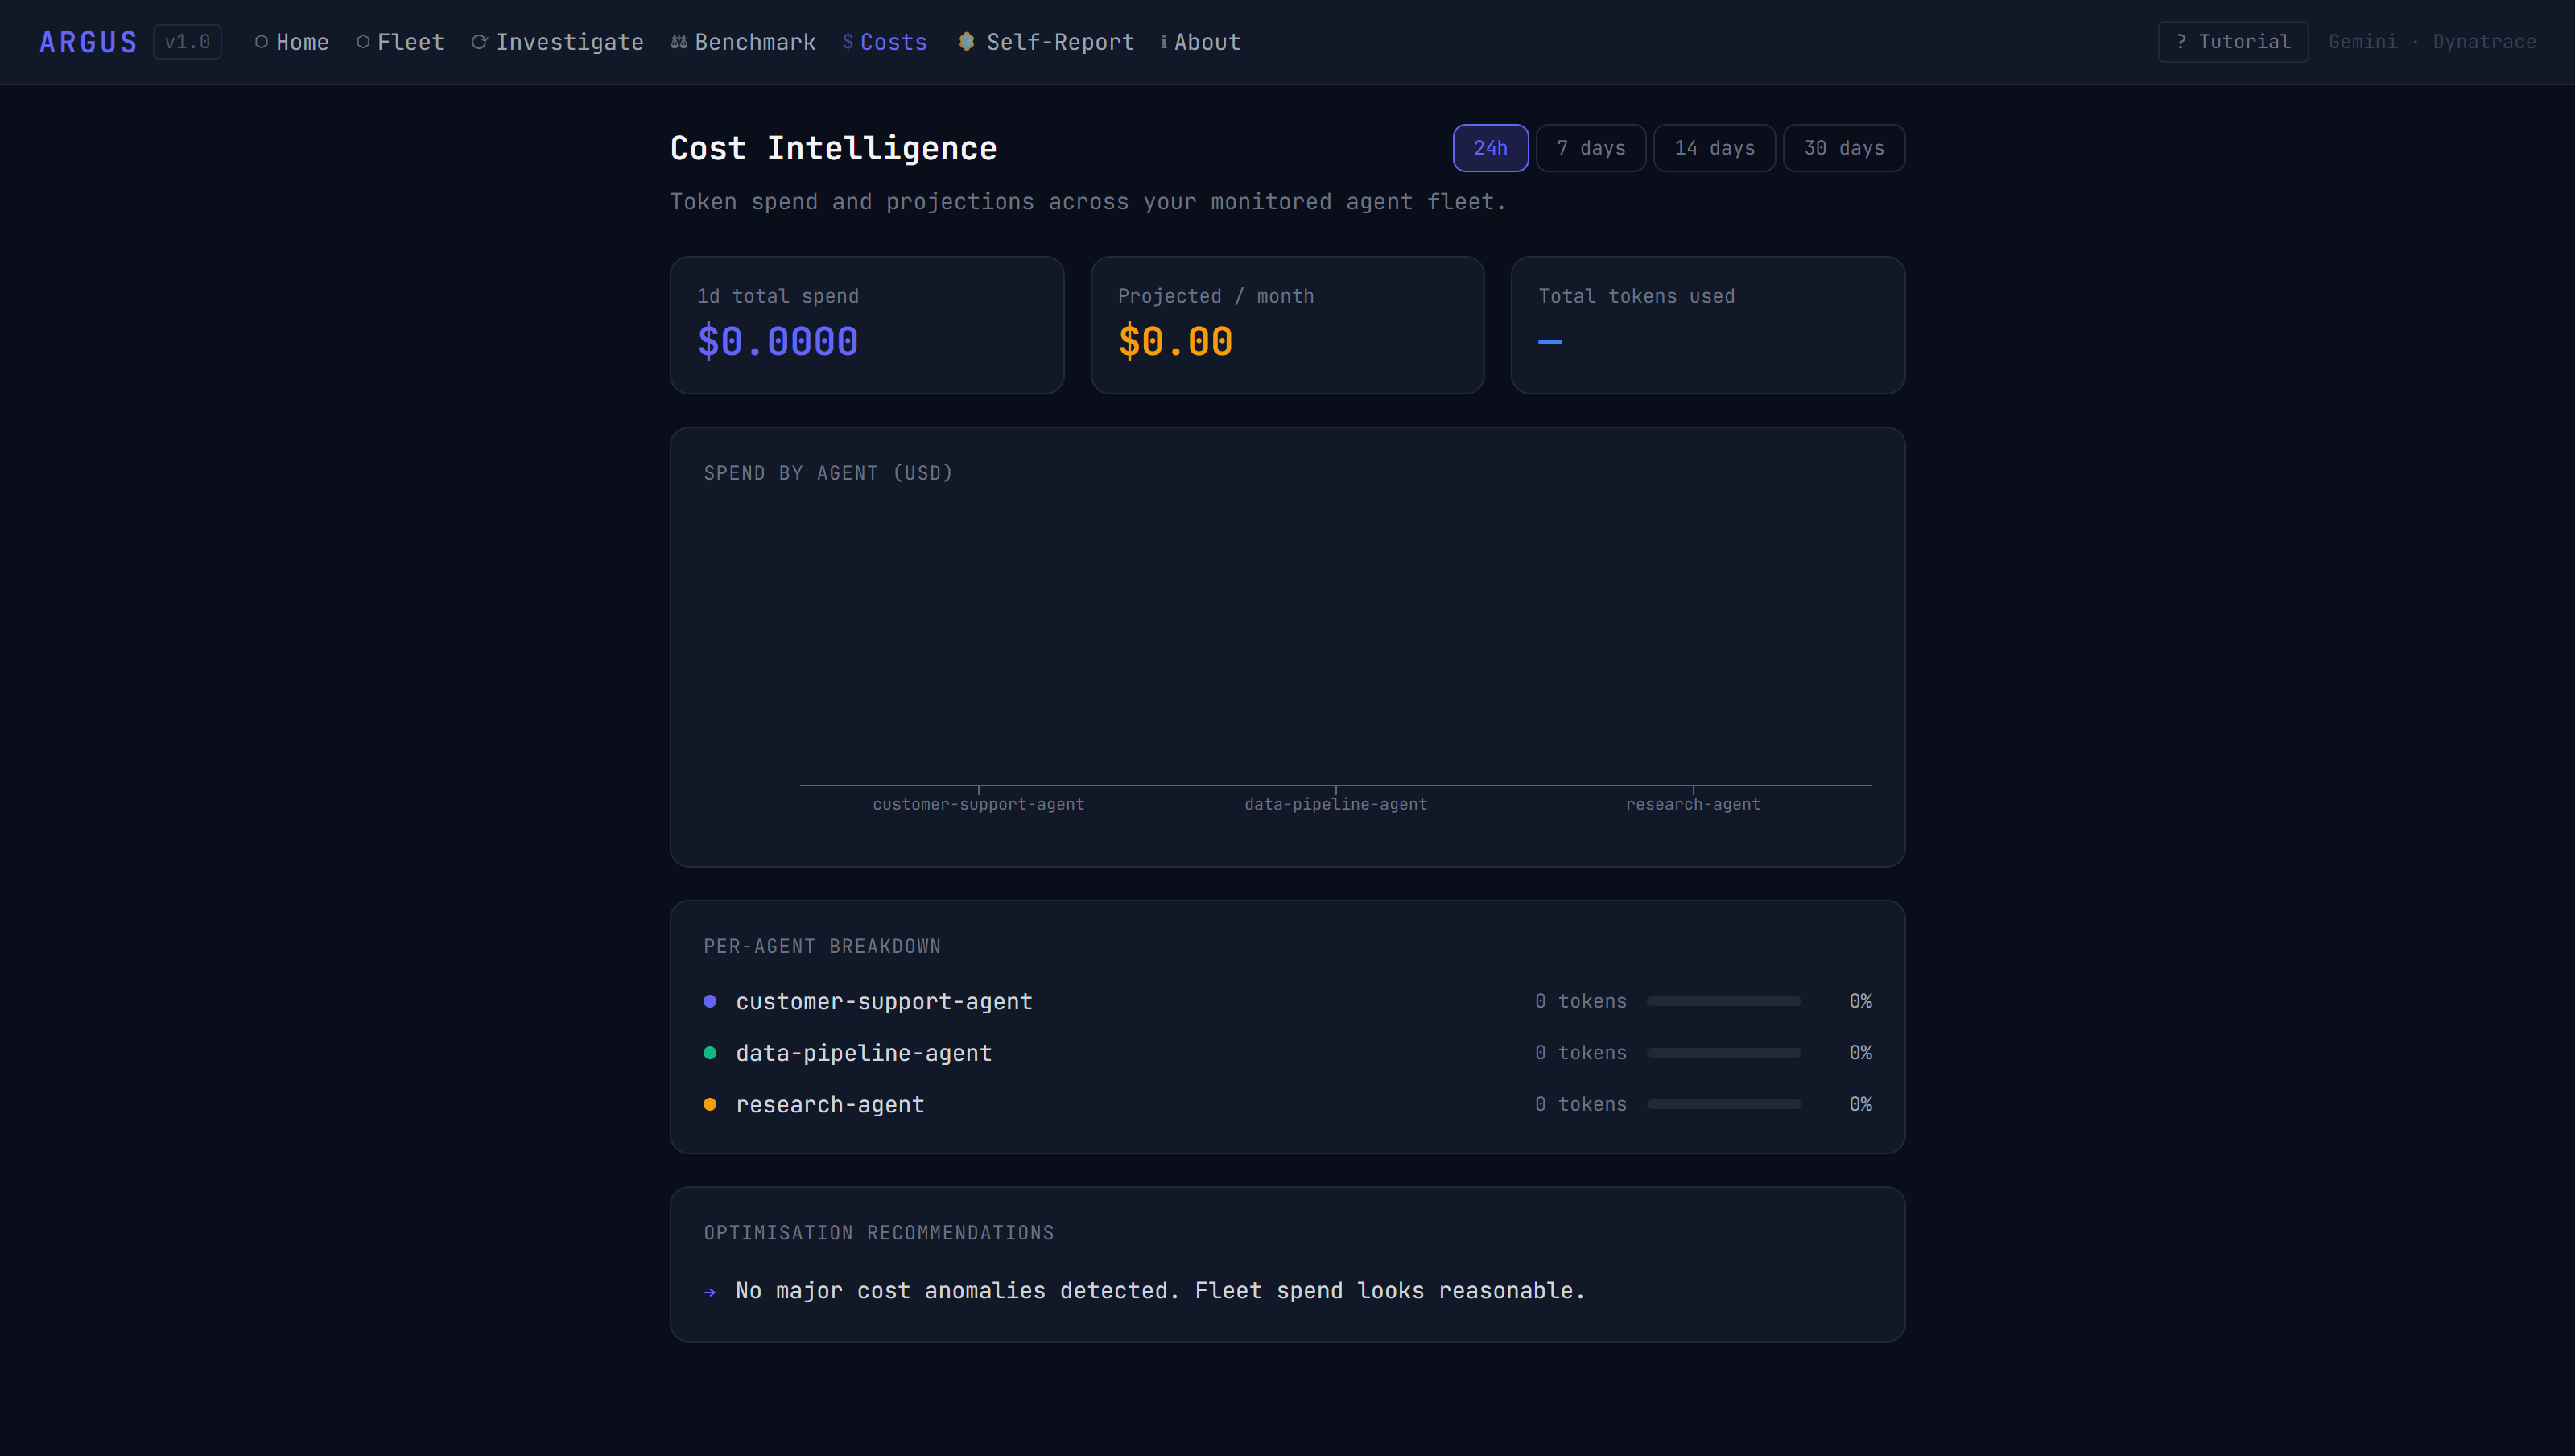
- Cost Intelligence: token spend per agent over 1 to 30 days, projected monthly cost, and optimisation recommendations
- Auto-Healing: when Argus detects a problem it generates a remediation plan (rollback, throttle, prompt swap) with full OTel traceability
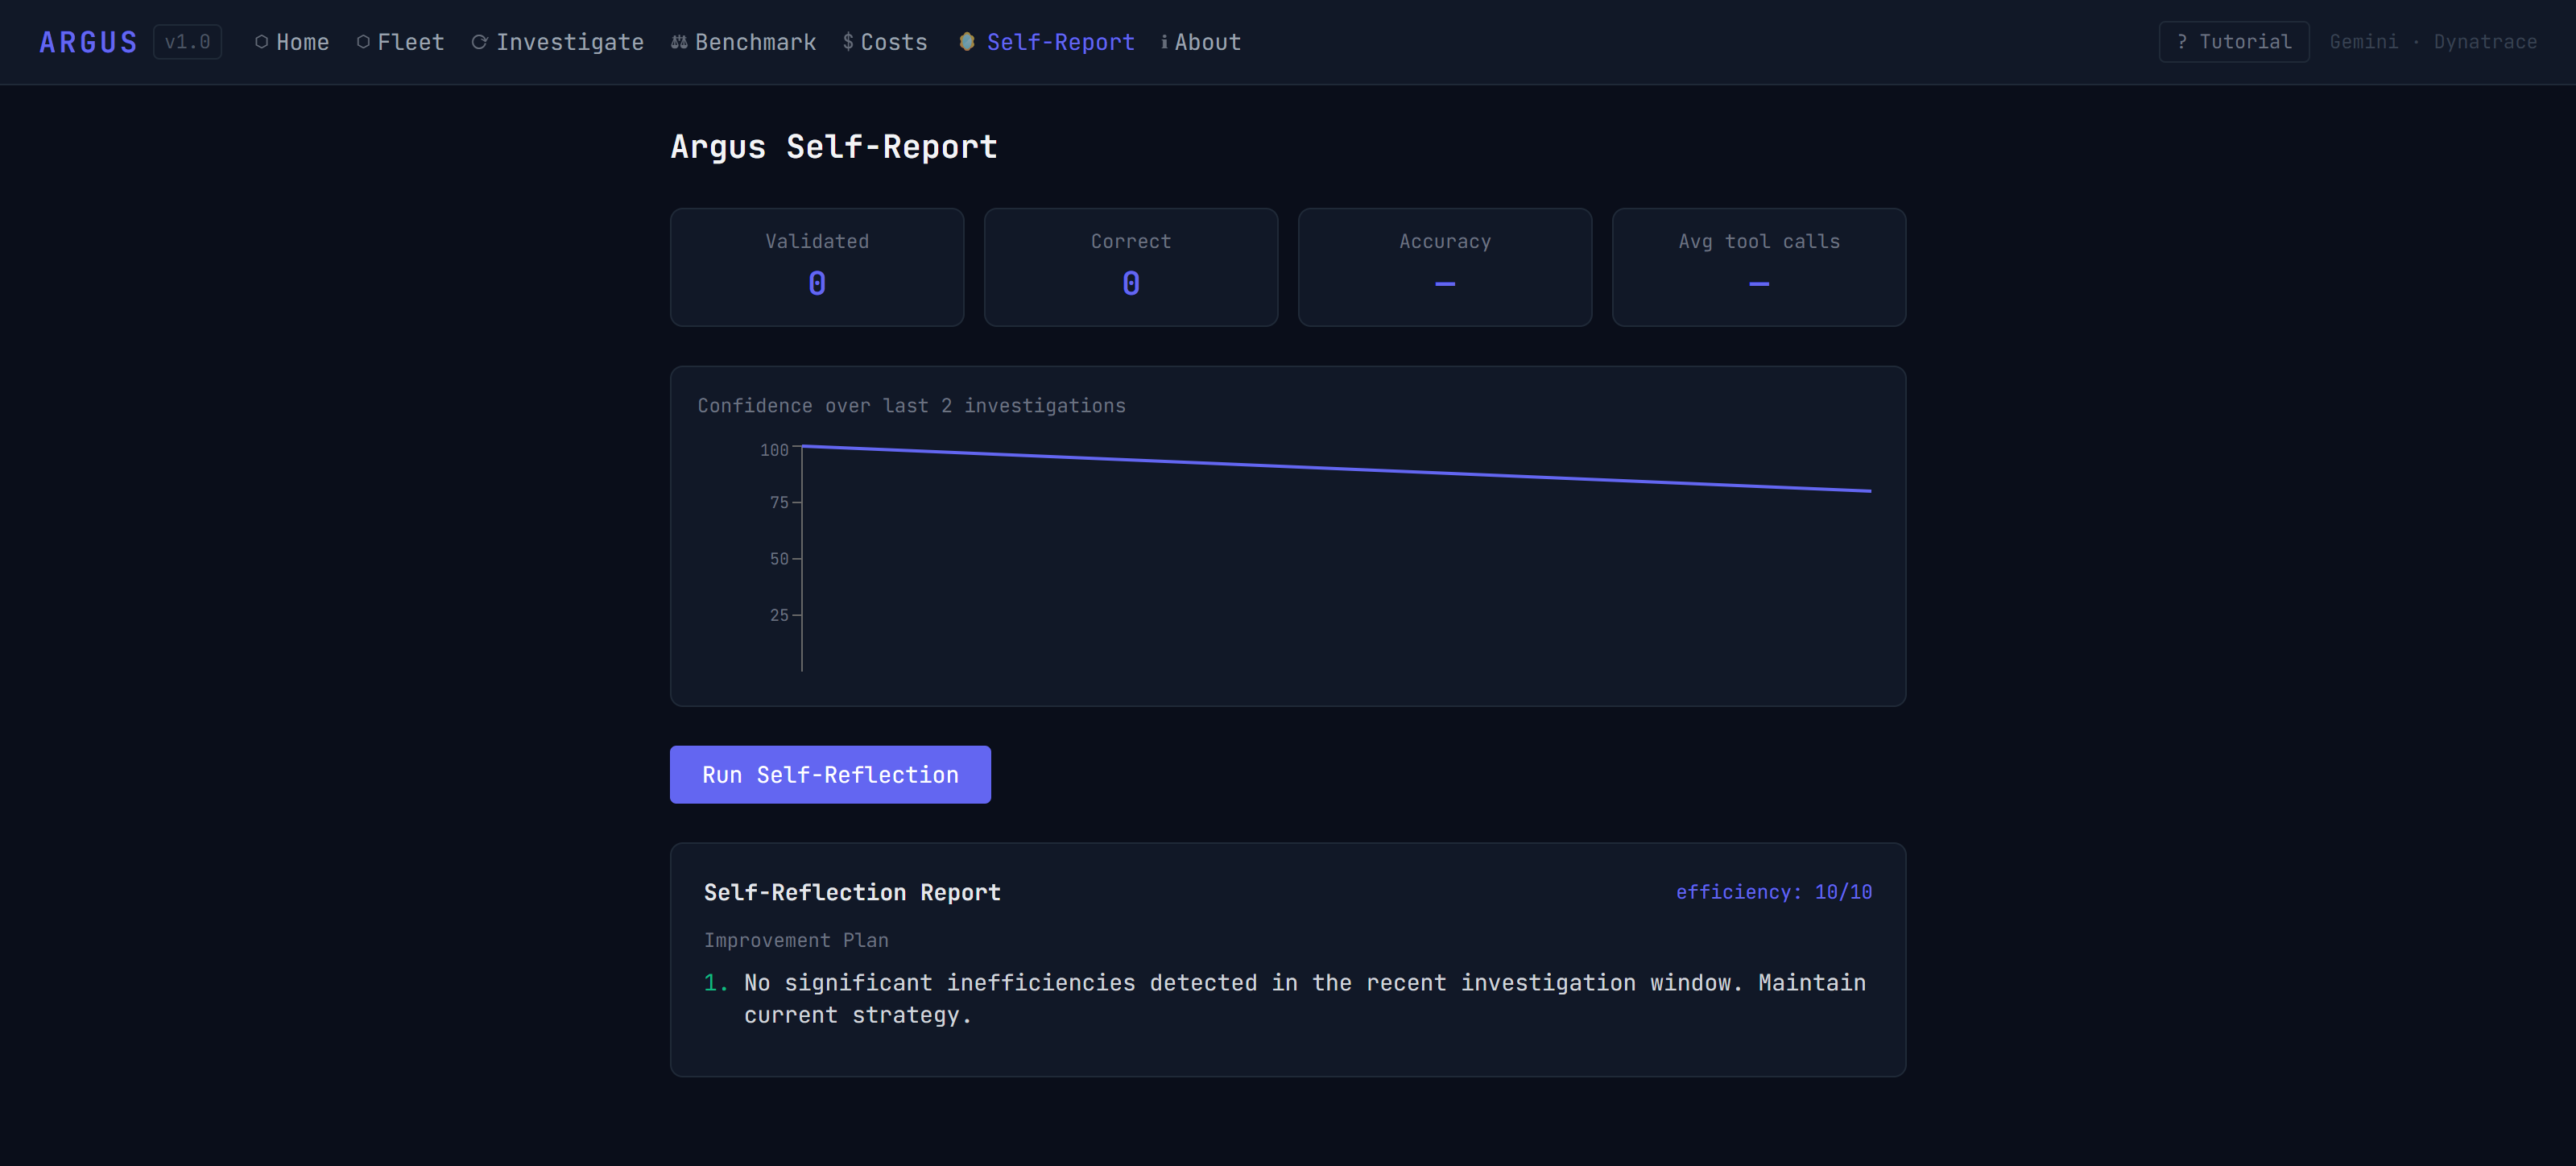
- Self-Improvement: Argus reads its own Dynatrace traces and uses Gemini to generate a concrete plan to make itself faster and more accurate
How we built it
Agentic loop: Gemini 2.5 Flash runs a function-calling loop with 8 typed Dynatrace tool declarations. It decides which tools to call, in what order, based on what it finds. No hardcoded logic. The loop streams reasoning steps to the frontend via Server-Sent Events so you can watch the AI think in real time.
Self-instrumentation: Every investigation Argus runs is wrapped in an OpenTelemetry span exported to Dynatrace. Each tool call is a child span with attributes for tool name, arguments, and latency. The Self-Improver engine then calls get_argus_own_traces to fetch these spans from Dynatrace and pass them back to Gemini, creating a fully recursive observability loop.
Dynatrace integration: 8 async tool functions cover the full Dynatrace REST API v2 surface: active problems, root cause analysis, metrics time series, distributed traces, deployment events, entity health, and Argus's own traces.
Frontend: React + Vite + Tailwind CSS dark dashboard with 7 pages including a landing page, live terminal-style reasoning stream, radar benchmark chart, and an interactive tutorial that auto-launches on first visit.
Challenges
- Getting the Gemini function-calling loop to handle multi-step Dynatrace investigations without hallucinating tool arguments took careful prompt engineering and graceful error returns. All tools return
{"error": ...}dicts instead of raising, so Gemini can reason about failures. - Self-referential OTel export: Argus can't read its own traces until they're flushed to Dynatrace, so we designed the self-reflect flow to work on completed past investigations rather than the current one.
- Streaming SSE from FastAPI through a Vite proxy to React while keeping the agentic loop async required careful generator design.
What we learned
Gemini's function-calling is remarkably good at chaining Dynatrace API calls intelligently. It naturally discovers the right sequence of tool calls (query problems, get root cause, check traces) without being told. The self-improvement loop is genuinely useful: Argus identified that it was calling query_agent_metrics redundantly and recommended adding result caching.
What's next
- Real-time alerting via Dynatrace webhook triggering Argus investigations automatically
- Multi-agent comparison across prompt versions
- Deploy to Cloud Run for a fully hosted version


Log in or sign up for Devpost to join the conversation.