-
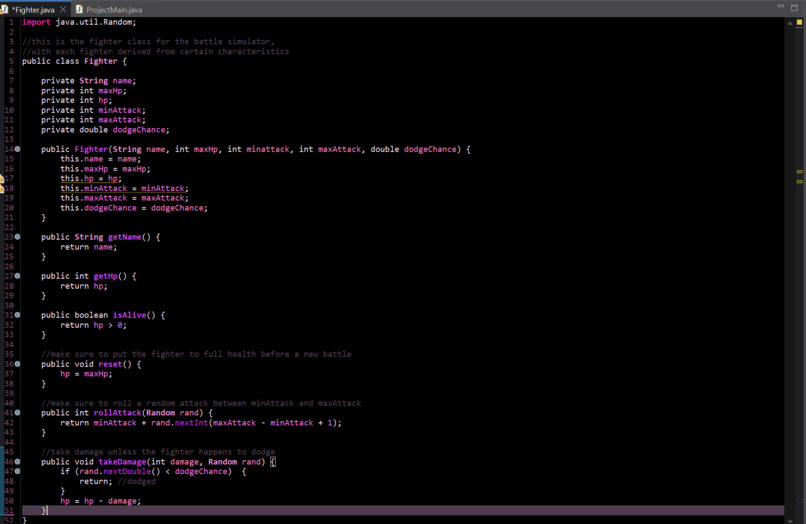
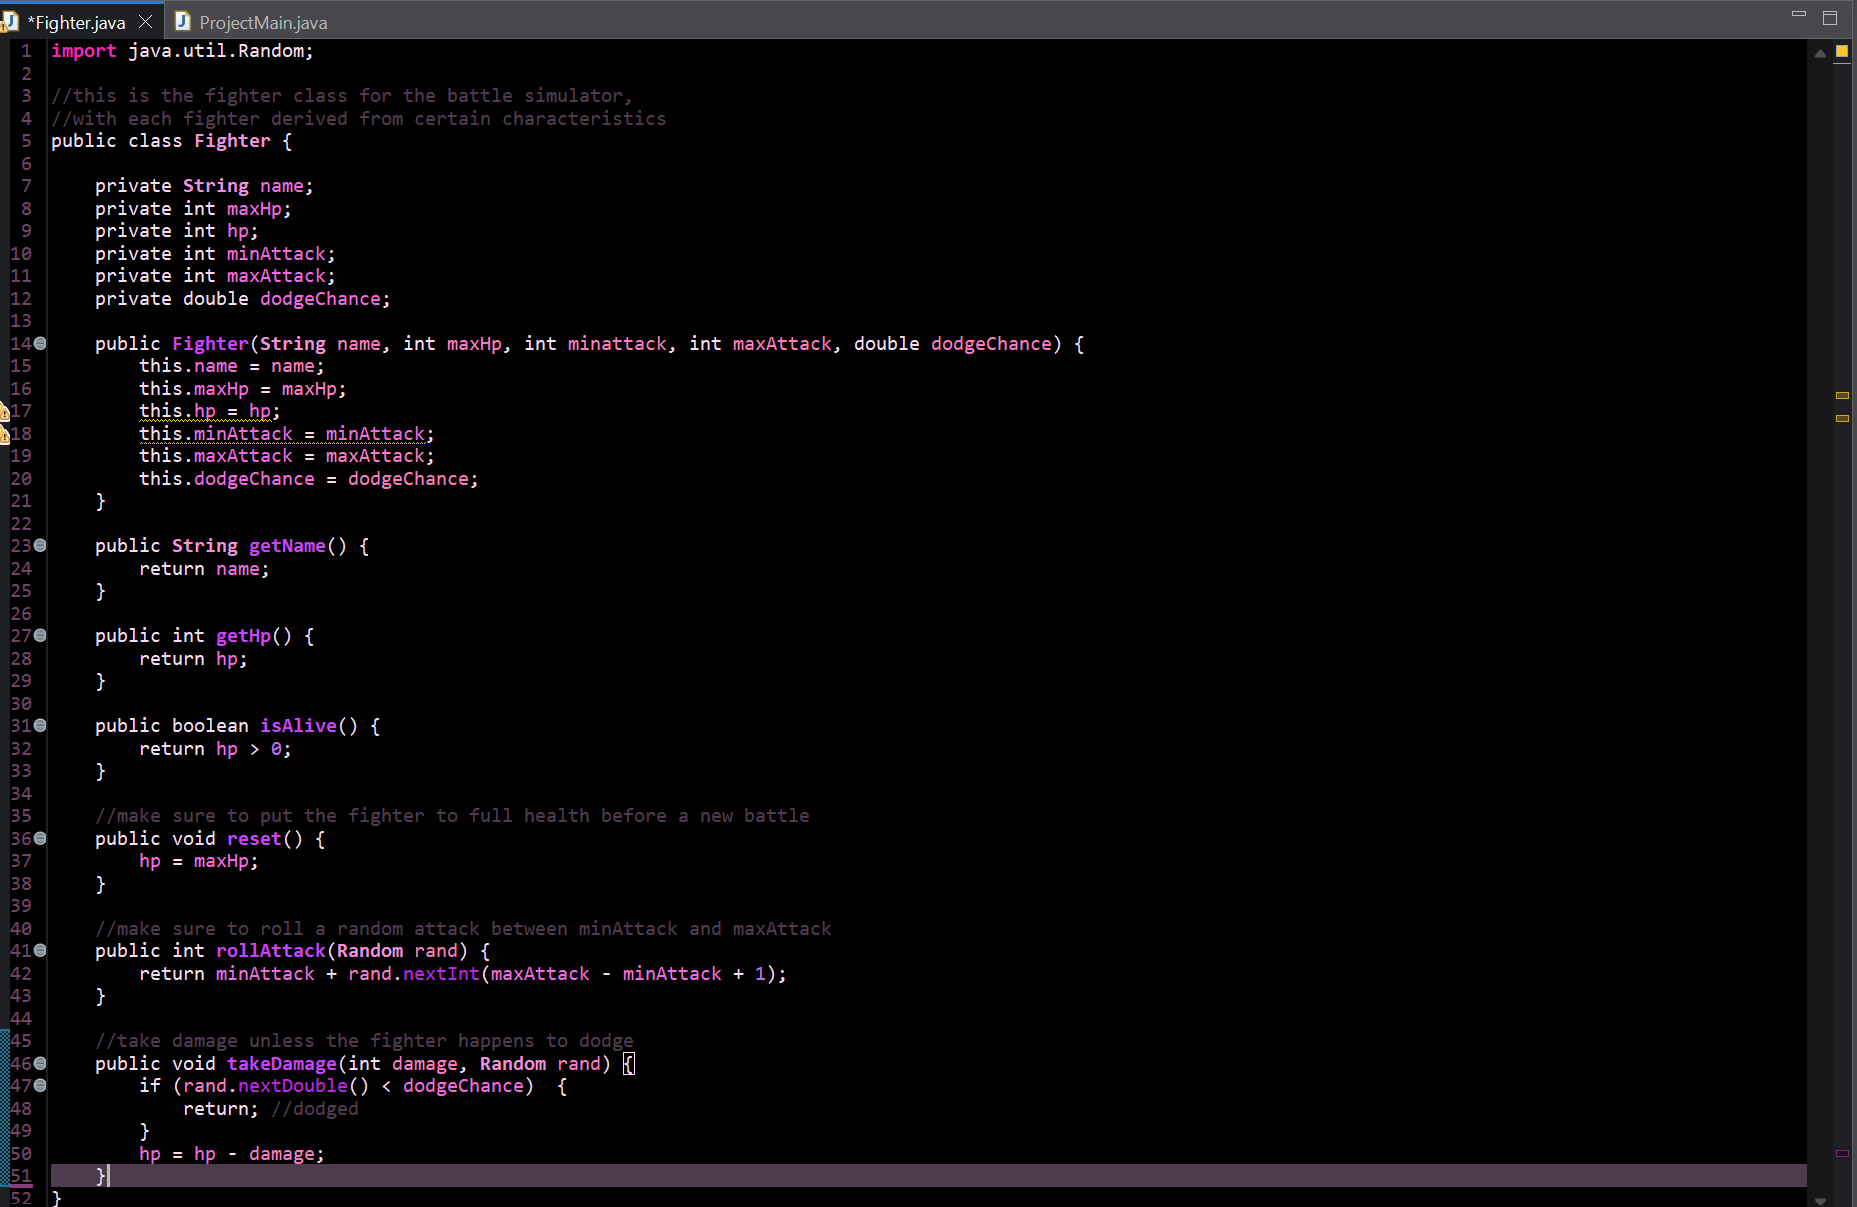
Java Fighter Class
-
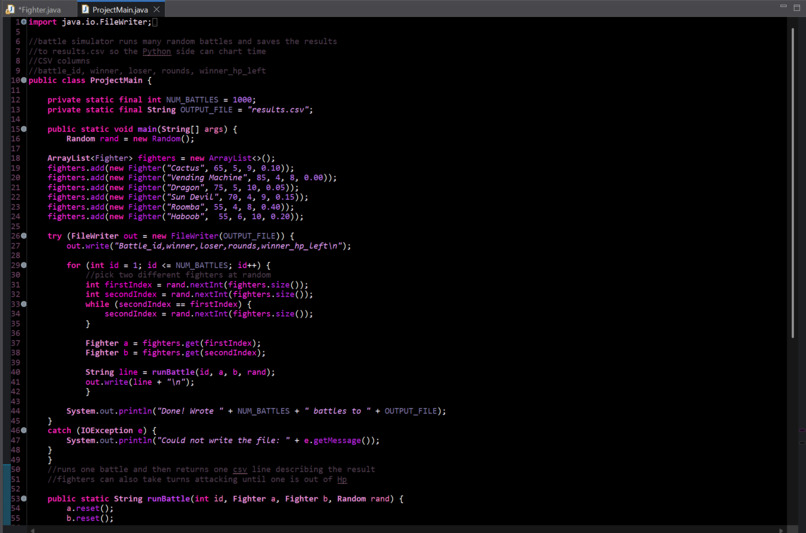
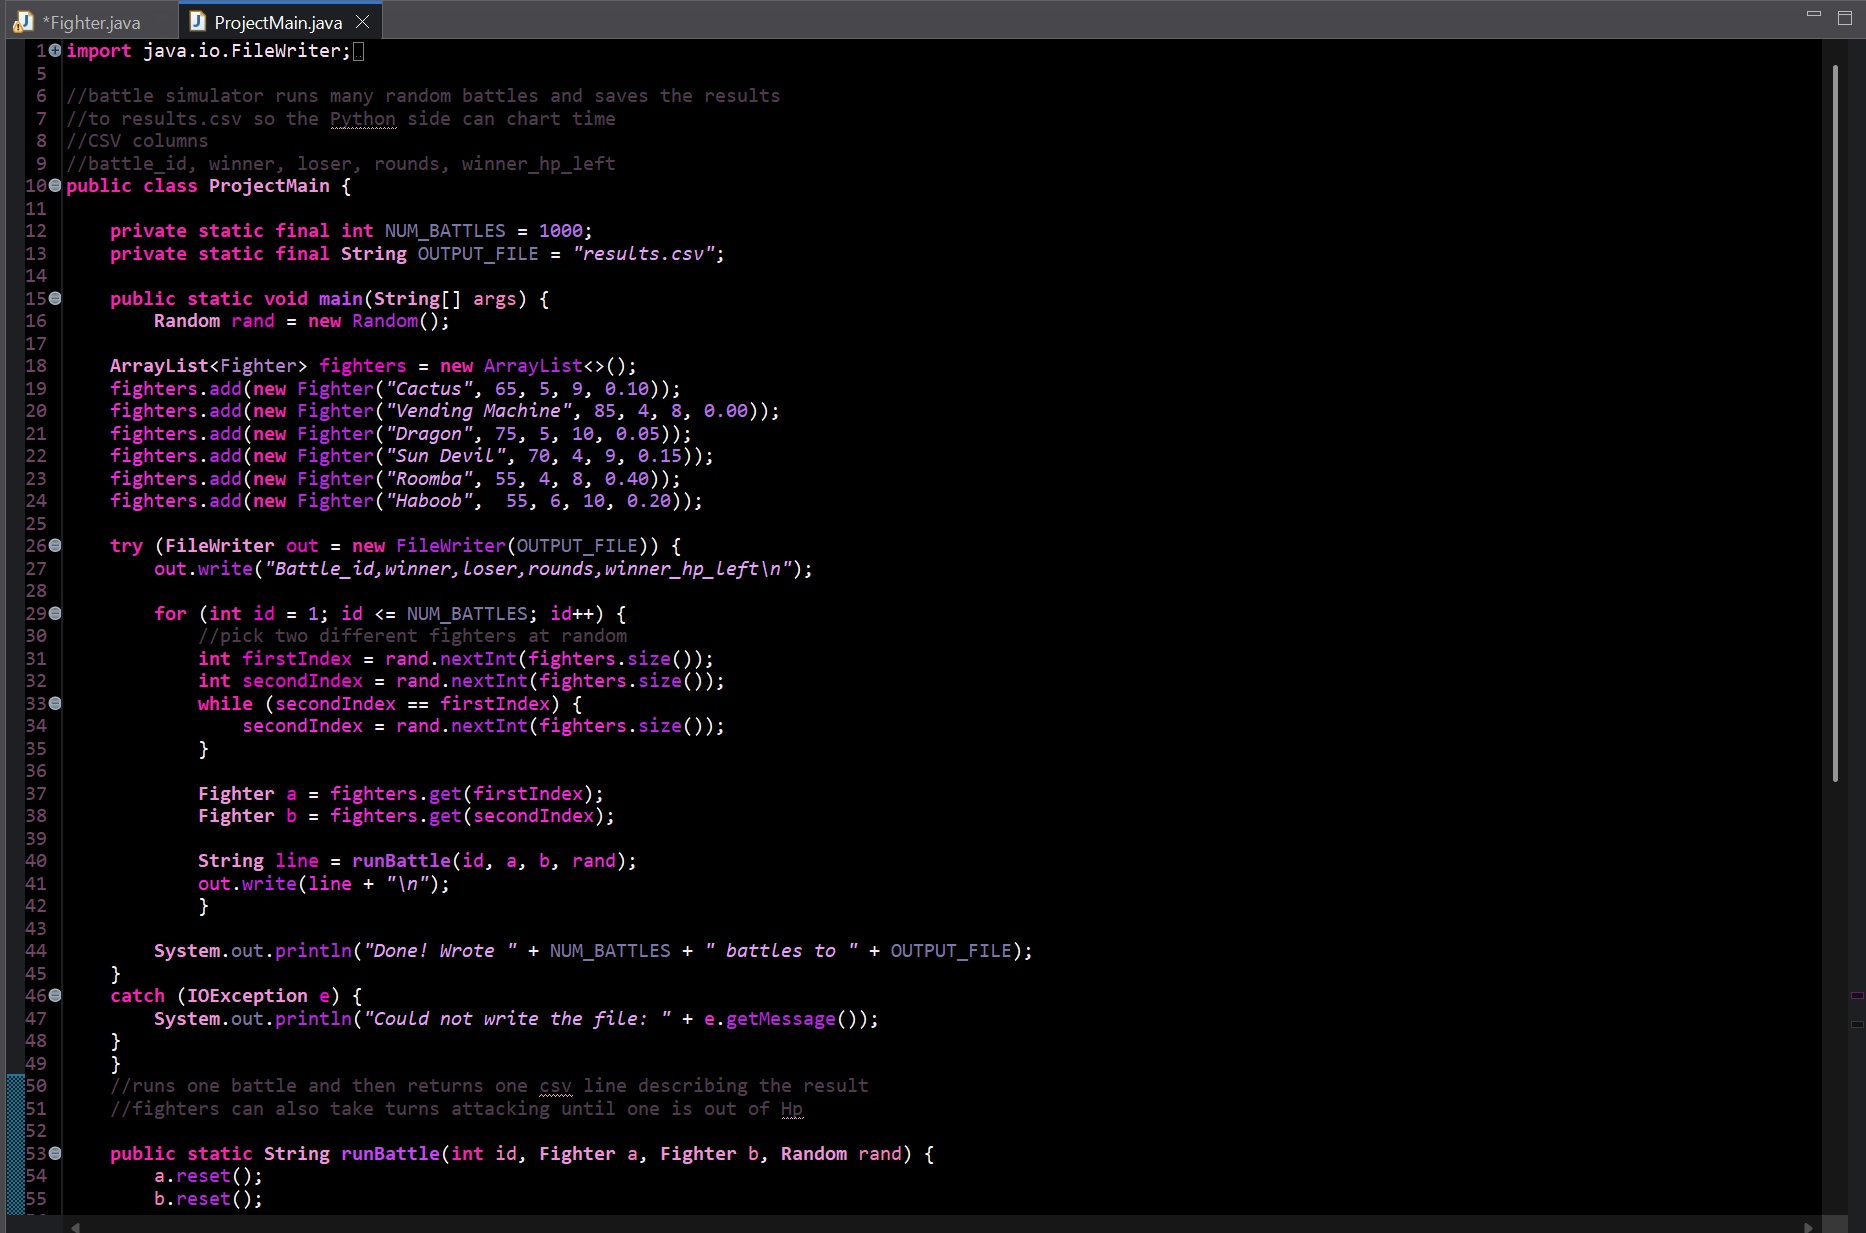
Java ProjectMain (pt.1)
-
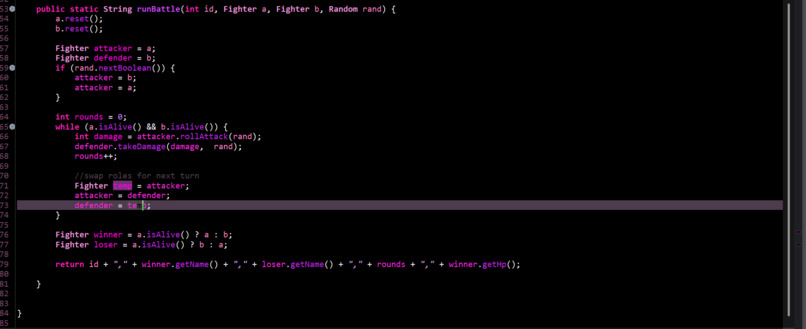
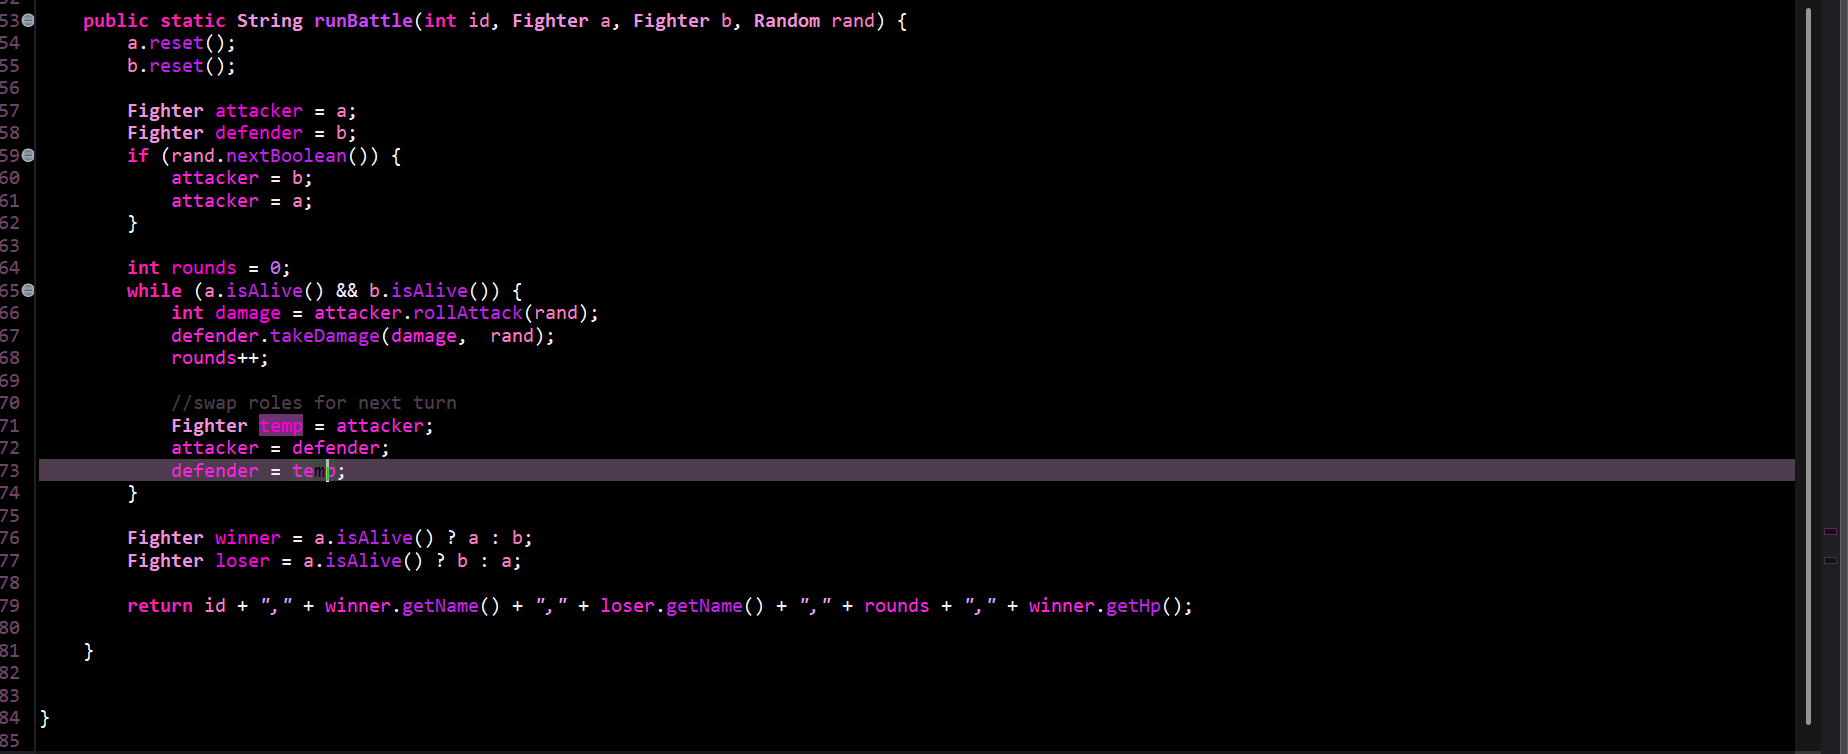
Java ProjectMain (pt.2)
-
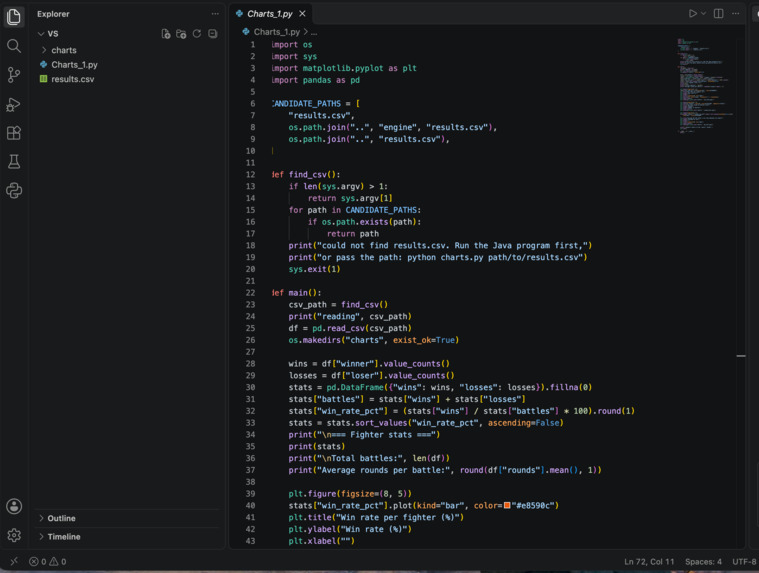
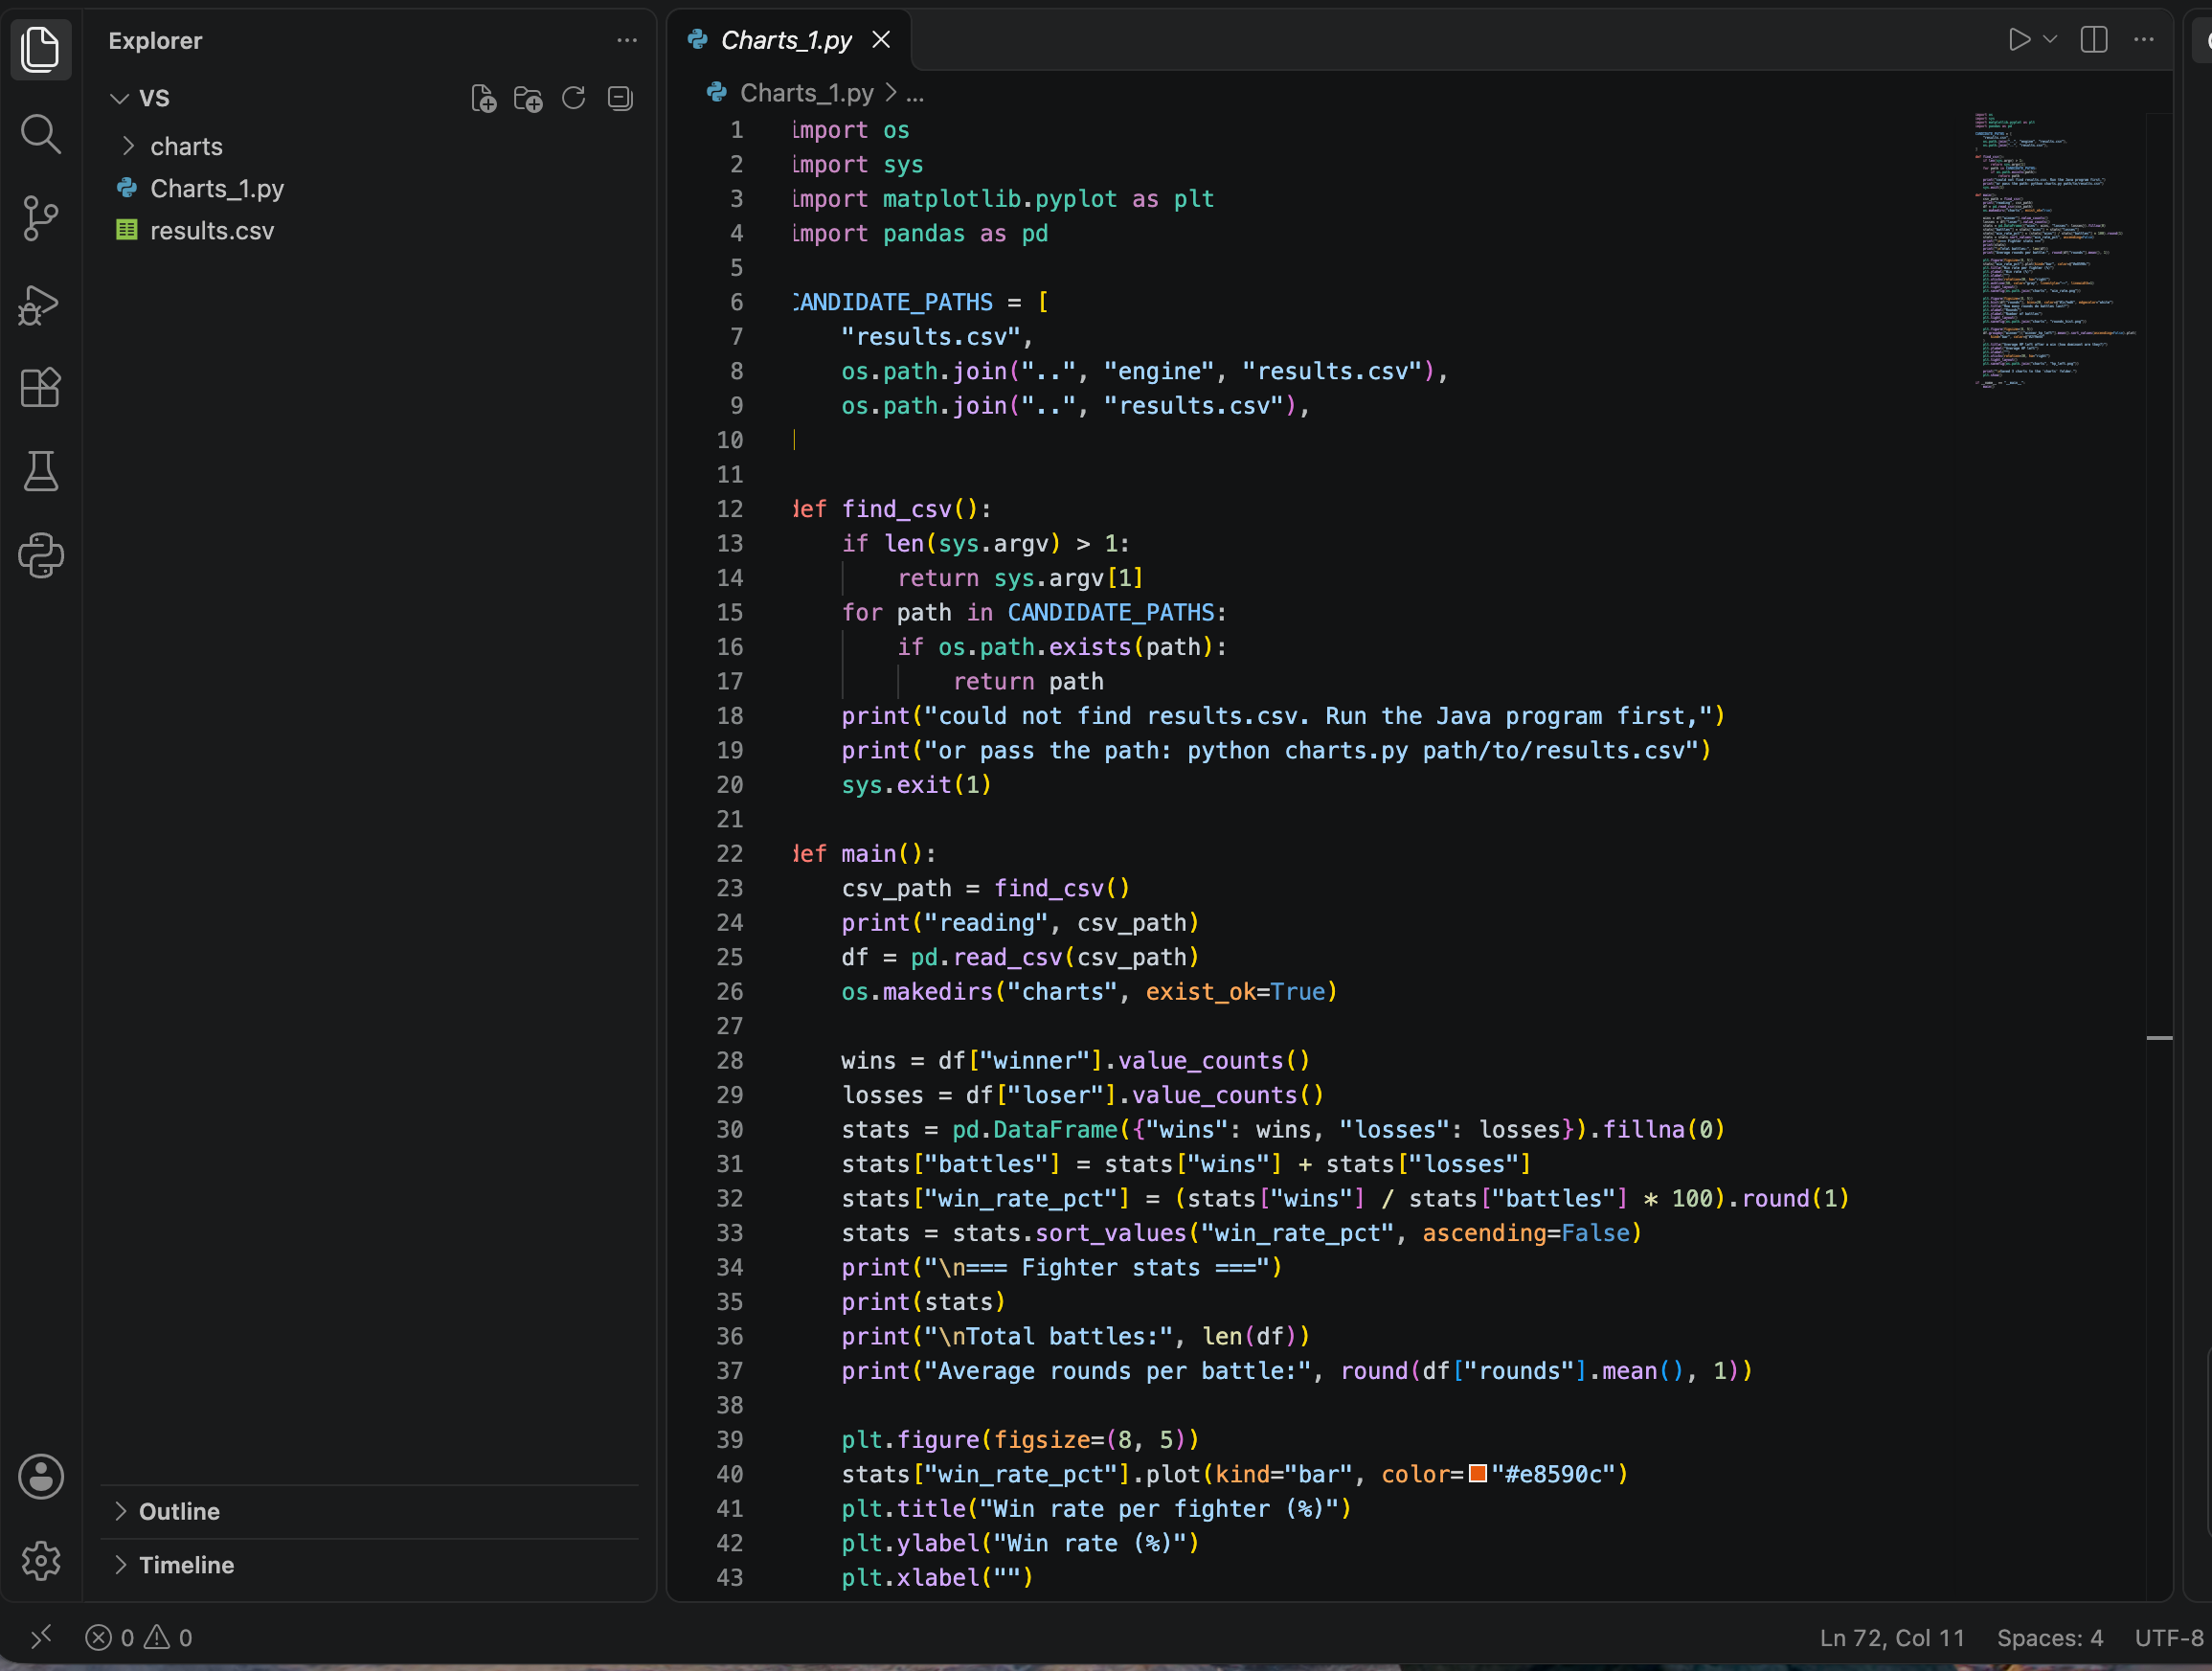
Python code (pt.1)
-
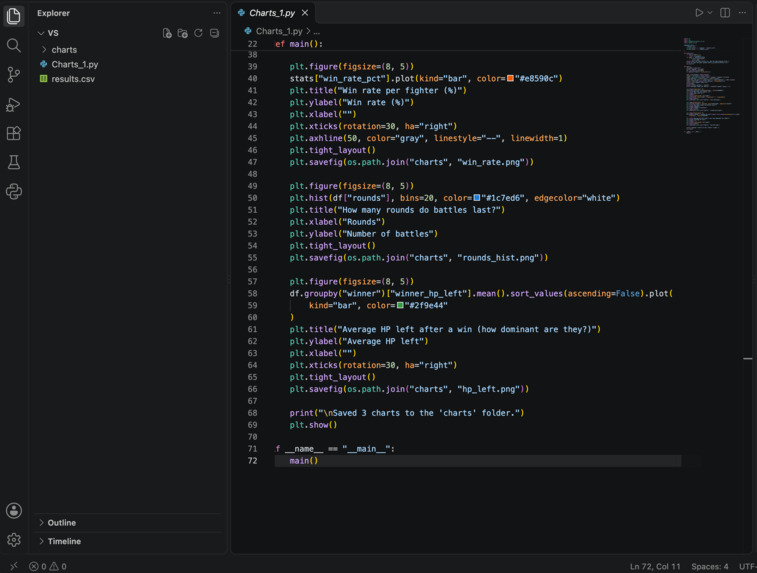
Python code (pt.2)
-
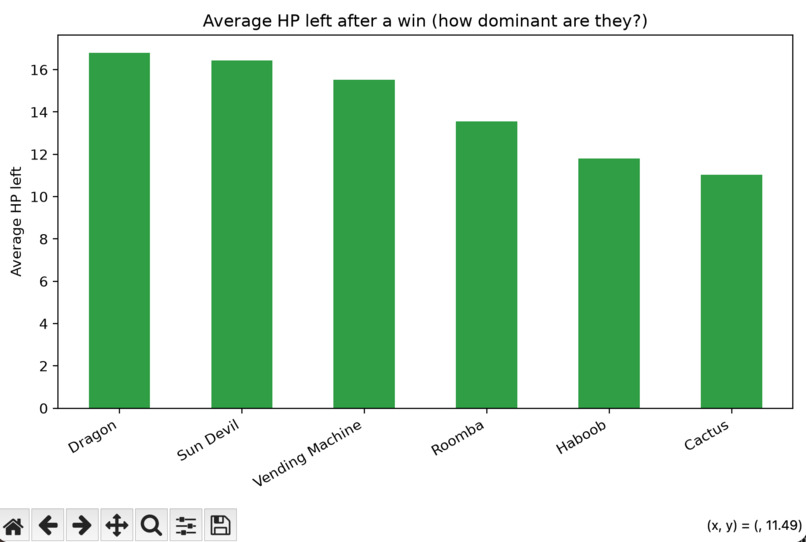
Results diagram (average HP left after a fight)
-
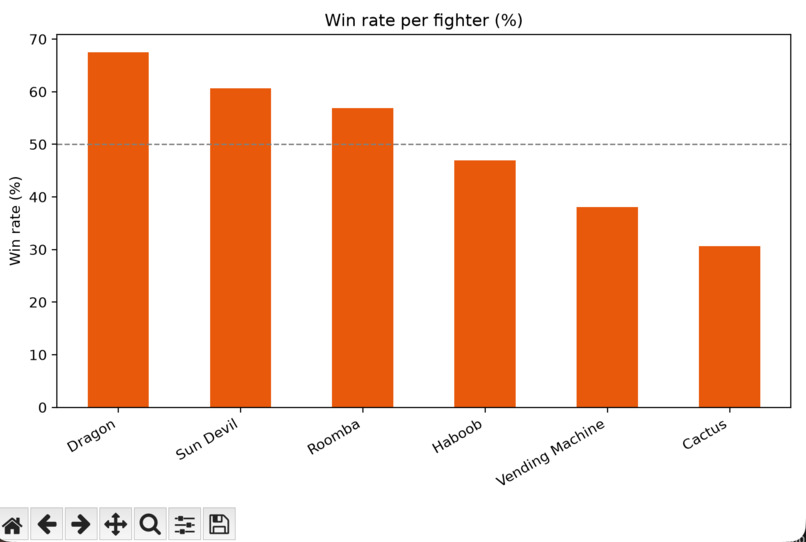
Results diagram (win rate per fight)
-
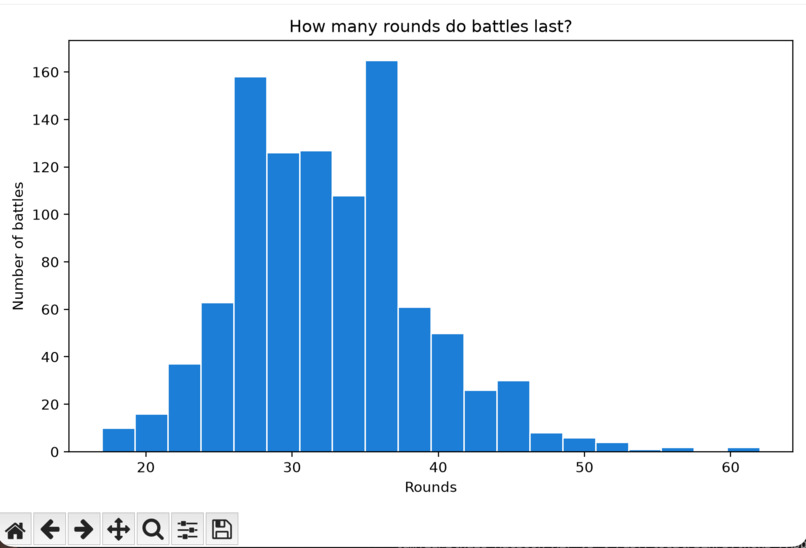
Results diagram (how many rounds the battles last)
Inspiration
Every game with more than one character runs into the same argument: is it actually fair? Players debate it, but opinions aren’t evidence, so we set out to answer the question with data. The result is Arena Analytics, a battle simulator that lets fighters face each other hundreds of times and then tells us who really comes out on top.
What it does
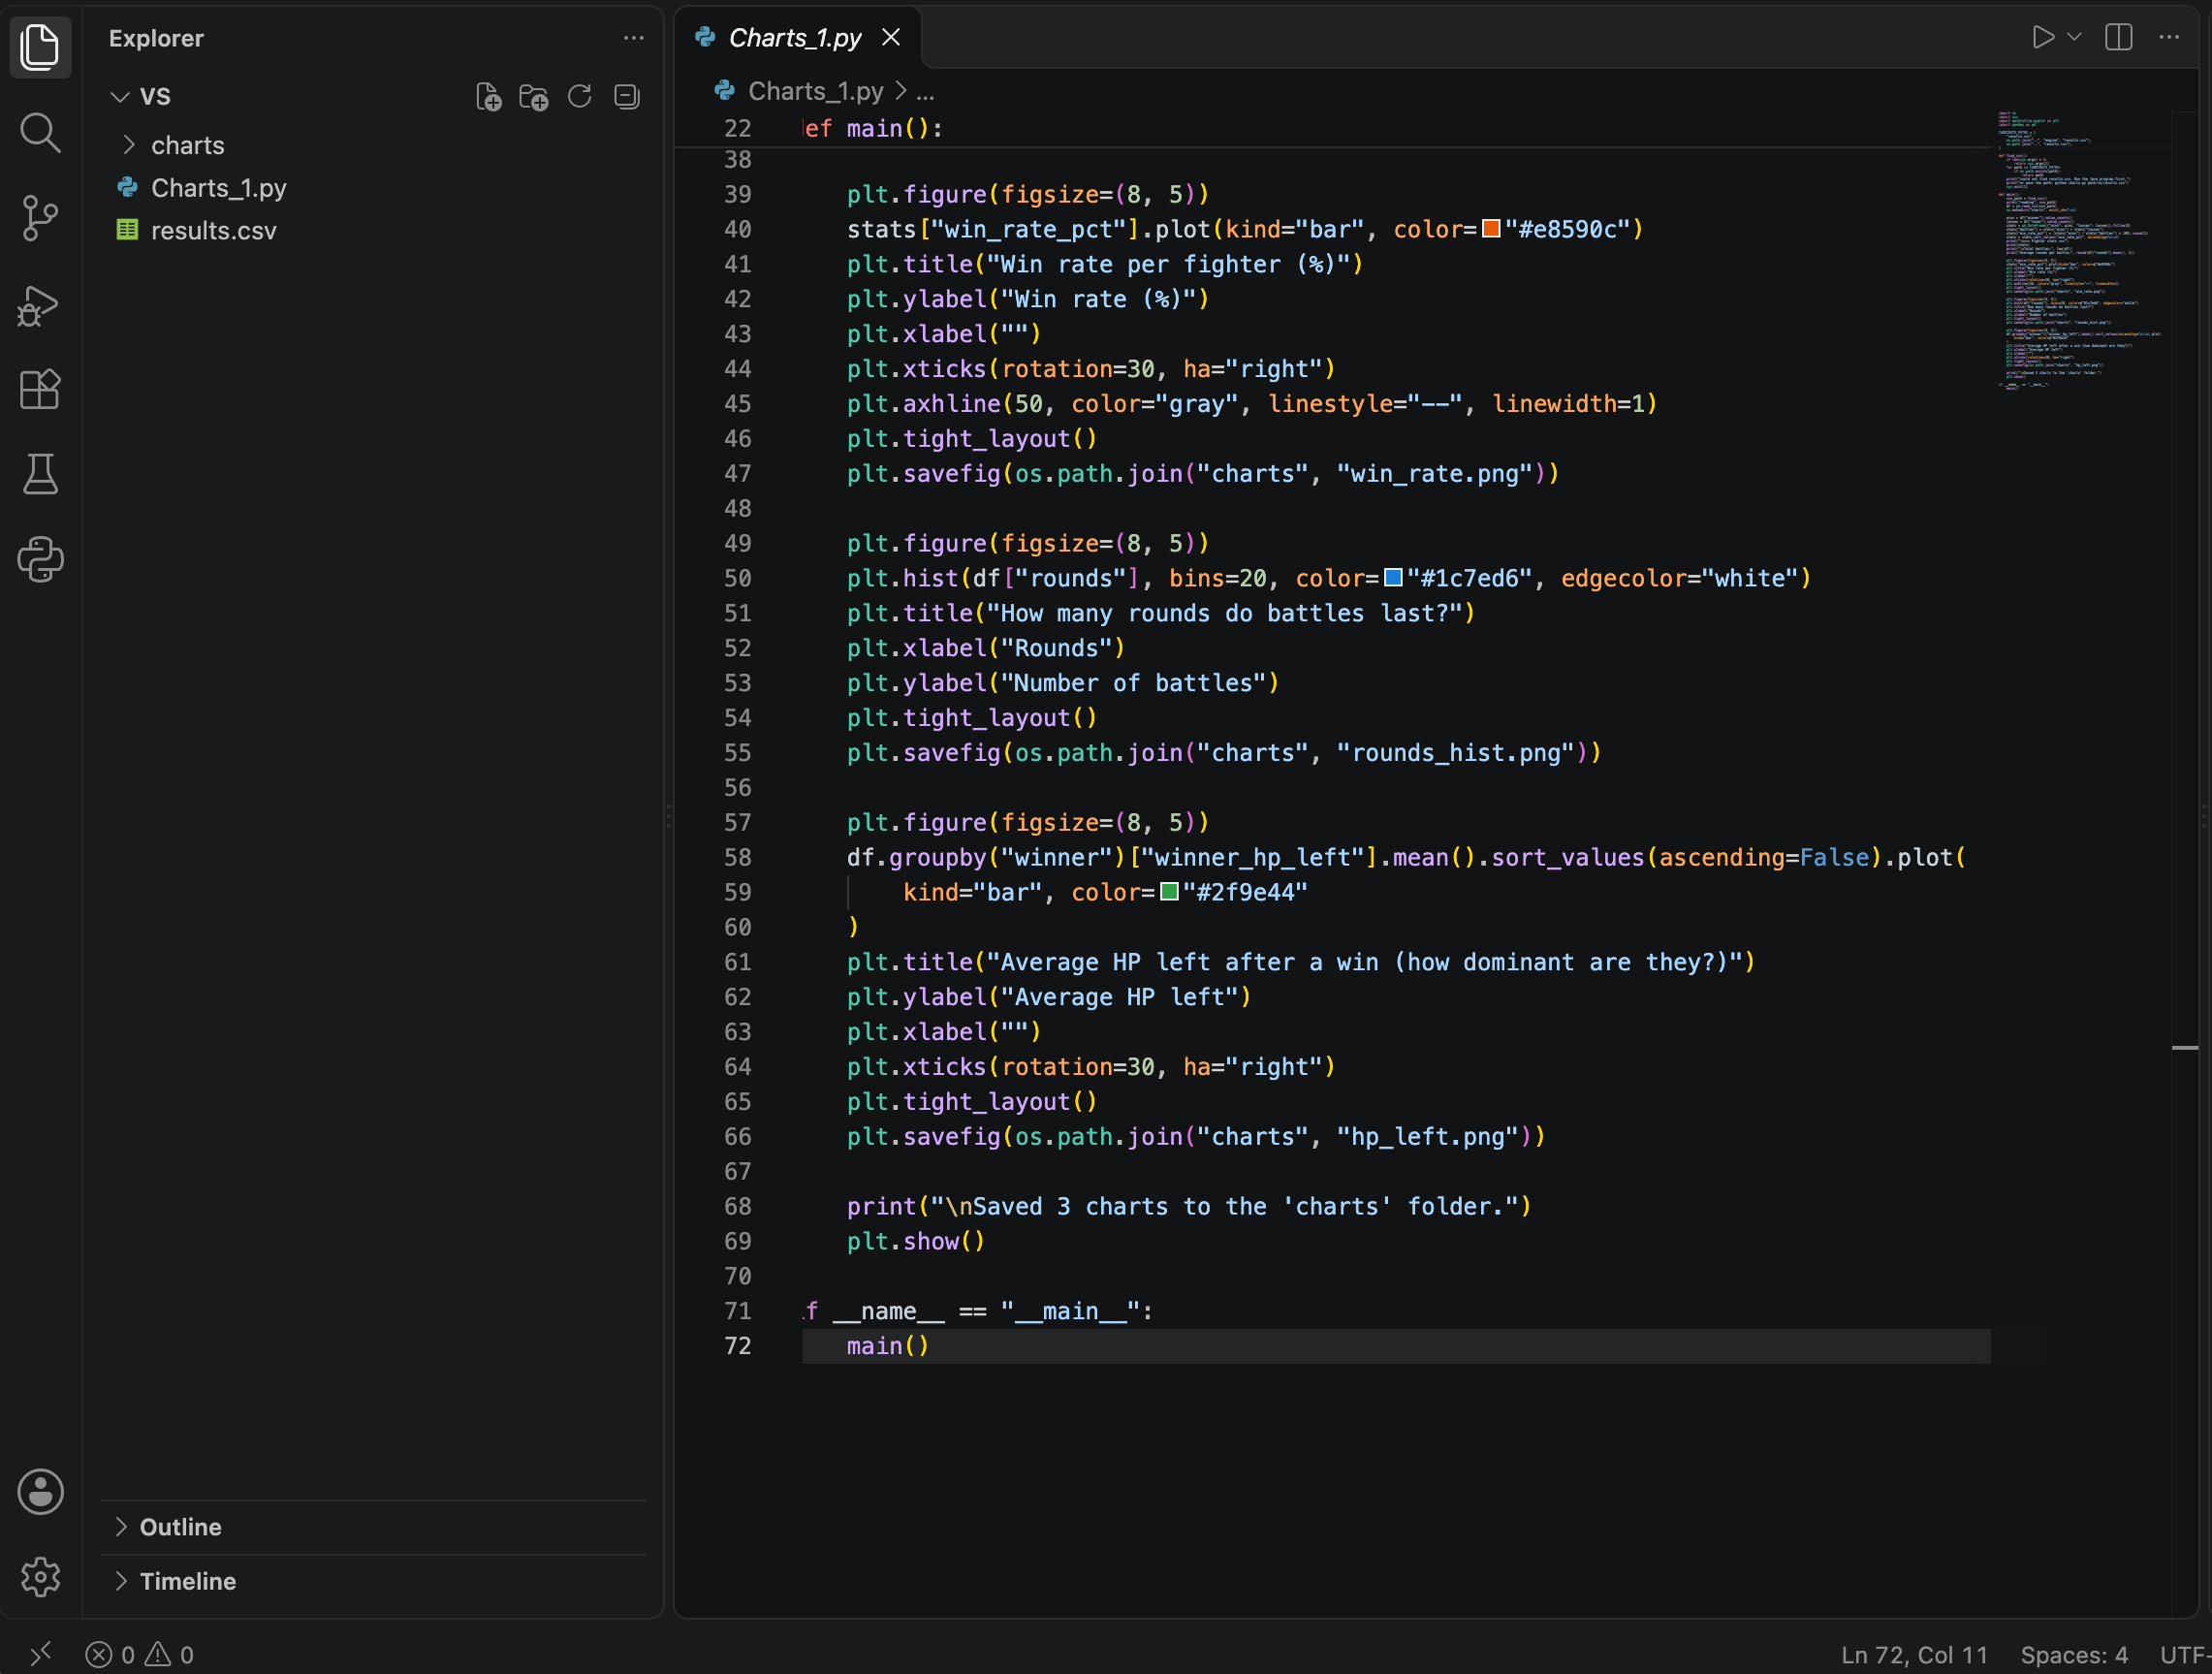
Arena Analytics is a battle simulator with a built-in balance report. A Java engine runs automated fights between [N] different fighters and logs every result: the winner, the loser, how many rounds it lasted, and how much HP the winner had left. A Python analysis tool reads that log and generates three charts:
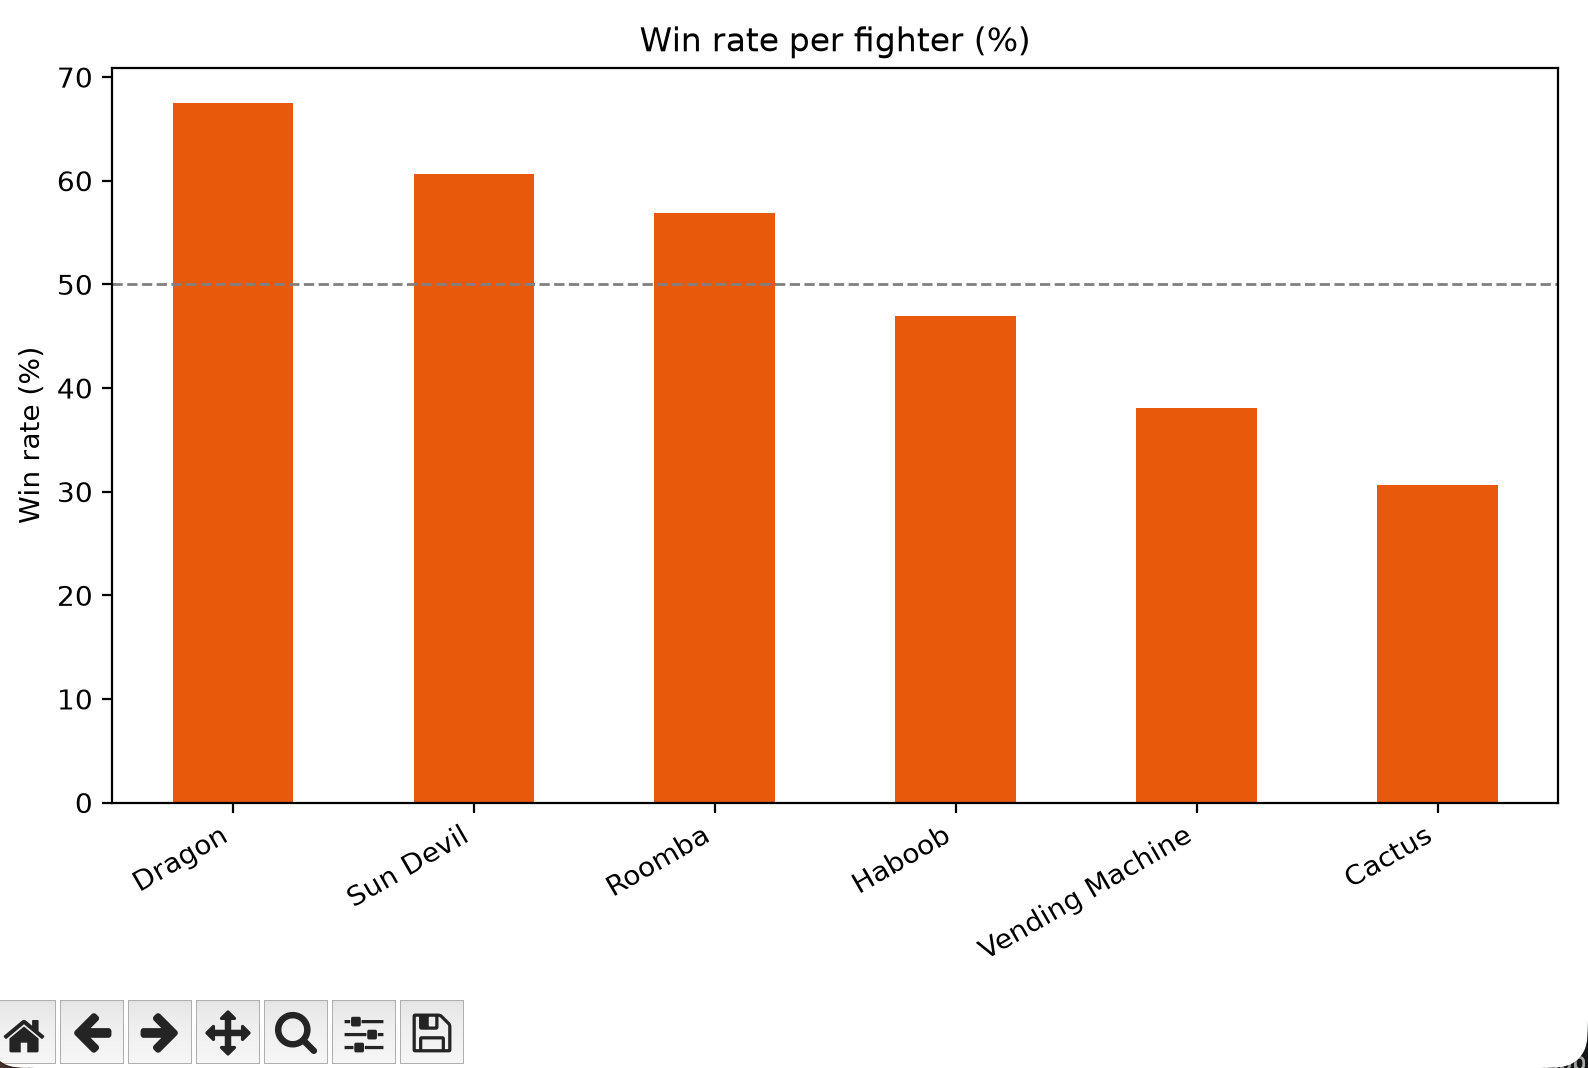
- Win rate per fighter, with a 50% reference line to show who is above or below par
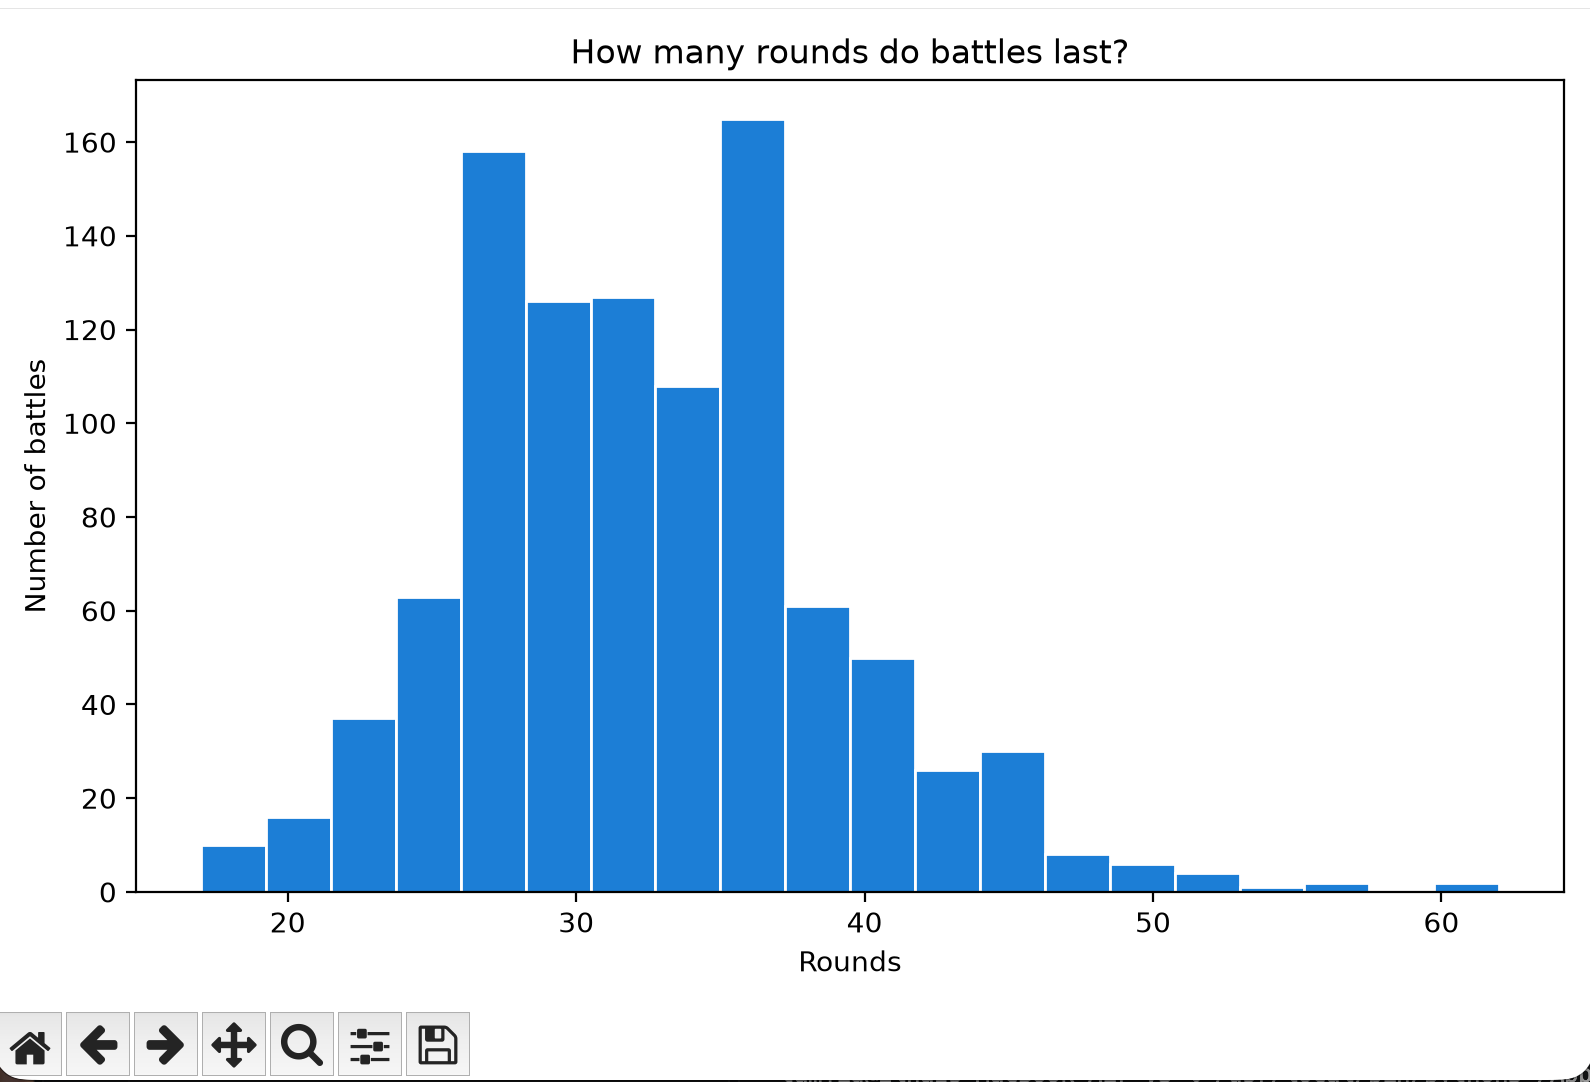
- Battle length, a histogram of how many rounds fights last
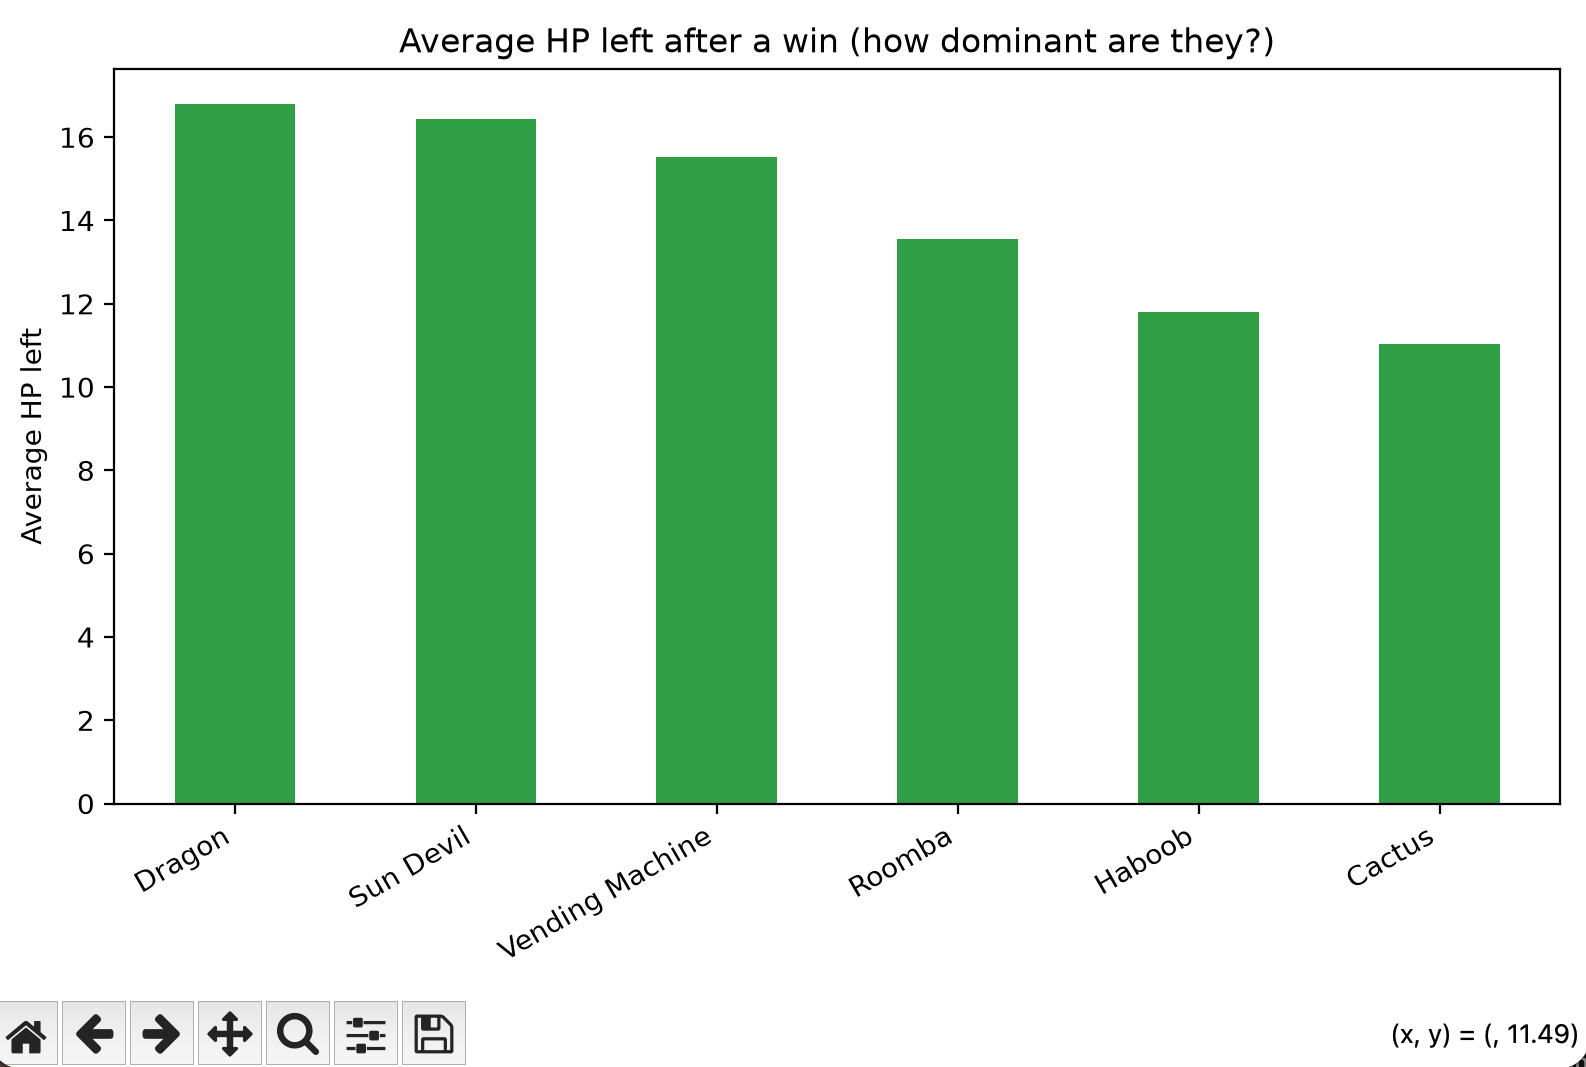
- Dominance, the average HP the winner has left, which shows who wins comfortably and who barely scrapes by
How we built it
The project has two parts that talk to each other through a single CSV file. A Java engine runs automated fights between [N] different fighters, and logs one row per battle: the winner, the loser, how many rounds it lasted, and how much HP the winner had left. A Python tool then reads that log, using pandas to count wins and losses and matplotlib to draw three charts. The first shows each fighter’s win rate against a 50% reference line, the second is a histogram of how long battles last, and the third shows the average HP winners have left, which reveals who wins comfortably and who barely scrapes by. The key statistic is the win rate, {win rate} = ((W)/(W+L))x100, where W is the number of wins and L is the number of losses. In a perfectly balanced game every fighter would sit near 50%, so big deviations flag the characters that need rebalancing.
Challenges we ran into
Java and Python don't share data directly, so we had to agree on a file format. The CSV's column names (winner, loser, rounds, winner_hp_left) had to match exactly or the analysis would fail with a KeyError. Our data file was actually an Excel workbook with the wrong extension, so VS Code refused to open it as text. Additionally, we hit ModuleNotFoundError because the libraries were installed for a different Python than the one running the script which taught us why virtual environments and python -m pip matter. On top of that, a few missing commas, a misspelled method name, and misplaced indentation were each enough to stop the whole script.
Accomplishments that we're proud of
We built a complete pipeline that simulated 1,000 battles between six fighters, analyzed the data, and demonstrated them visually. We did multiple smaller scale tests leading up to this, but the project proves to live up to scalability and other versatile uses. Our biggest accomplishment is that the data answered the question we started with: the game is not balanced, and we can show this with a program we designed ourselves. Win rates ranged from 67.5% for Dragon, which won 222 of its 329 battles, down to 30.6% for Cactus, which won only 95 of 310. That is a gap of nearly 37 percentage points between the strongest and weakest fighter, far from the 50% we would expect in a fair game. Sun Devil (60.6%) and Roomba (56.9%) also finished above the line, while Haboob (46.9%) and Vending Machine (38.1%) fell below it. As new coders at Mesa Community College, we’re especially proud of getting the whole thing working across two languages.
What we learned
Along the way we learned how to build a data pipeline across two languages, how to aggregate with pandas and visualize with matplotlib, and how to debug environment and file-format problems rather than just code.
What's next for Arena Analytics
Next, we want Arena Analytics to suggest stat changes that balance overpowered fighters automatically, add matchup heatmaps showing who beats whom, let users define their own fighters, and wrap everything in a web dashboard that updates live as simulations run.
Built With
- csv
- github
- java
- matplotlib
- pandas
- python
- visual-studio
- vscode


