-
-
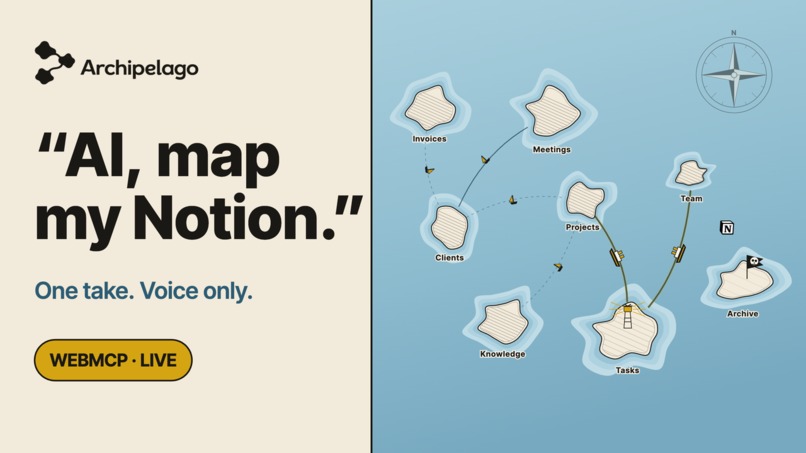
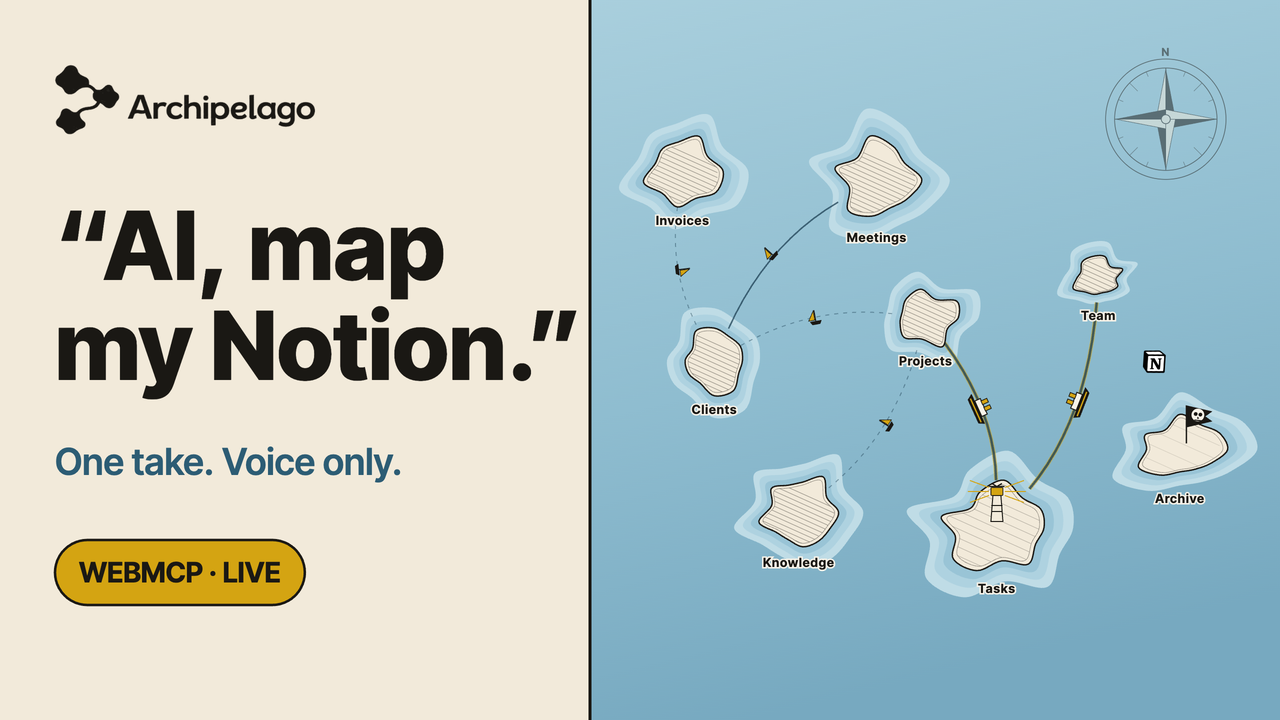
Ask your AI to map your Notion. That single sentence is all it takes: Archipelago draws the chart on the right.
-
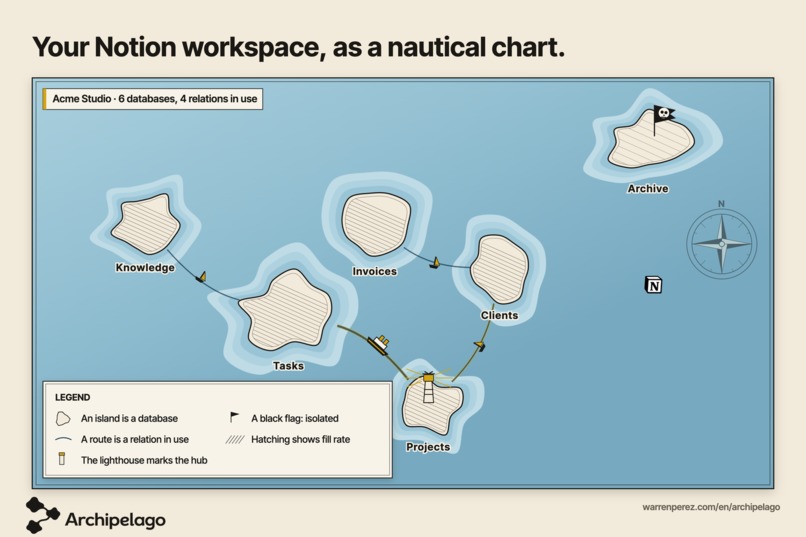
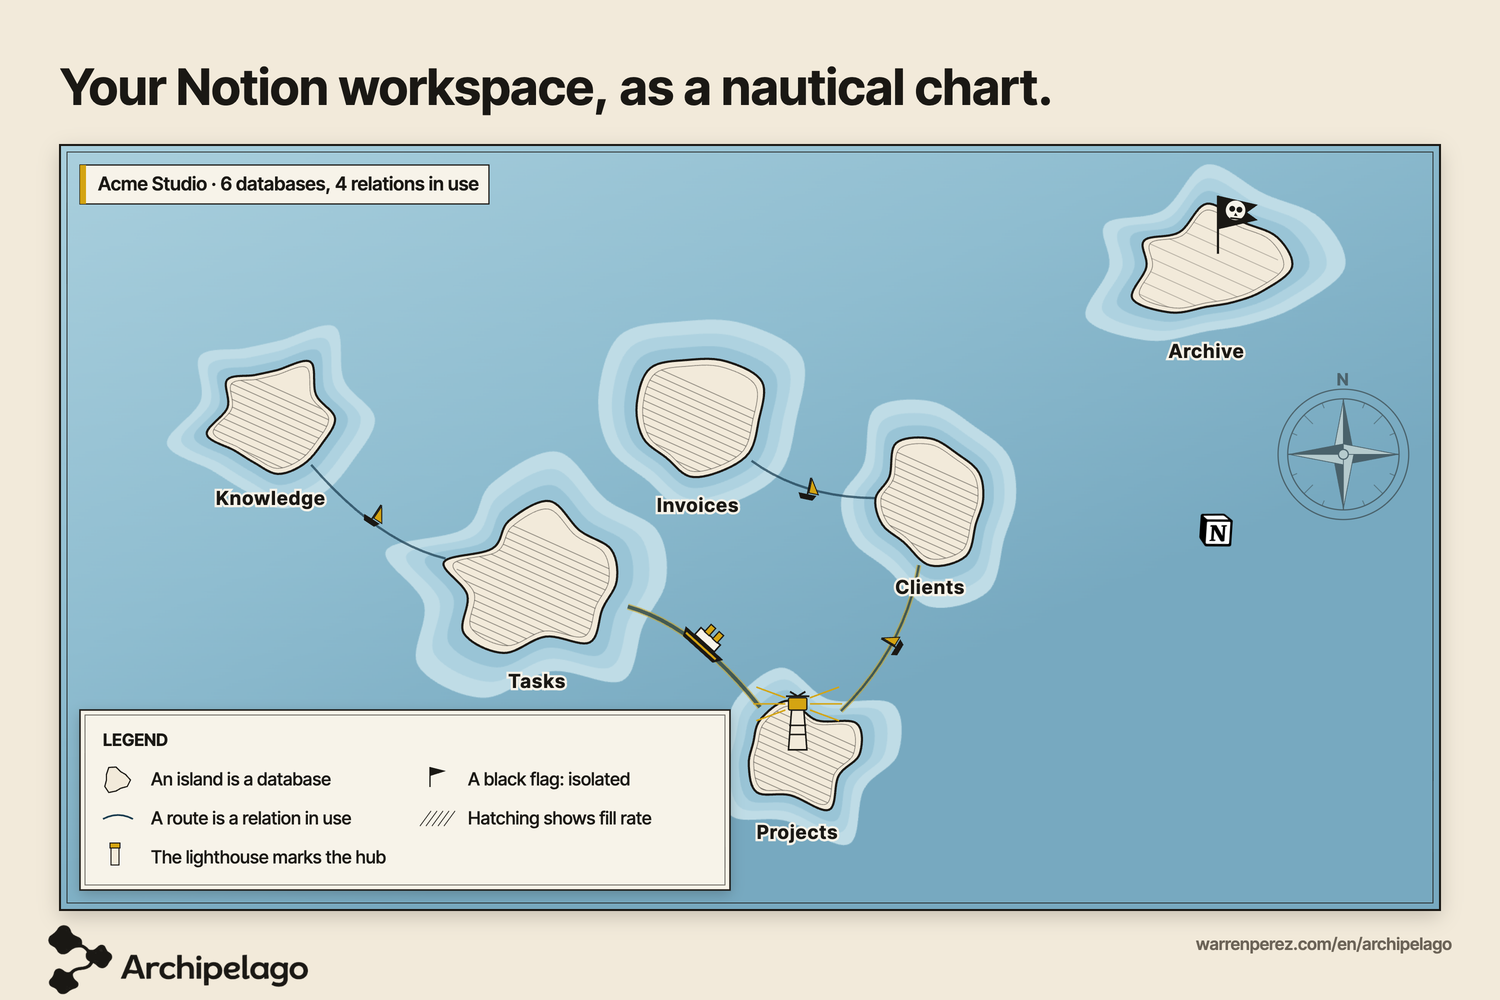
Each database is an island sized by its rows; used relations become routes. The lighthouse marks the hub, a black flag an isolated base.
-
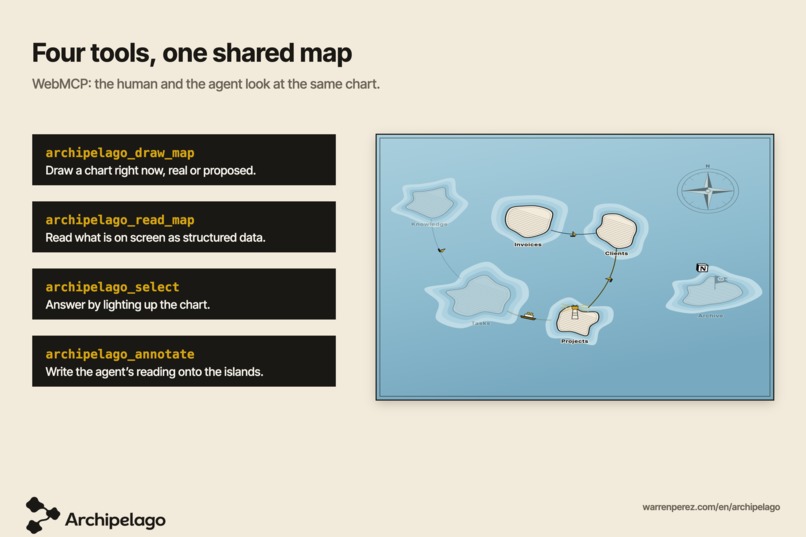
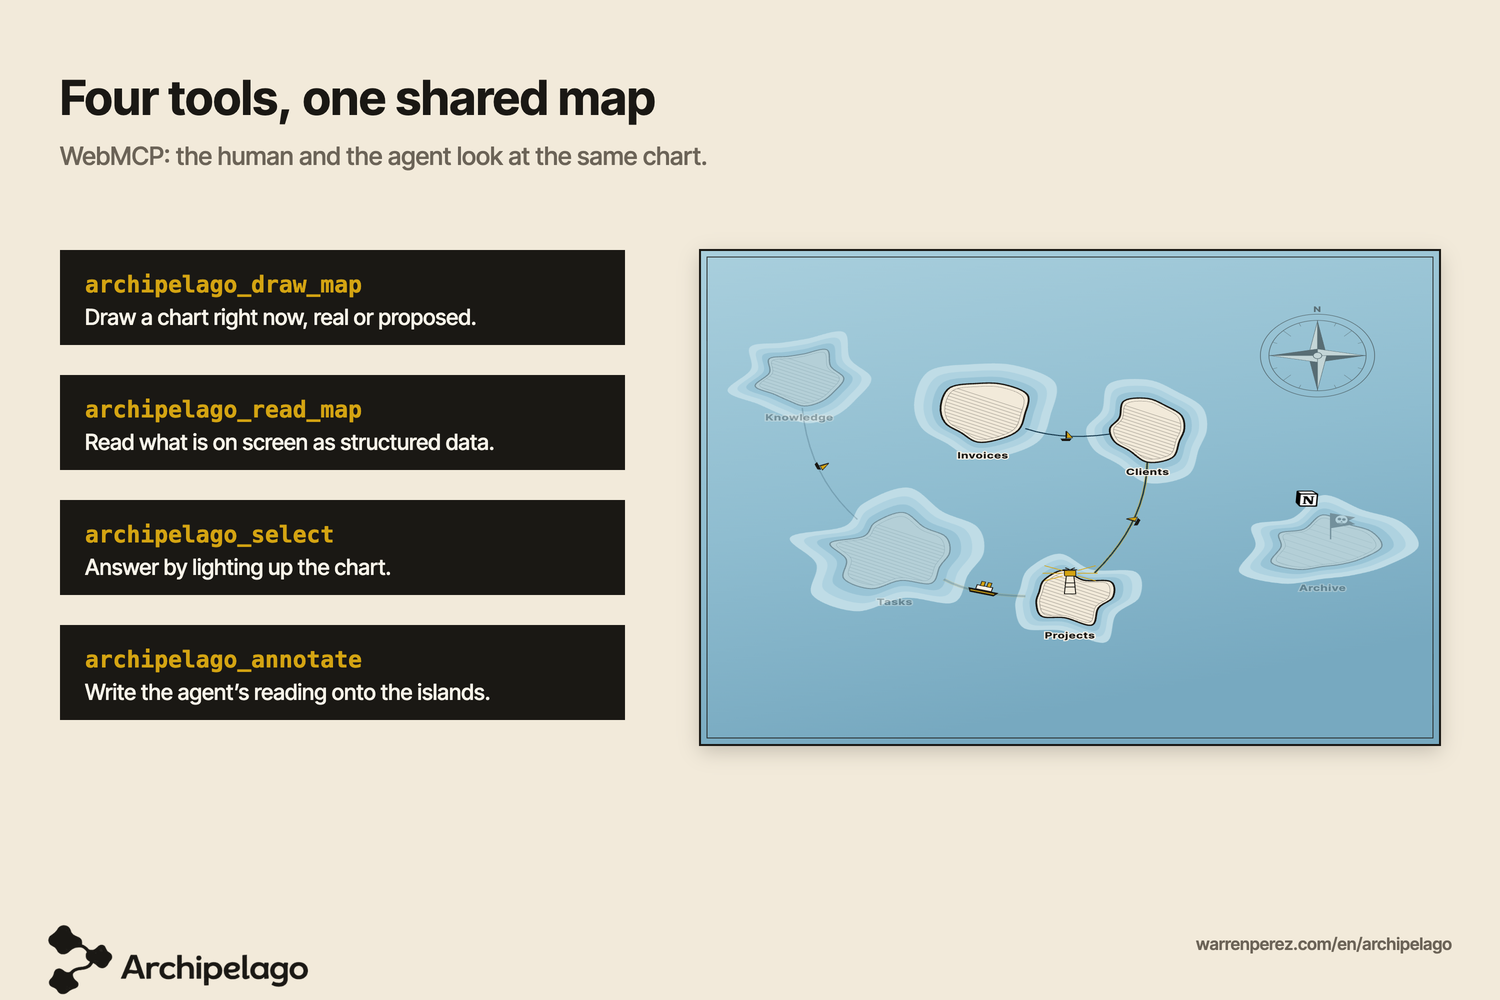
The four WebMCP tools: draw a map, read it as structured data, highlight a computed set, annotate islands. Human and agent share one screen.
-
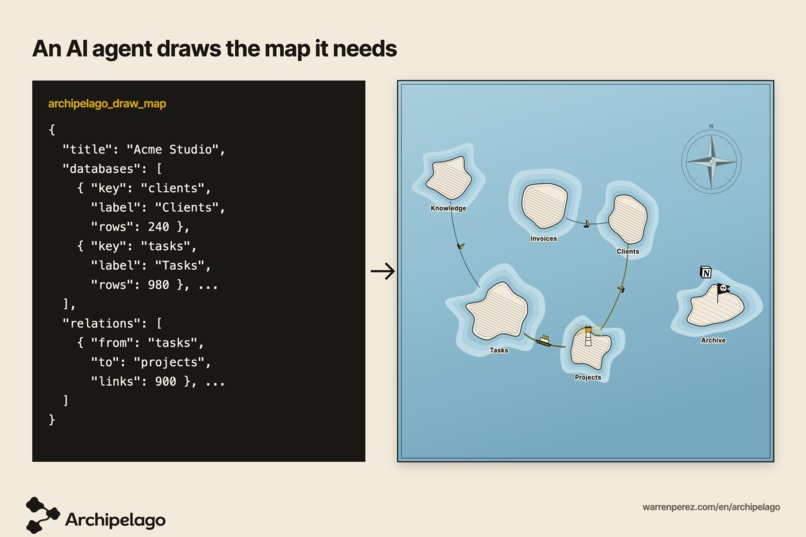
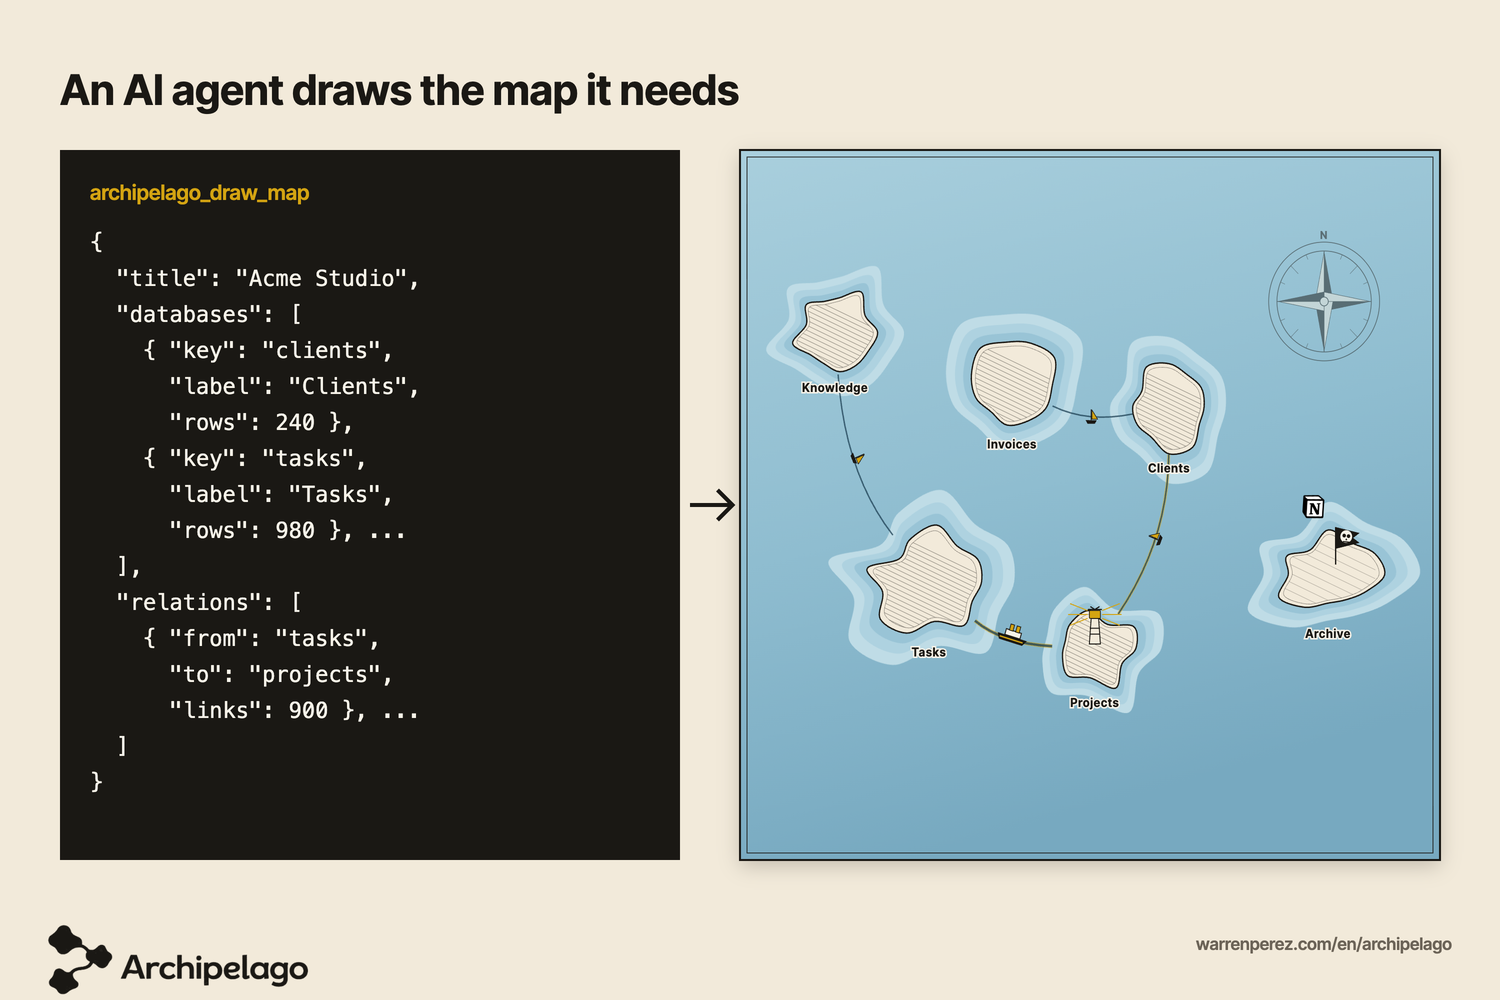
One call to archipelago_draw_map: database names, row counts and relation metadata in, a live chart out. Rendered locally in the browser.
Why I built it
I'm a certified Notion consultant. A lot of my work is helping companies turn collections of databases, documents and workflows into actual operational systems.
The problem is that systems are hard to explain.
Most people are not technical, and looking at a workspace page by page makes it difficult to understand the whole thing. Is everything connected? Where does the structure actually live? Which databases are sitting alone?
So I wanted a very simple visual language.
In Archipelago, databases become islands, relations become routes, and linked data becomes convoys on those routes. You can look at the map for a few seconds and start asking better questions.
That was the original idea: make a complex workspace easier to see and discuss.
What it does
Drop a Notion .zip export into Archipelago and it builds the map directly in your browser.
Nothing is uploaded and Archipelago never connects to your Notion account.
The result is deliberately playful rather than overly analytical. No score, no grade. The map gives you the structure and a one-line reading of it; what it means stays your call.
It also makes a useful teaching tool when discussing a workspace with people who would never want to look at a database schema.
Then came WebMCP
The WebMCP part felt obvious to me quite quickly.
If a human can use the map to understand a system, an AI agent should be able to use the same map rather than living in a separate chat window.
So during the Challenge I added four WebMCP tools that let an agent:
- build a map from structured workspace data;
- read the map currently on screen;
- highlight databases;
- add its interpretation directly to the map.
A user can now ask something like:
"Show me everything connected to Clients."
and the answer appears on the map they are already looking at.
The actual challenge
I'm not a developer by background, so part of the challenge was simply understanding a very new standard well enough to implement it properly.
But the harder problem is still the one I'm working on:
How do you make an agent visiting a website immediately understand that it can act there?
I don't want the user to have to explain:
"This site supports WebMCP. Go read the documentation, find the tools, then use them."
The ideal experience is that the agent arrives, understands the capabilities exposed by the page, chooses the right tool and acts.
Because WebMCP is still experimental, getting that discovery and tool-routing behavior to feel reliable across agents and browsers has been the most interesting part of the project.
I have tried to follow the emerging best practices closely: explicit tool names, precise descriptions, structured schemas, state-aware error responses, and additional agent-oriented documentation.
There is still a lot to learn.
How I built it
Archipelago is intentionally small: vanilla JavaScript, static files, no application backend and no build step.
I built it with extensive AI assistance: ChatGPT as a strategic and tactical sparring partner, and Claude Code as the primary implementation agent.
That workflow is also part of what made this project interesting to me. I don't come from a traditional software engineering background, but I could still spend most of my time on the parts I care about: the concept, the interaction model, the visual language and what the tool should actually do.
What's next
Notion is the first use case because it is the environment I know best, and because it already has a large community of people building increasingly complex systems with it.
But I think the underlying idea can go further than mapping.
Once a human and an agent can share the same visual representation of a system, the next step is to design and evolve that system together.
The map could become a working surface for proposing a new structure, comparing it with the current one, highlighting dependencies, testing changes and progressively co-constructing an operational system.
Archipelago starts with visibility.
What interests me next is what happens when that shared visual interface becomes a place where humans and agents can actually build together.
Built With
- canvas
- css3
- html5
- javascript
- jszip
- notion
- svg
- webmcp

Log in or sign up for Devpost to join the conversation.