
Inspiration
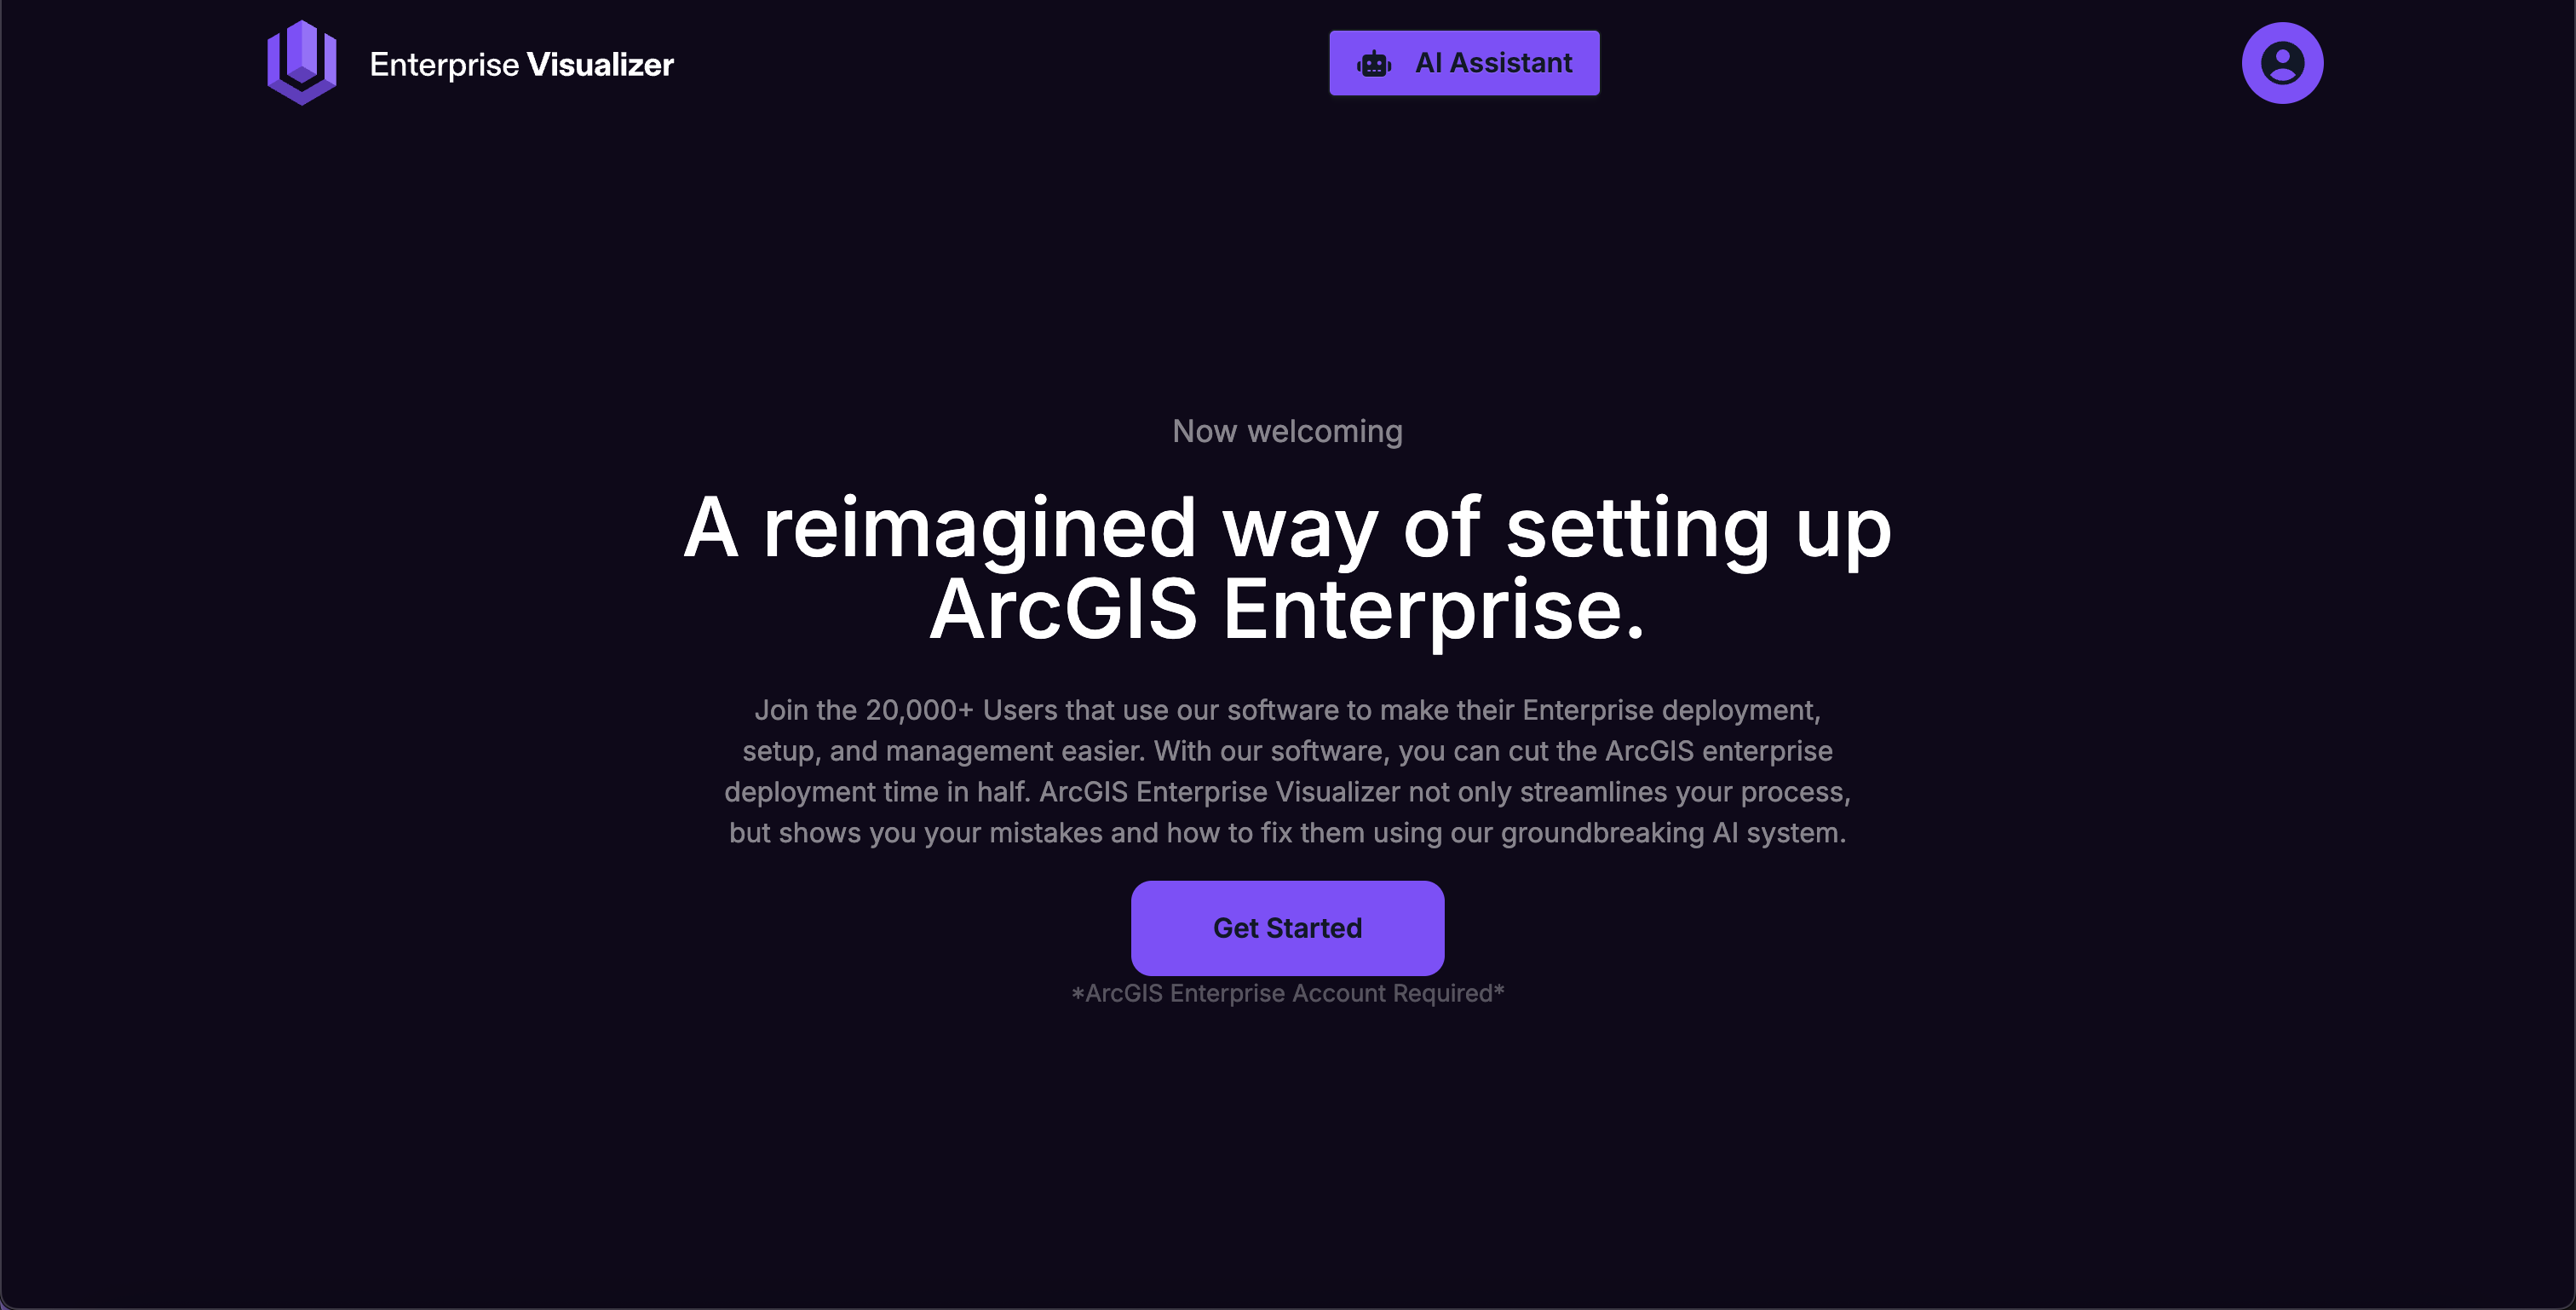
It takes a lot of time and efforts for Esri customers to deploy, configure, and manage. There are at more than five endpoints to locate and debug when error happens. So the initial idea of ArcGIS Enterprise Visualizer (ArcGIS EV) is to monitor, and debug components of ArcGIS Enterprise within ONE SINGLE site, and provide users to fix the problems.
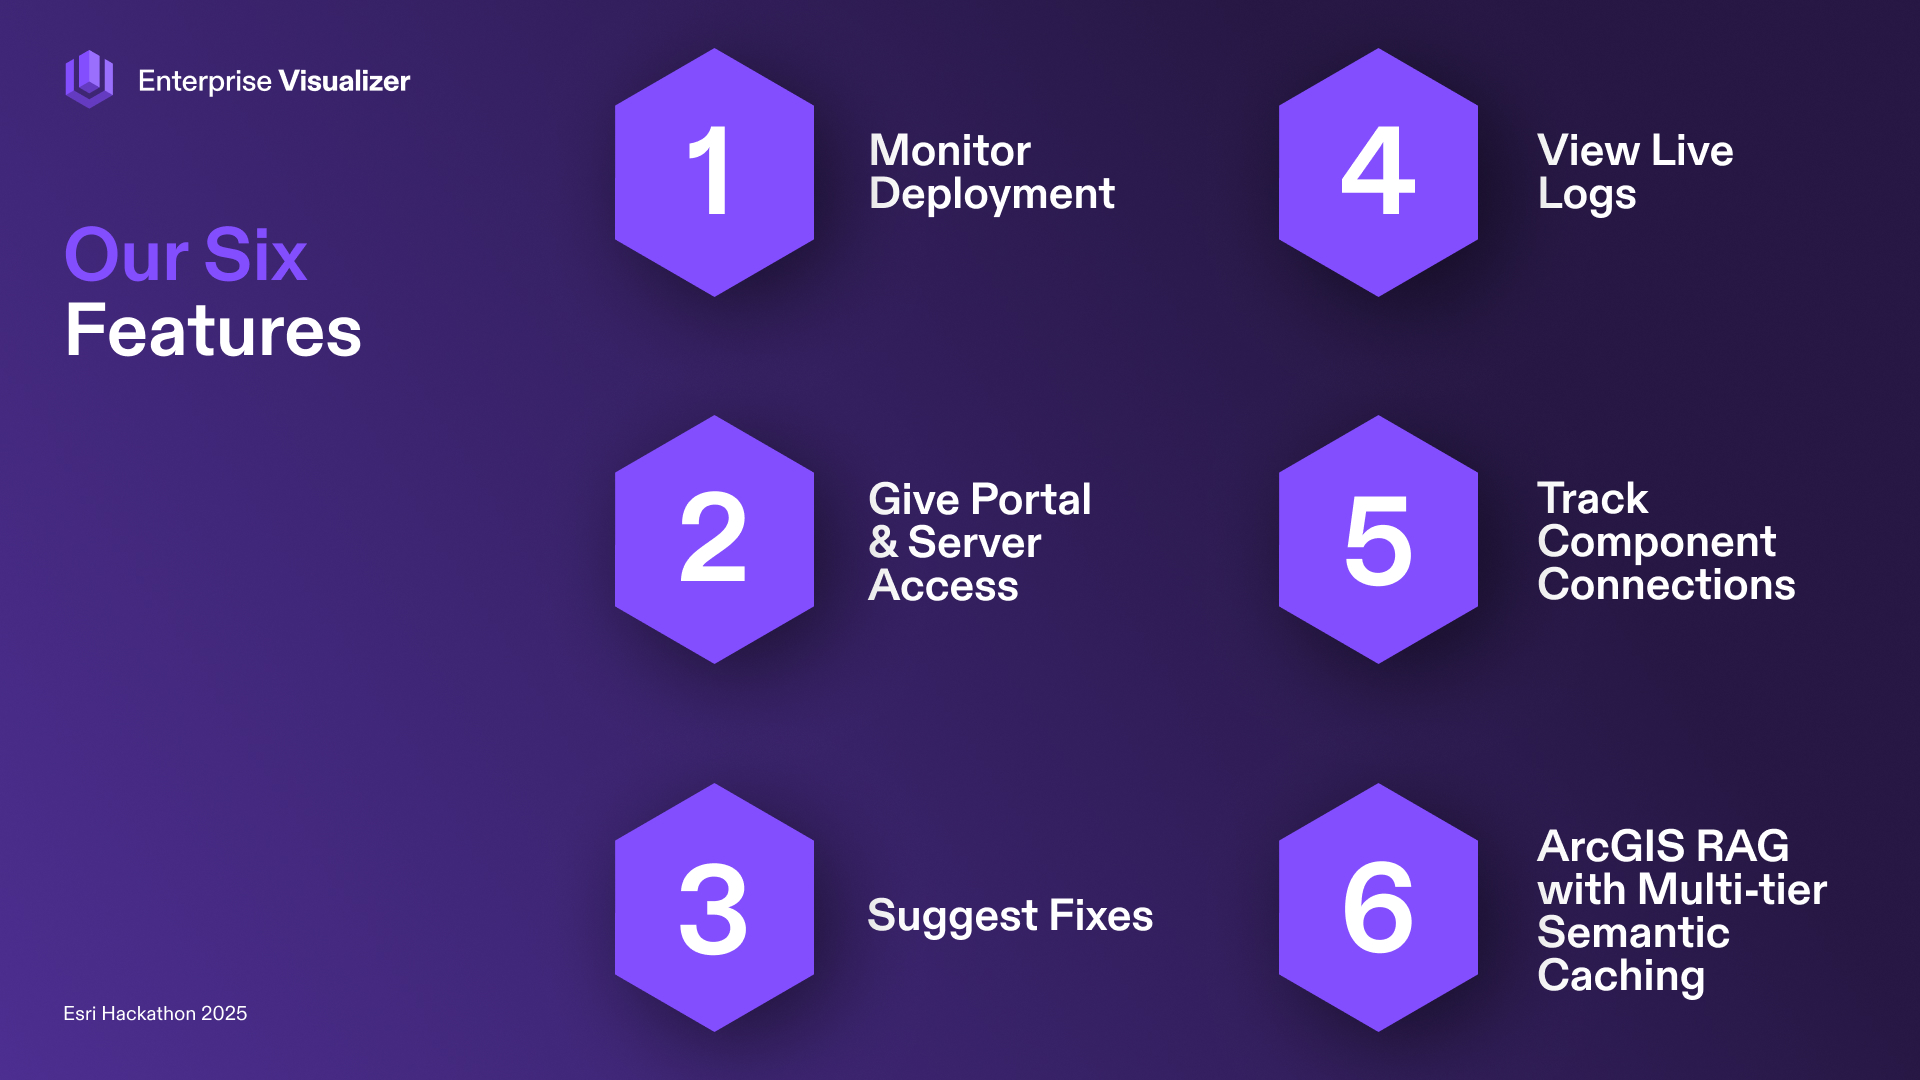
What it does
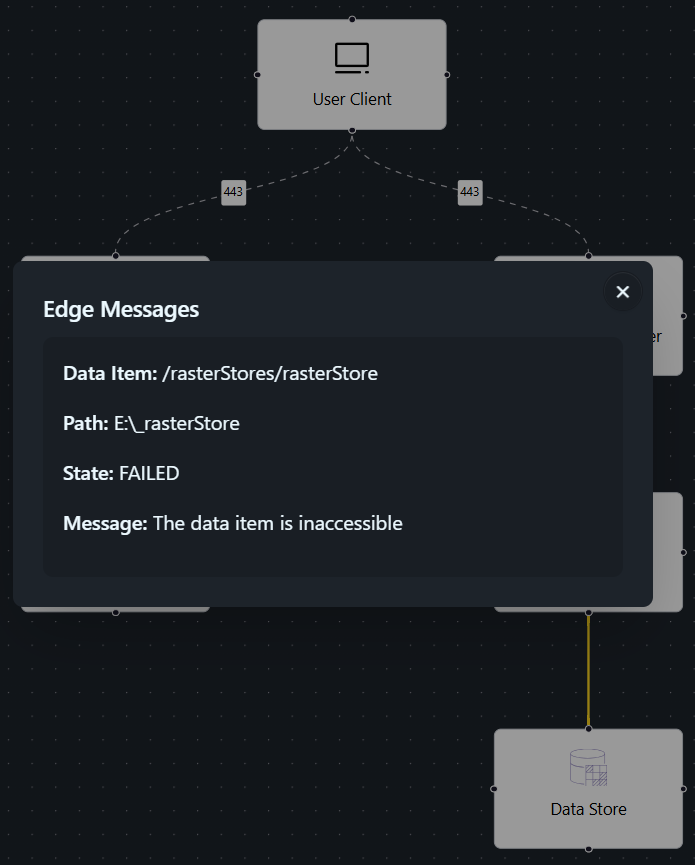
- Monitor Enterprise components
- Give Portal & Server Access
- Suggest Fixes
- View Live Logs
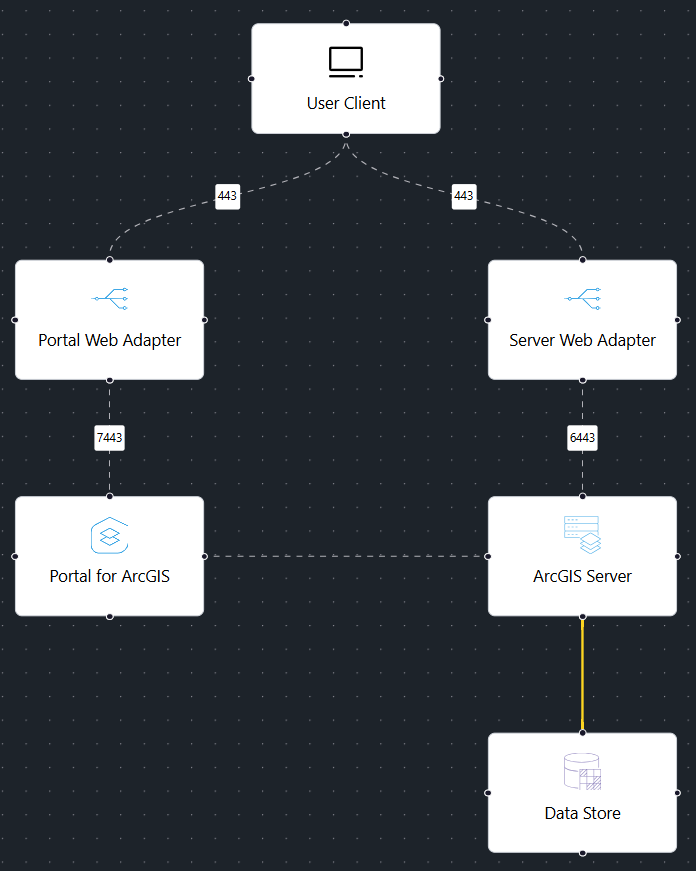
- Track Component Connection Status
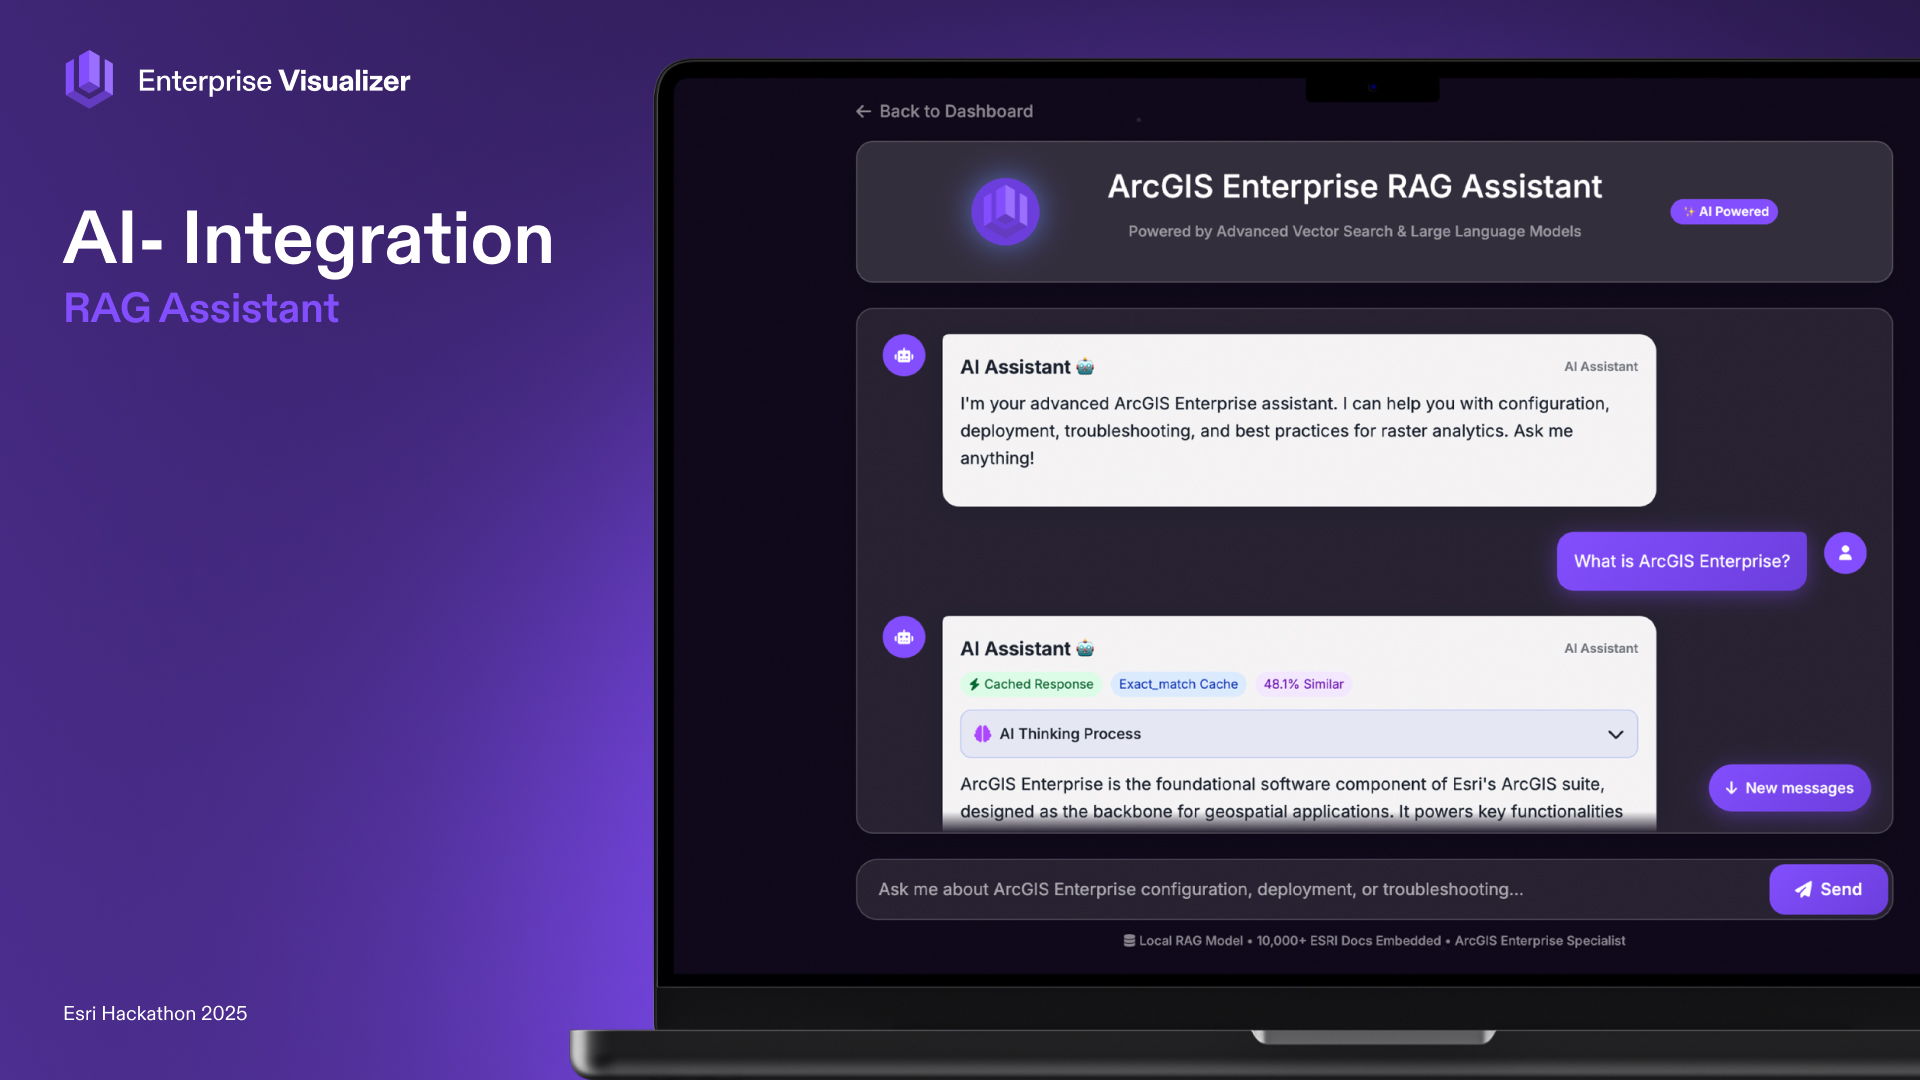
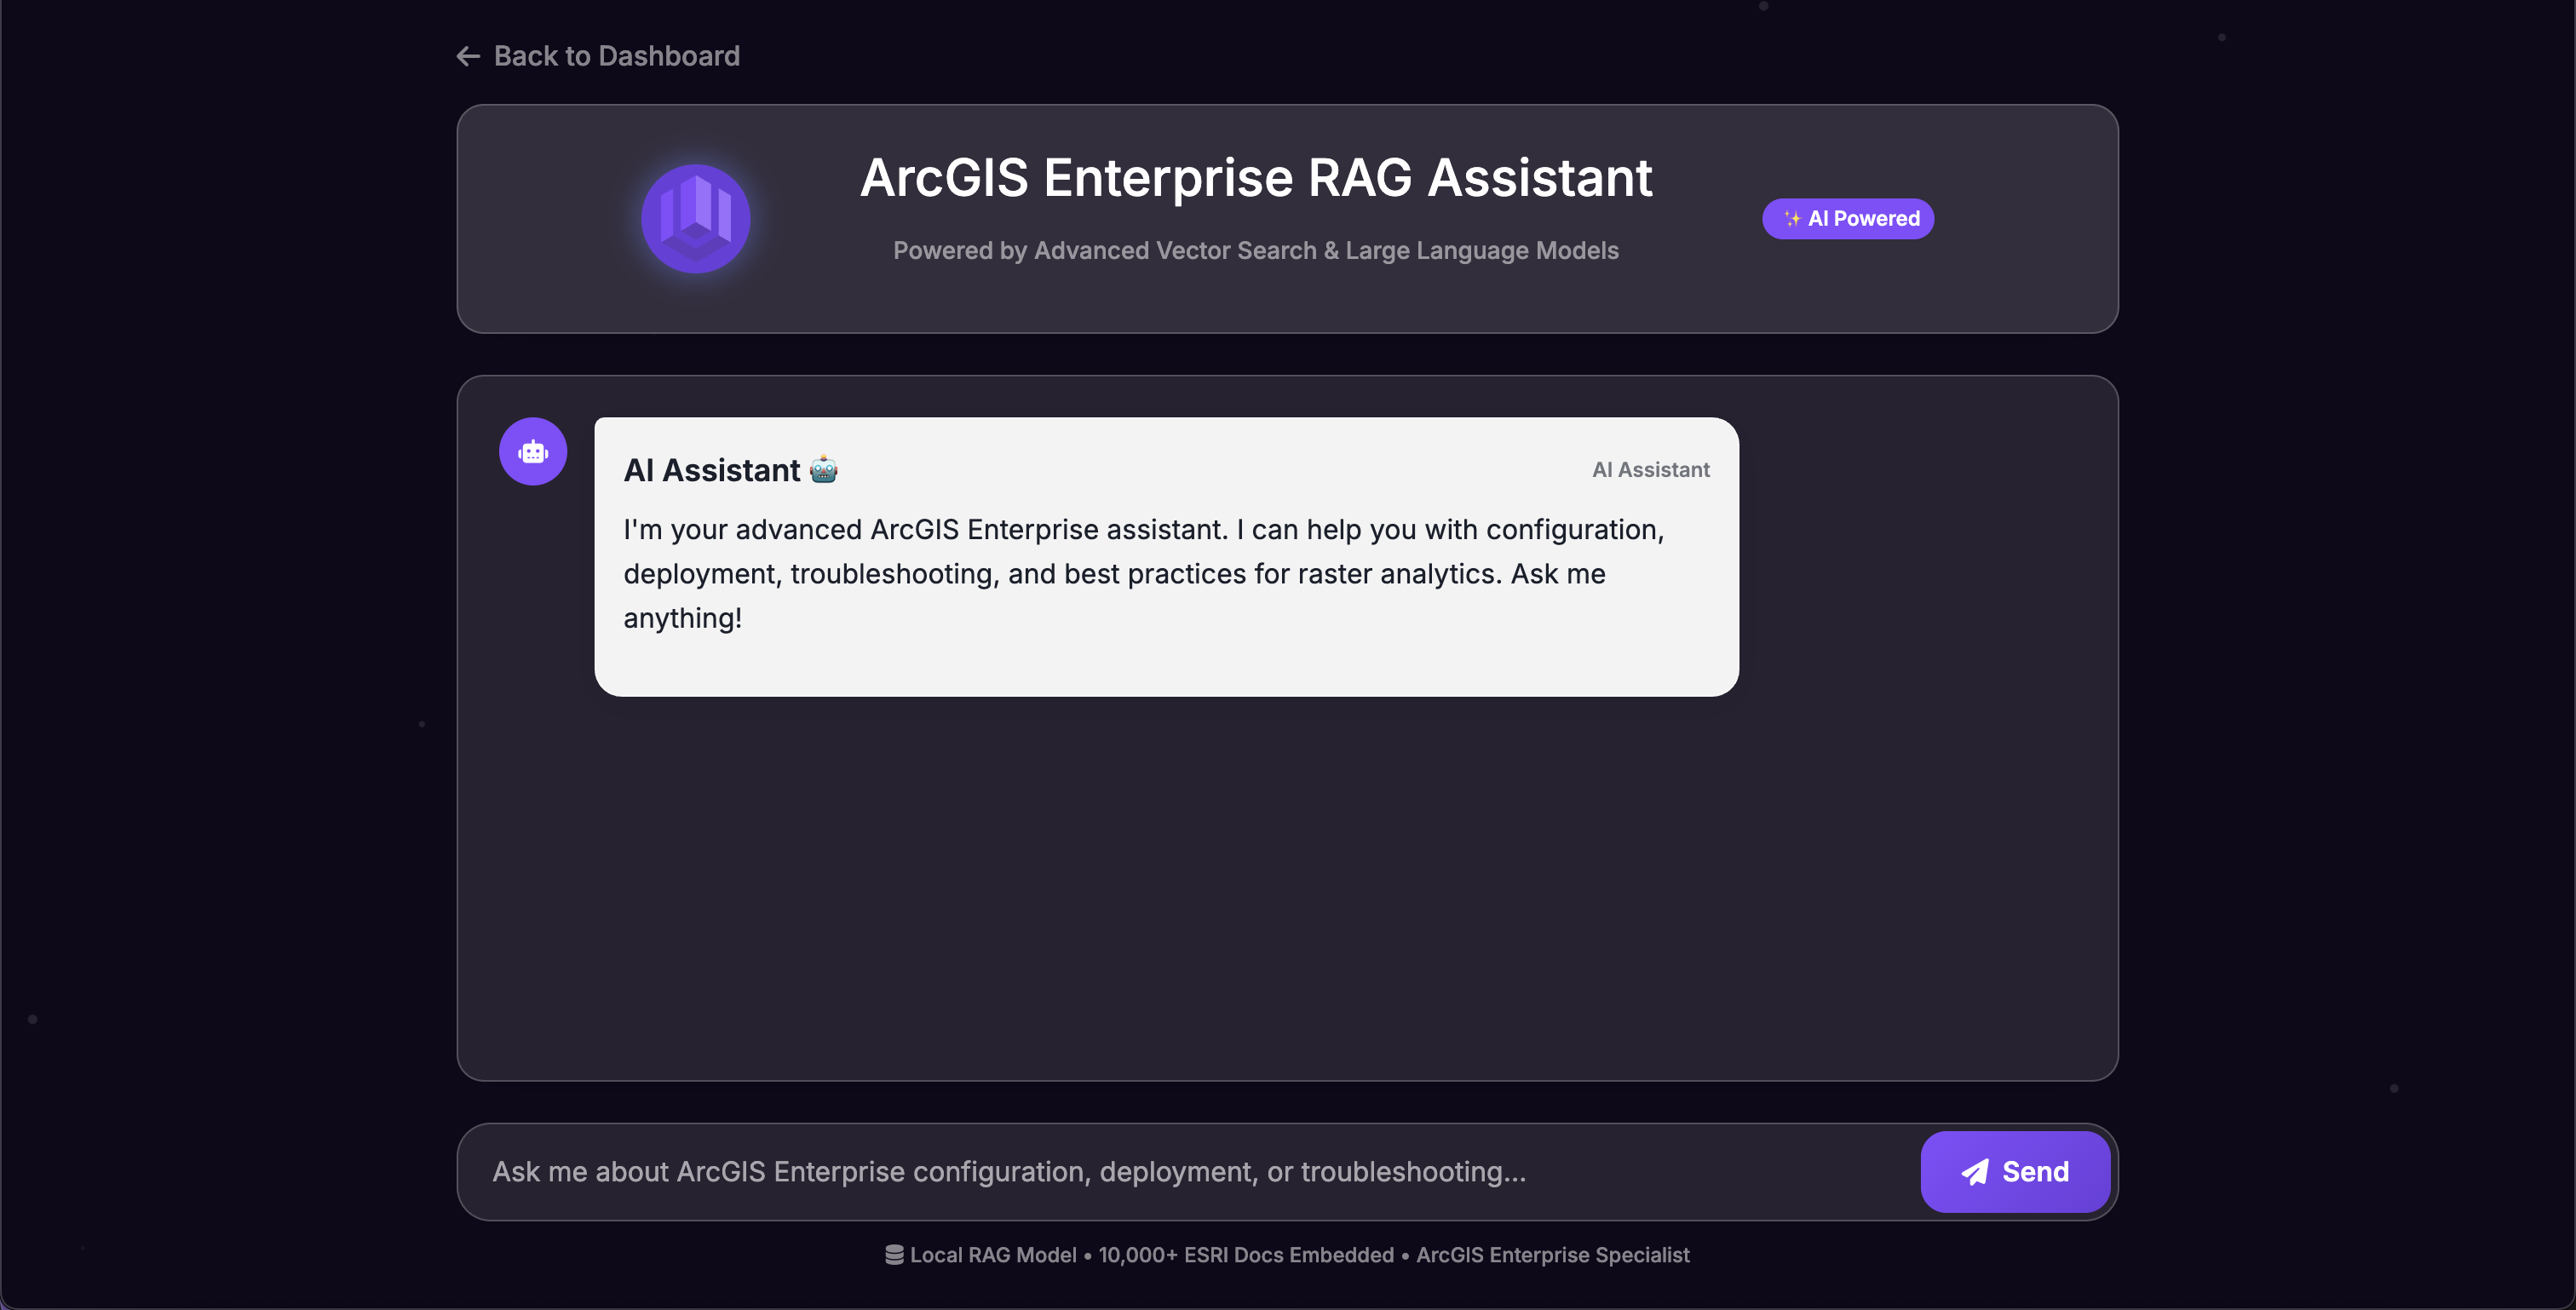
- ArcGIS RAG with multi-tier Semantic Caching
How we built it
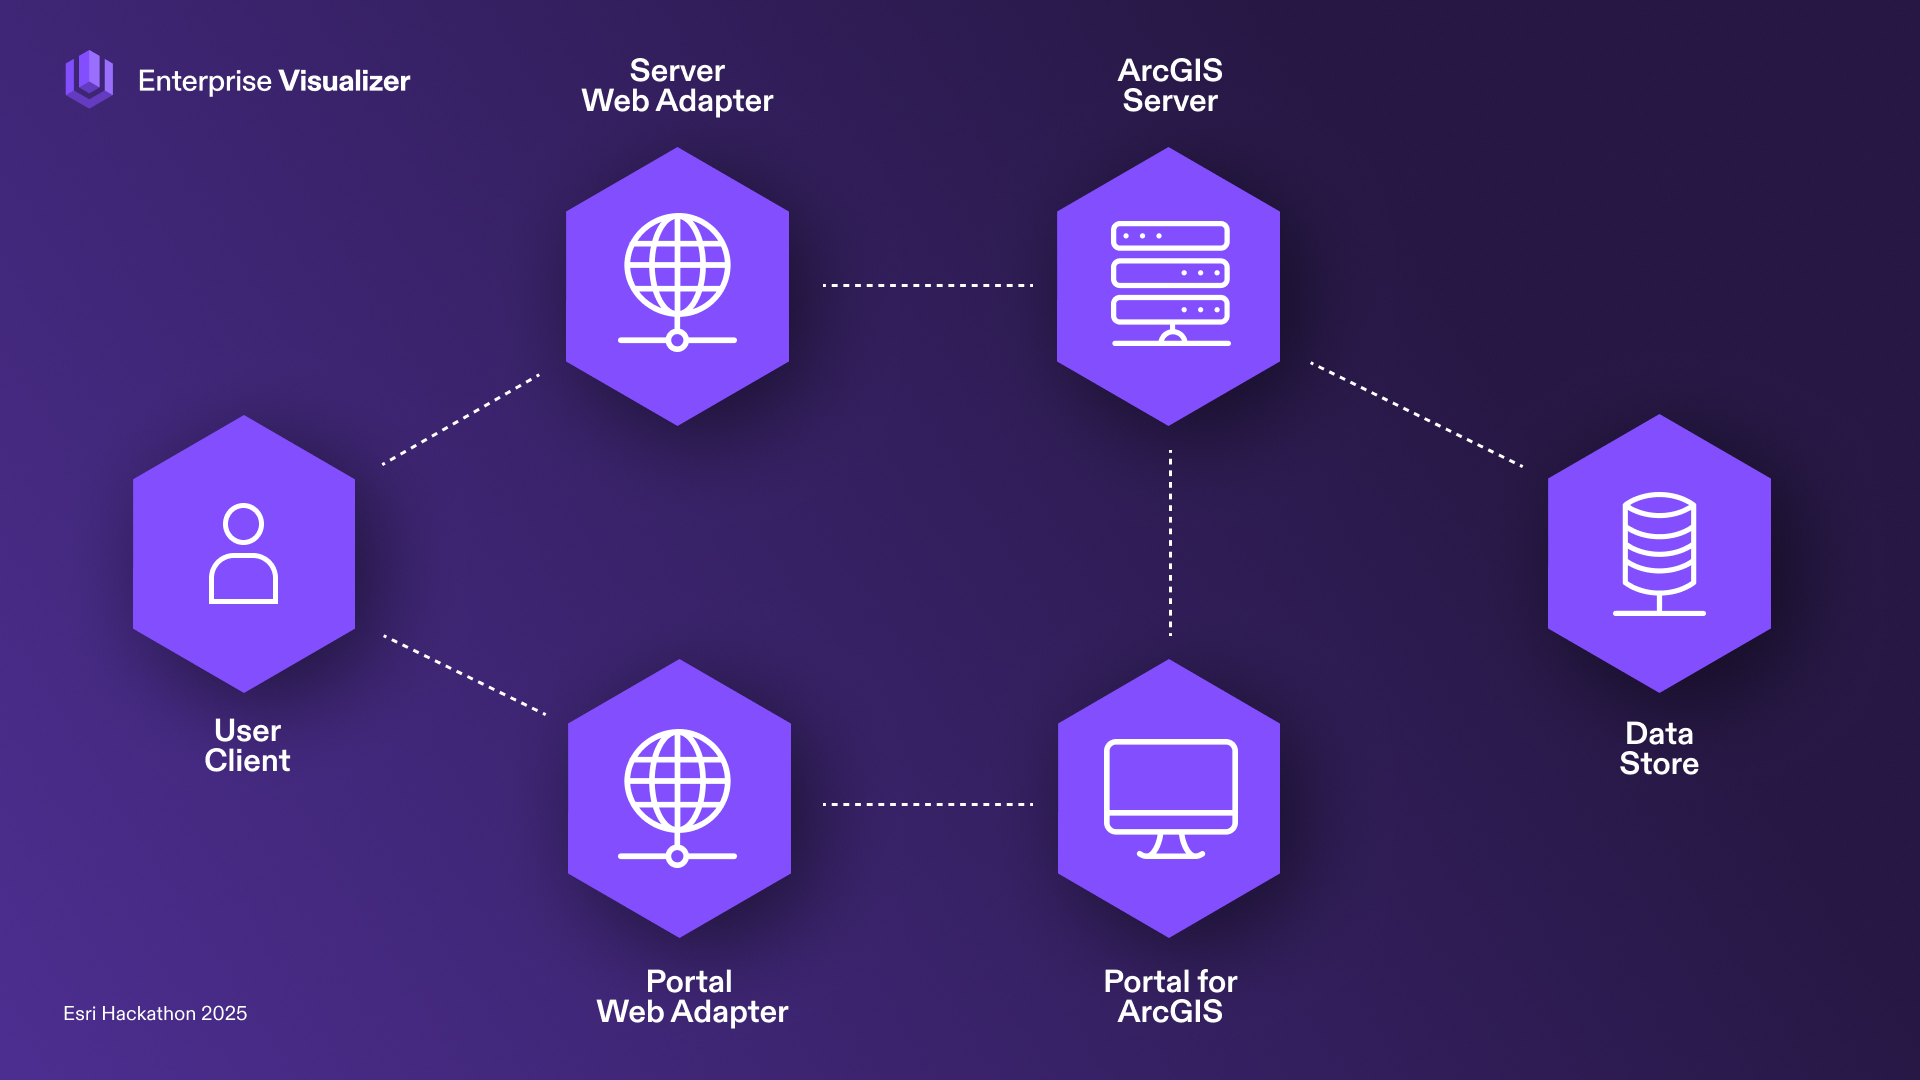
We developed a backend app using node.js with Express.js framework as an abstract singleton to monitor components' status and the connection status between them. And expose APIs from this structure and secure connection with ArcGIS OAuth authentication. The components contained are, Portal for ArcGIS, ArcGIS Server, Web Adaptors for both Portal and Server, and Data Stores. Then we developed the frontend app using Node.js and React framework to query information from the backend APIs. Plus we trained a RAG model as a chatbot for users to understand the problems deeper and thoroughly. The training datasets include Esri documentations, public Internet resources, and the error messages we collected.
Challenges we ran into
A full-stack web-application takes a lot time in integration debugging. We had a lot of issues when testing End-To-End featurees.
##Accomplishments that we're proud of
- ArcGIS EV is something that Esri customers really need, we solved a real-world problem.
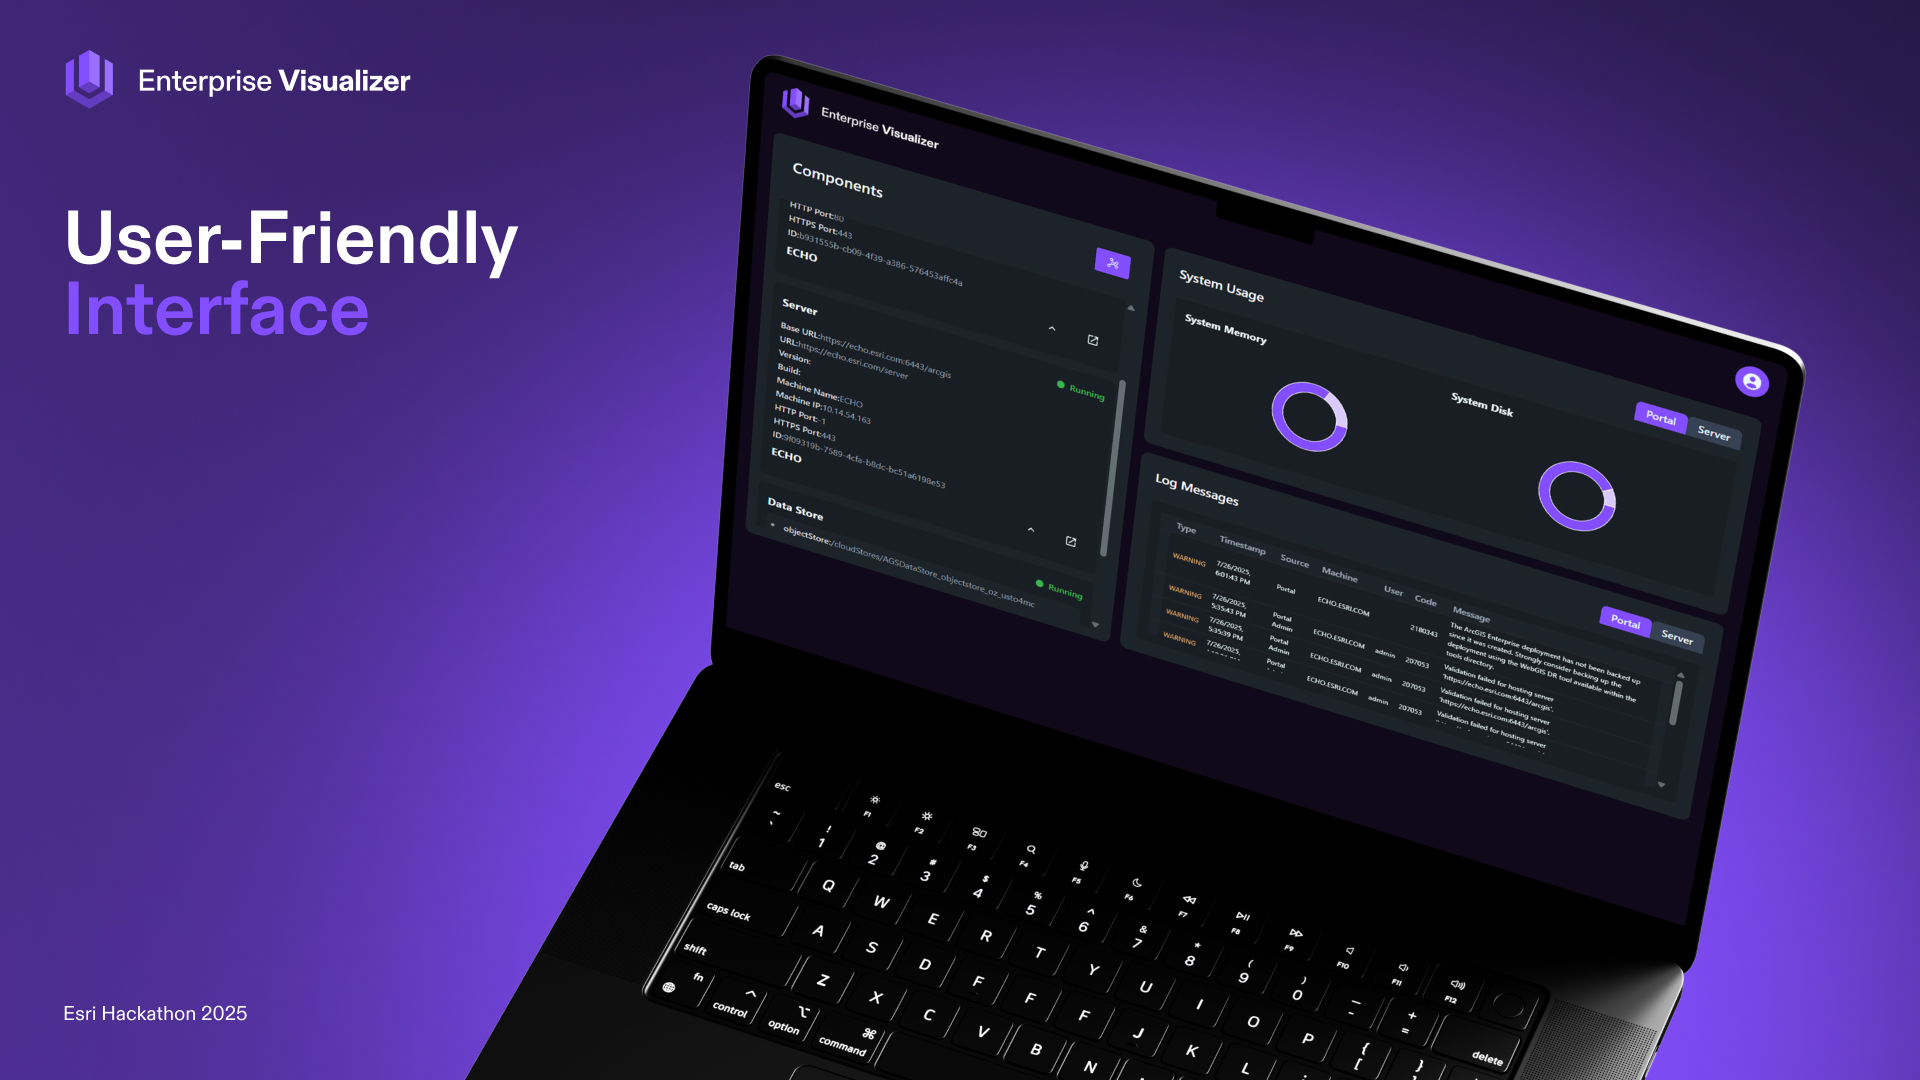
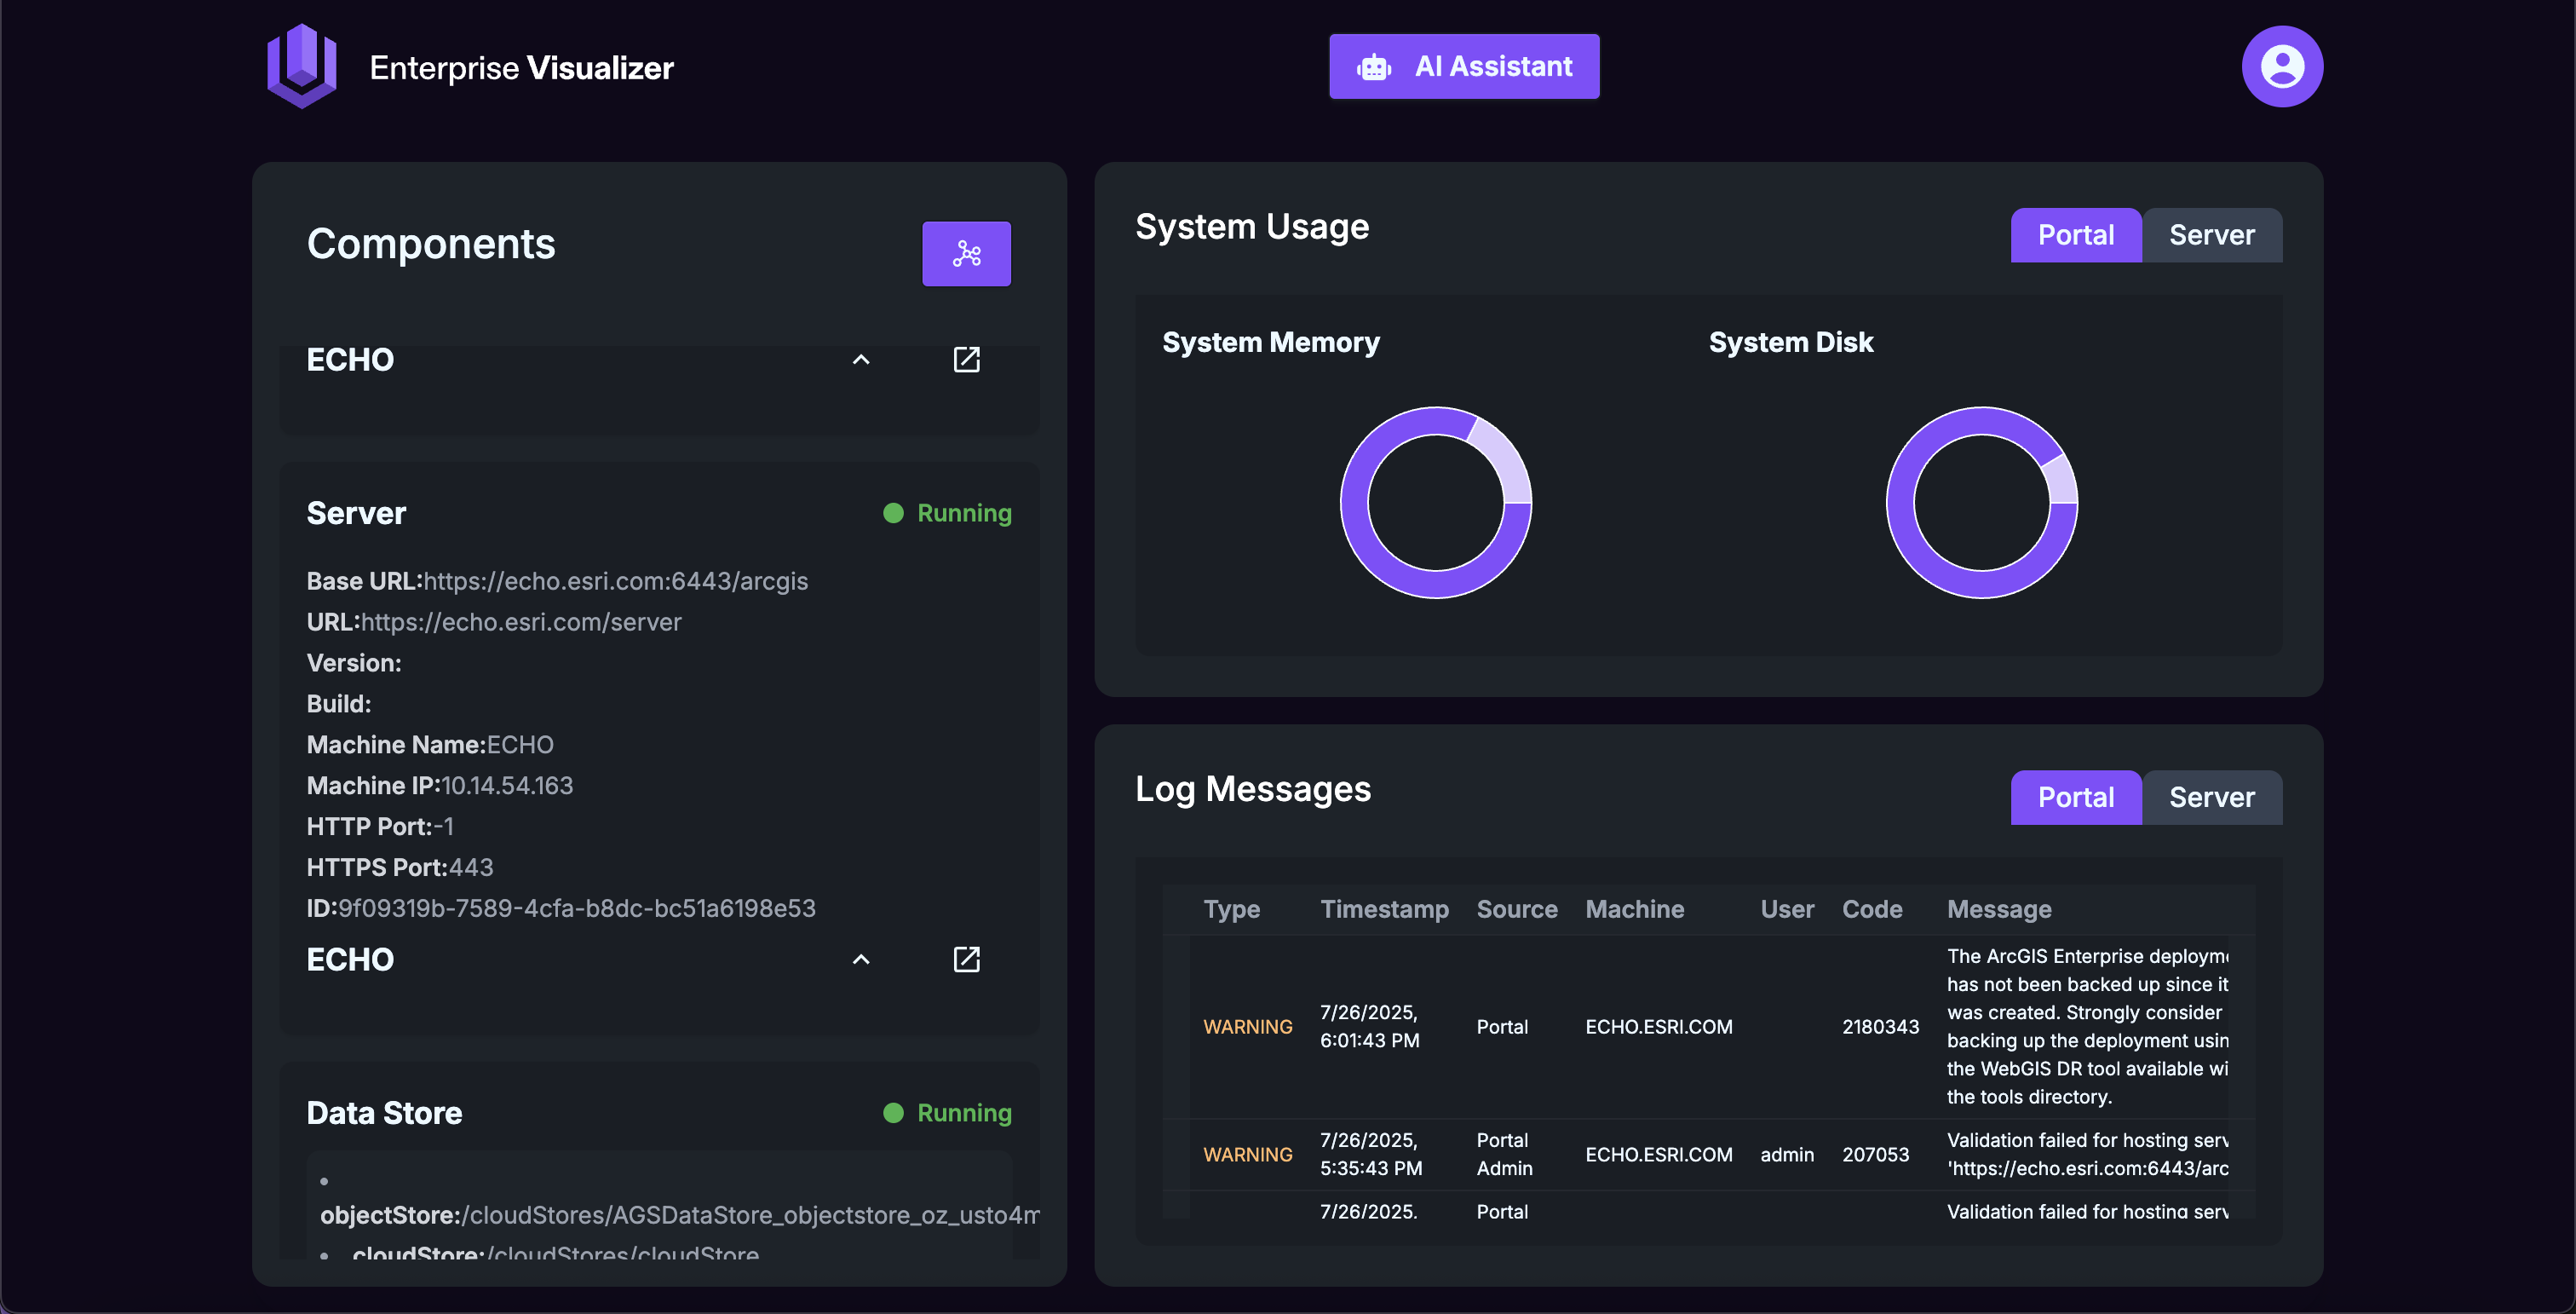
- The completeness of this project is high during hackathon, there is no mock-up features. Every frontend widgets' status and data come from backend from real-time Enterprise status.
- The chatbot we embedded in problem-solving can provide useful insights and solutions that traditional approaches cannot.
What we learned
Teamwork. Full-stack design, dev, testing, and debugging.
What's next for ArcGIS Enterprise Visualizer (EV)
For now, it's more focused on specific problem debugging and managing (for example, rasterAnalytics service tools related on Image Server), we hope we can expand the scope to broader services in ArcGIS Enterprise.
Built With
- daisyui
- esri
- express.js
- node.js
- rag
- react
- tailwind
- vite
- yarn


Log in or sign up for Devpost to join the conversation.