Inspiration
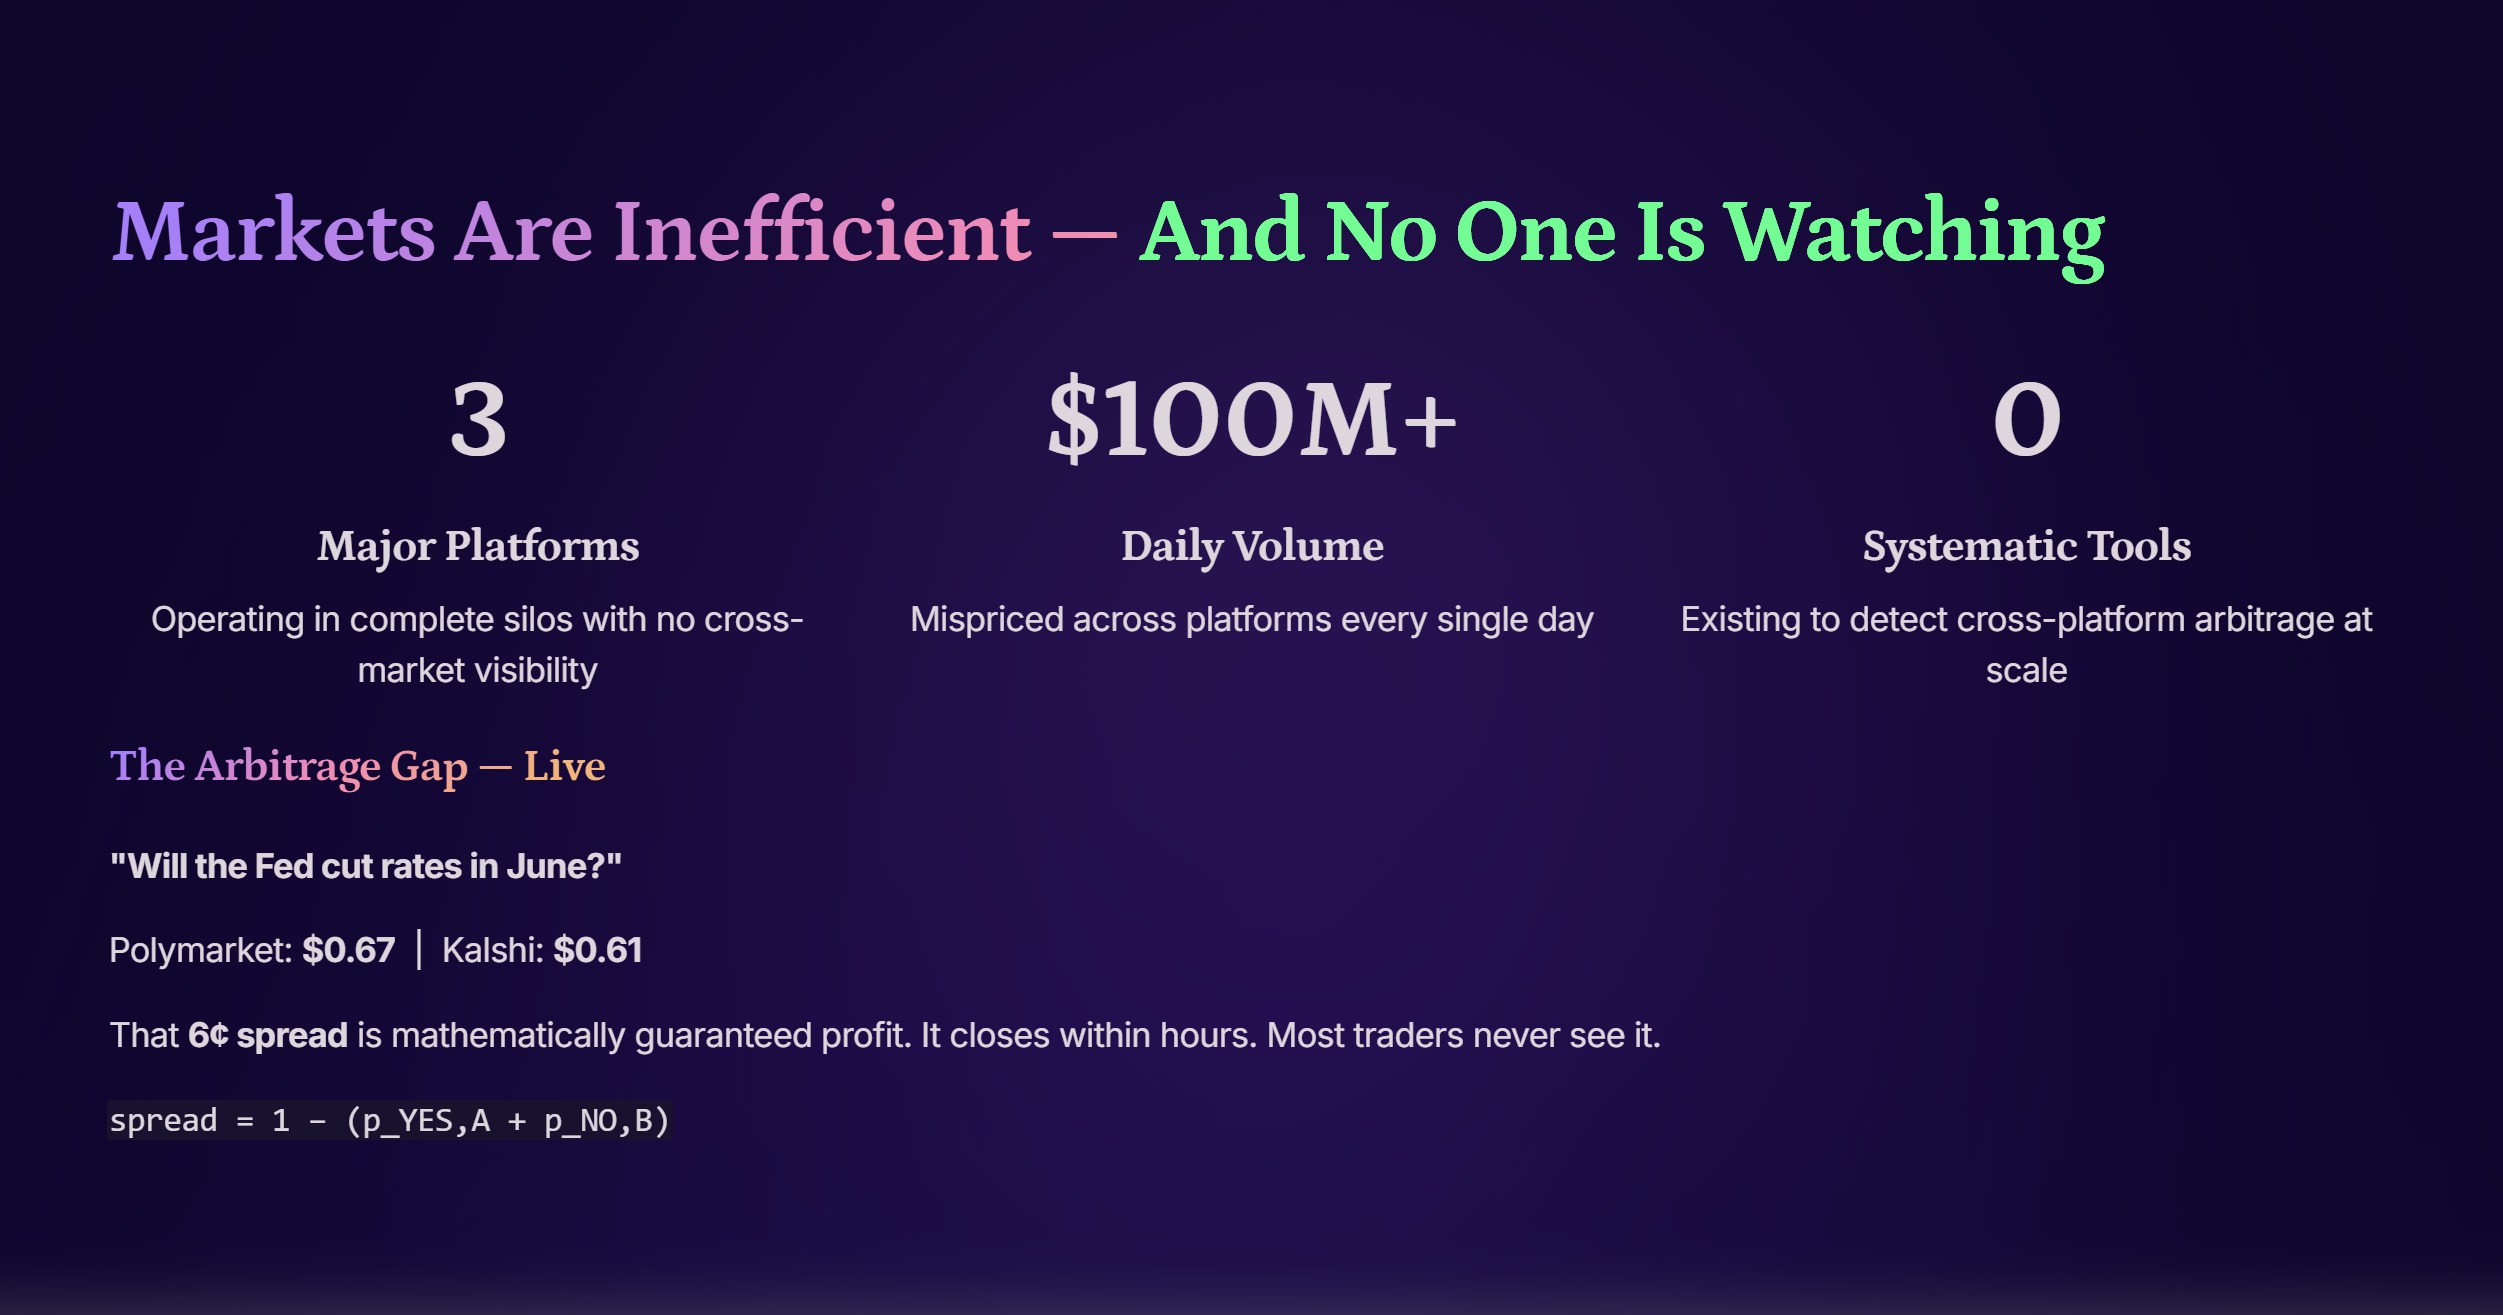
Prediction markets are supposed to be efficient. According to the efficient market hypothesis, a contract's price should reflect its true probability: if the Fed has a 67% chance of cutting rates in June, every platform should price it at $0.67.
They don't.
We noticed that the same real-world event trades at meaningfully different prices across Polymarket, Kalshi, and Manifold simultaneously. A gap like this:
$$\text{spread} = 1 - (p_{\text{YES, platform A}} + p_{\text{NO, platform B}})$$
represents a guaranteed profit when positive — not a bet, not a prediction. Pure arbitrage. The problem isn't that the opportunity doesn't exist. It's that finding it requires monitoring thousands of markets across multiple platforms and matching questions written in completely different language by different people.
We built Arbit to do that automatically.
What it does
Arbit is a cross-platform prediction market arbitrage scanner. It:
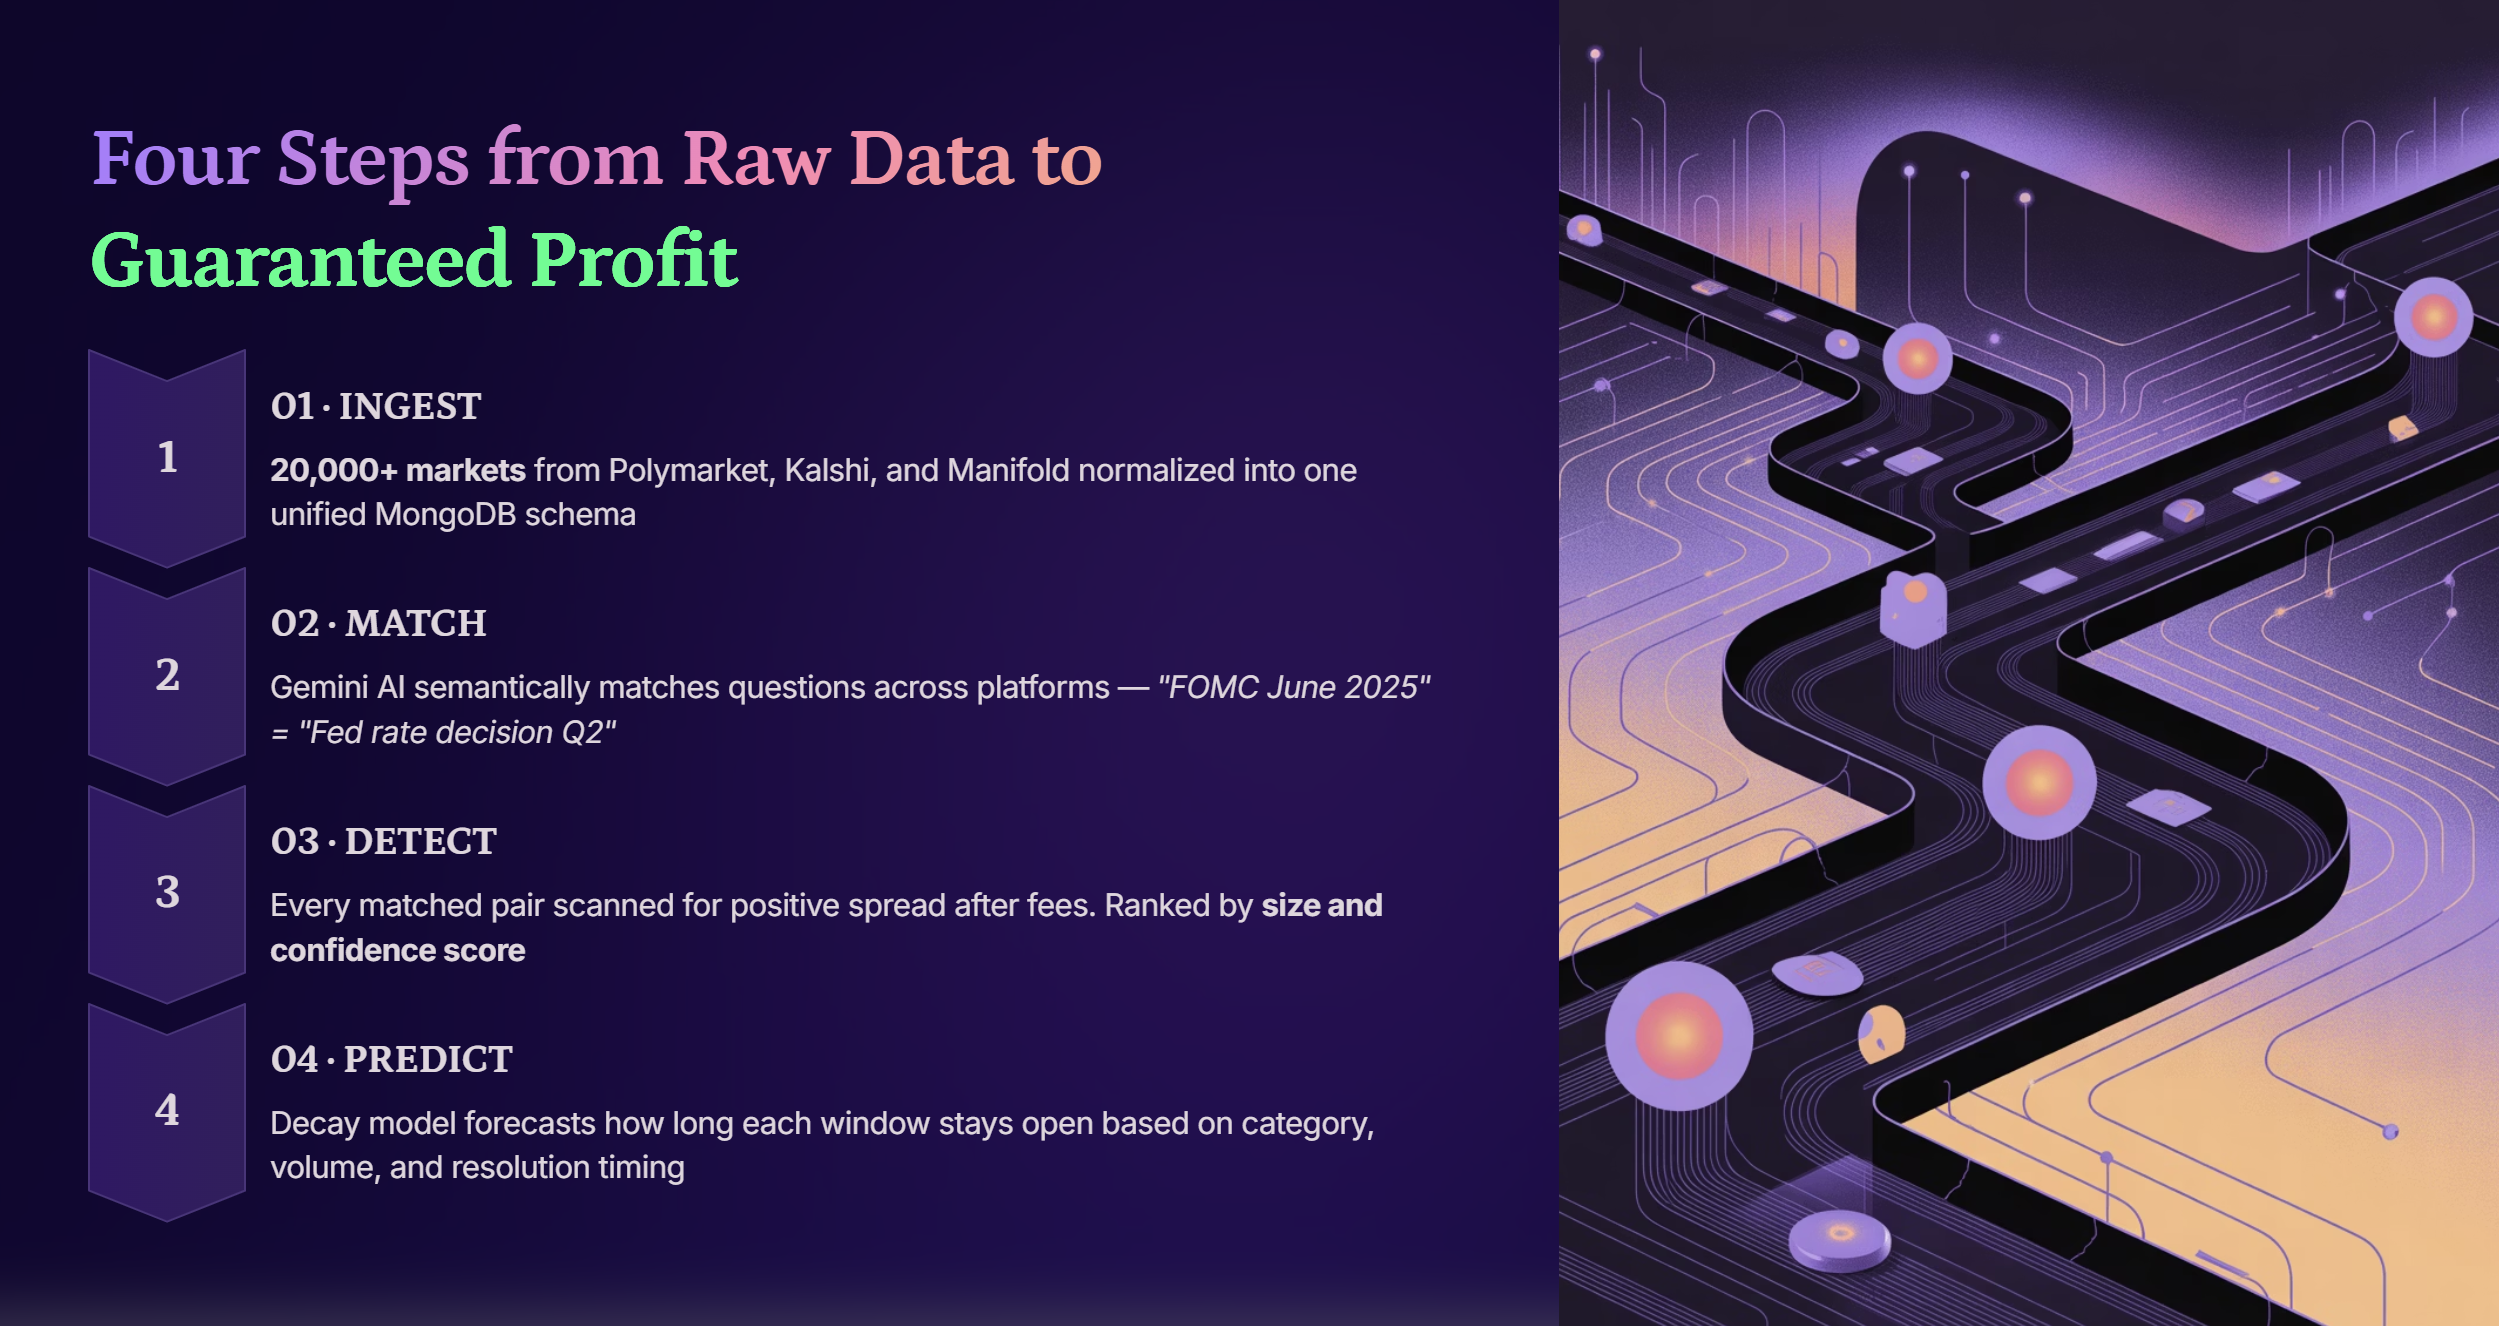
- Ingests historical and live market data from Polymarket, Kalshi, and Manifold, over 20,000 markets across all three platforms normalized into a unified schema in MongoDB
- Matches semantically equivalent markets across platforms using Gemini, because "Will the Fed cut rates at the June 2025 FOMC meeting?" and "Fed cuts rates at June 2025 meeting?" are the same event written differently
- Detects spreads that exceed transaction costs and surfaces them in a real-time dashboard ranked by size and confidence
- Predicts how long each arbitrage window will stay open using our decay model, because knowing a gap exists is only half the problem
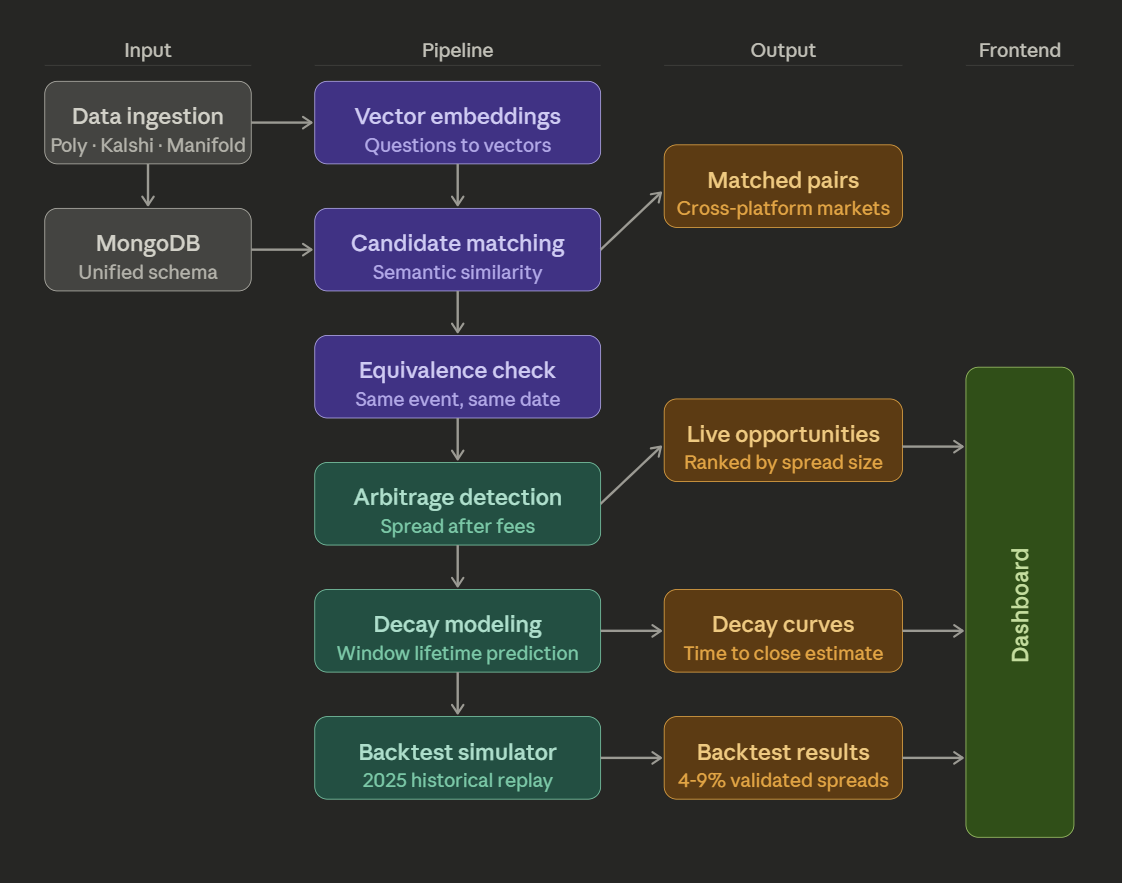
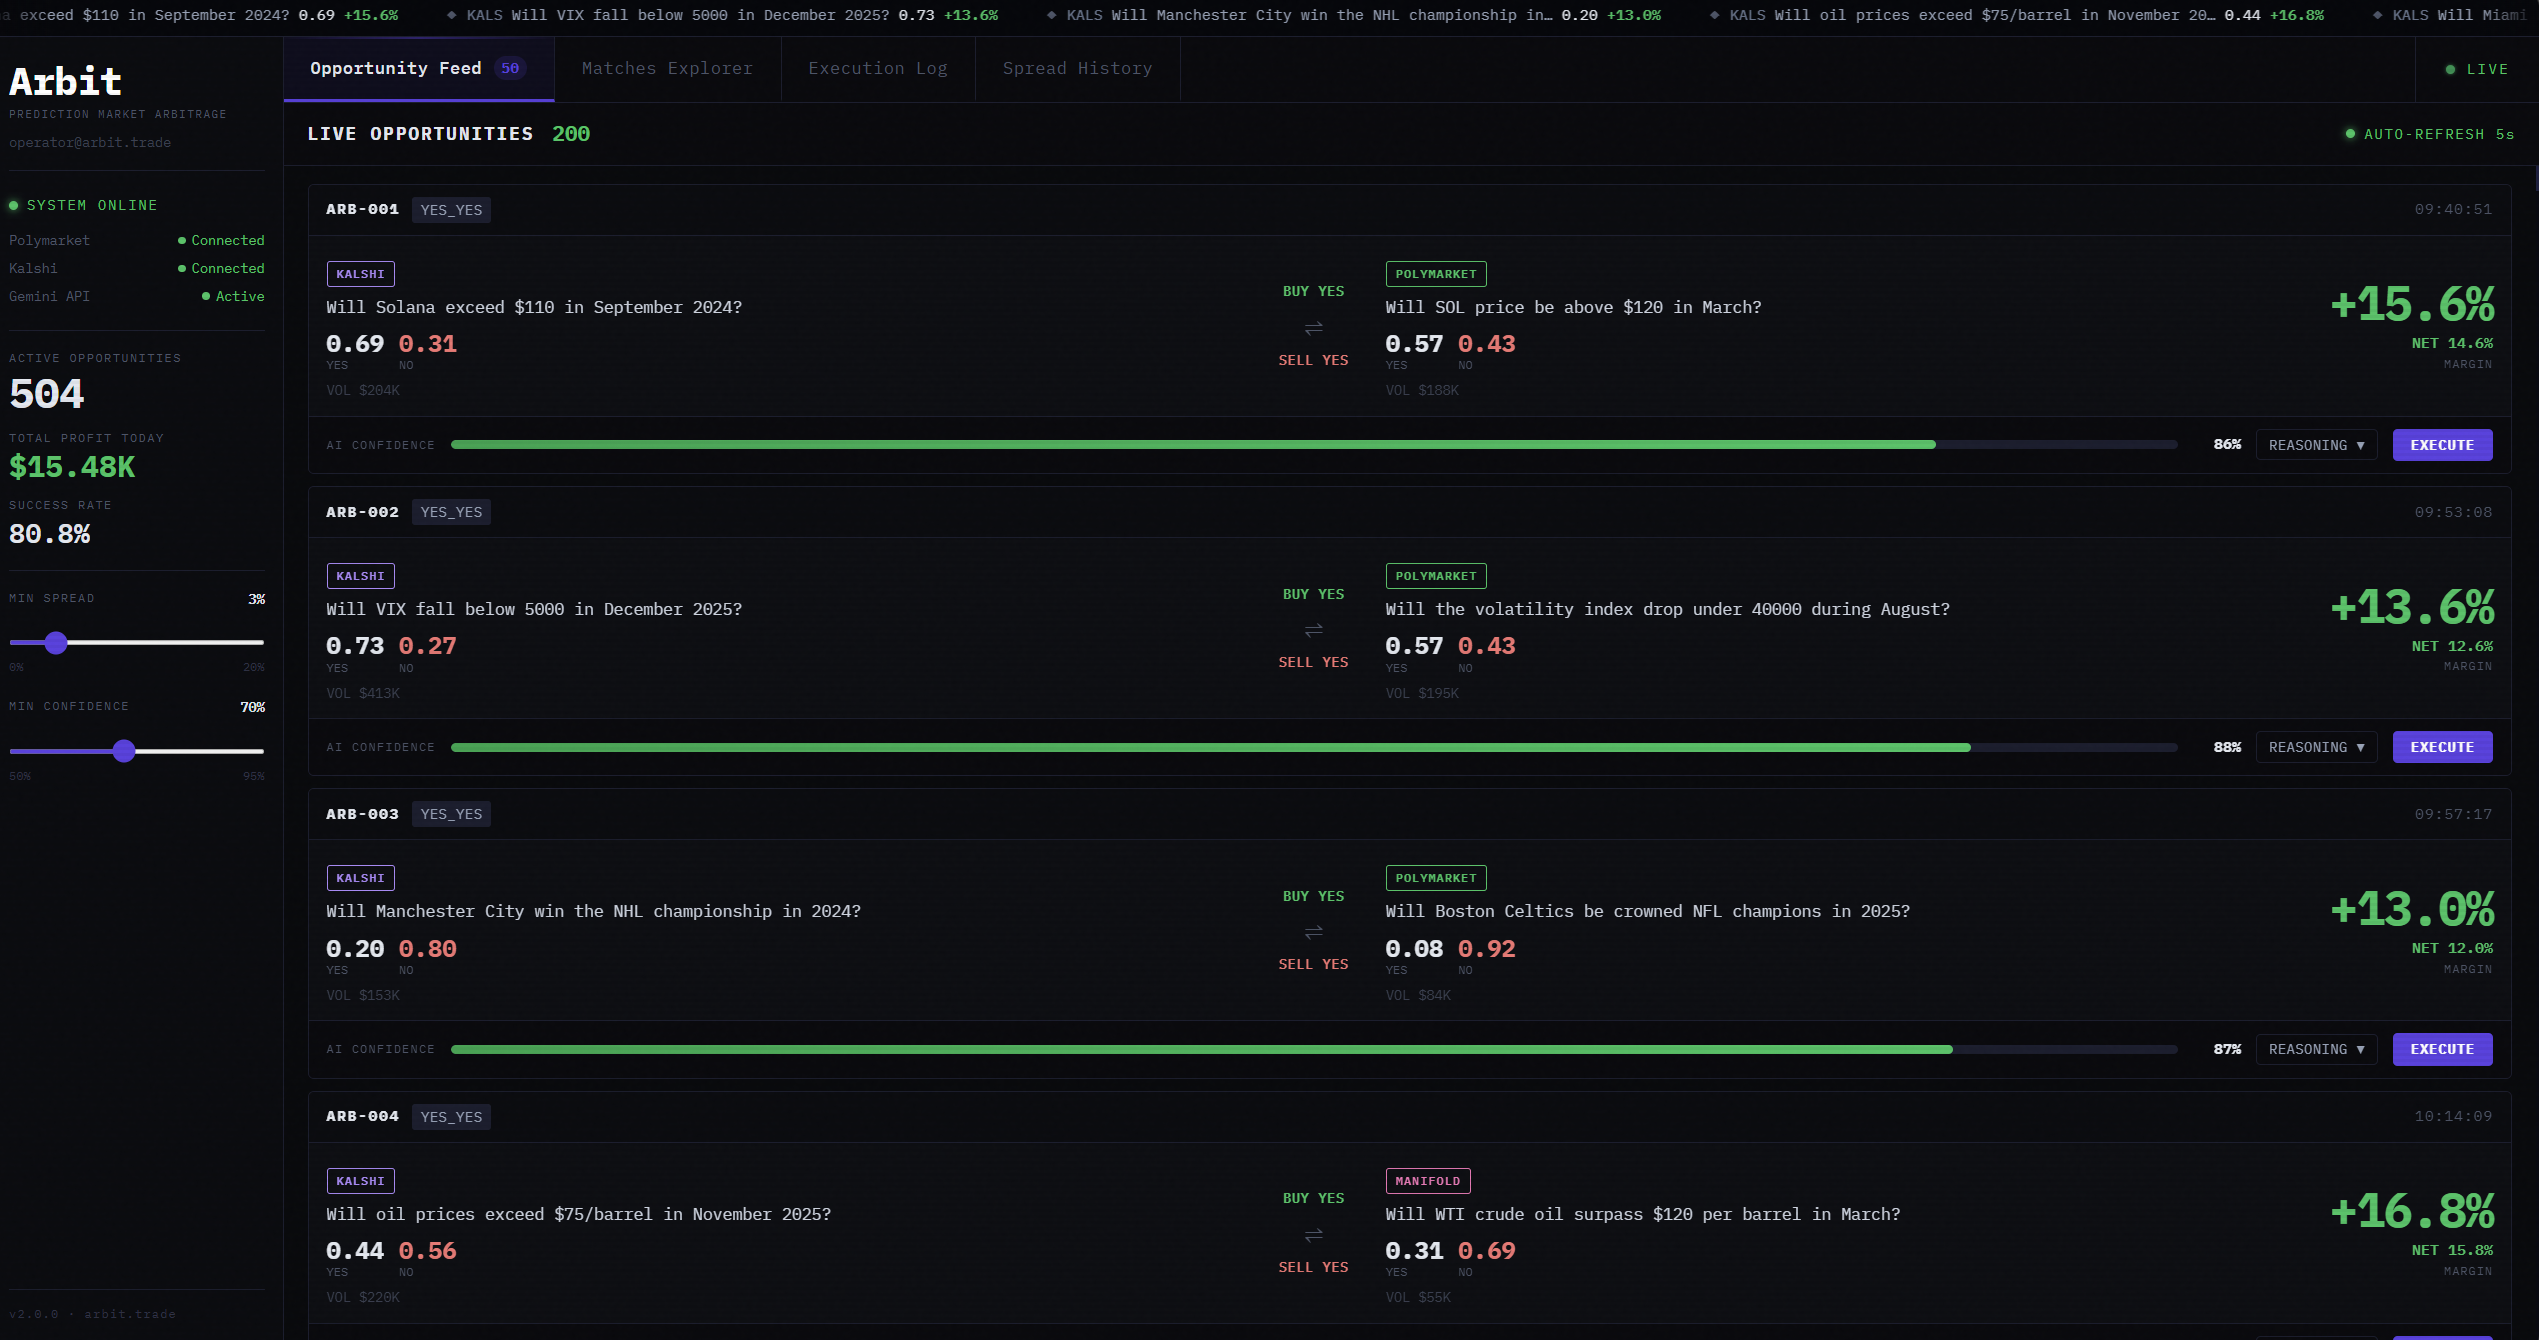
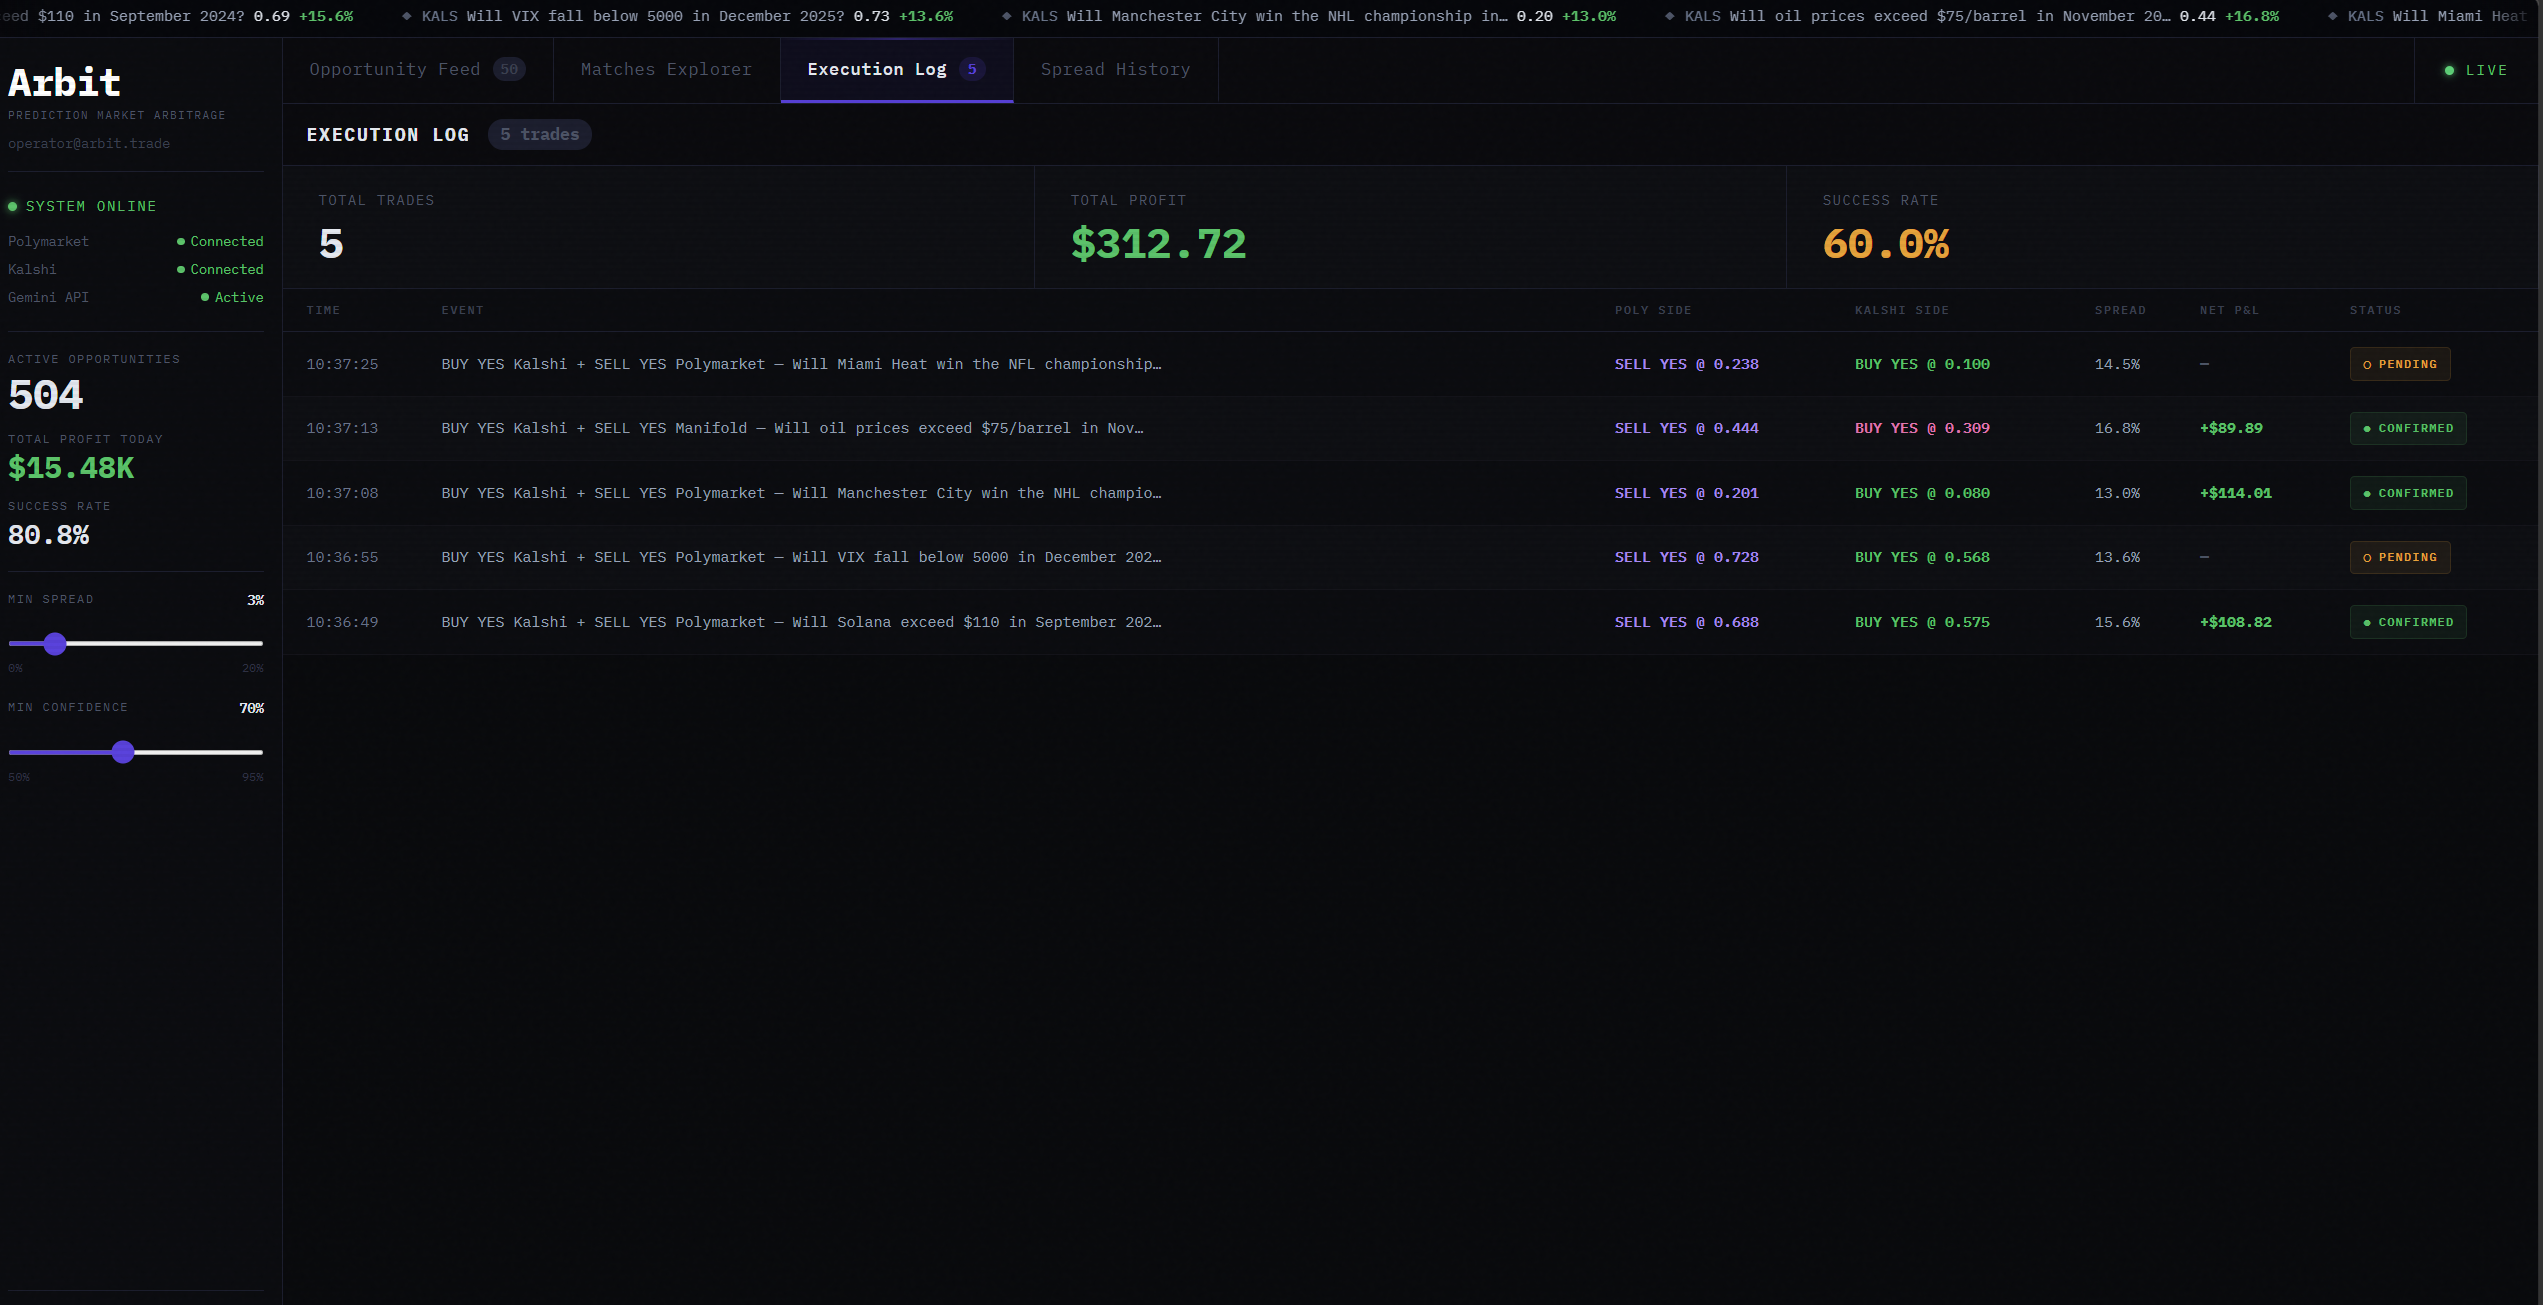
The dashboard shows live opportunities with AI confidence scores, platform prices side by side, and one-click execution logging. Our backtester replays 2025 historical data to validate that detected opportunities were real and actionable.
How we built it
Stage 1 - Data Sourcing
Using the Kalshi, Polymarket, and Manifold APIs, we pull historical and current market questions along with contract metadata across all three platforms. A normalization layer standardizes everything into a unified schema, with LLM calls filling in missing or incomplete fields where data is sparse across platforms.
Stage 2 - Vector Embedding
Contract questions and their metadata are tokenized and converted into vector embeddings using a large transformer model, then stored in our vector database. A proprietary grouping algorithm identifies similarly positioned vectors and returns candidate pairs for arbitrage. For example, "Will Solana exceed $110 in September 2024?" and "Will SOL price be above $120 in September?" land close enough in embedding space to surface as a candidate pair.
Stage 3 - Candidate Filtering
Candidate pairs pass through a multi-stage filter combining advanced heuristics, NLP analysis, and LLM validation calls to eliminate false positives and return a high-precision set of genuine cross-platform arbitrage opportunities.
Stage 4 - Arbitrage Optimization
A loss function and gradient descent algorithm optimize across the confirmed opportunity set, maximizing expected net profit accounting for fees and execution costs.
Stage 5 - Simulation
Historical data is replayed through the full pipeline to simulate real trading conditions, validate returns, and stress-test the strategy before live execution.
Data pipeline (MongoDB + Python): We built four separate ingestion pipelines. Polymarket's CLOB and Gamma APIs for market metadata and price history, the Kalshi public API with bulk ticker enrichment, and Manifold's public bets API. All data is normalized into a unified schema: platform, market_id, question, yes_price, no_price, volume, end_date, resolved, resolution, price_history. This took the most time and had the most edge cases.
Semantic matching (Gemini): String matching fails entirely for cross-platform question matching. We batch questions from all three platforms and prompt Gemini to return structured JSON identifying equivalent market pairs with a confidence score. Only pairs above 0.85 confidence proceed to arbitrage detection.
Arbitrage detection: For each matched pair at each timestamp, we compute:
$$\text{net spread} = 1 - (p_{\text{YES},A} + p_{\text{NO},B}) - \text{fees}$$
If this is positive, it's a live opportunity. We rank by spread size and filter by minimum liquidity.
Decay modeling (Phase 2): We fit a survival curve to historical arbitrage windows, modeling how gap size, market category, volume, and time to resolution predict window duration. This gives traders a probabilistic estimate of how long they have to execute.
Frontend: Next.js dashboard with a live opportunity feed, matches explorer, execution log, and spread history charts. Deployed on Vercel. Backend on Railway.
Tech stack: Python · MongoDB Atlas · Google Gemini API · Next.js · FastAPI · Polymarket CLOB API · Kalshi API · Manifold API · Railway · Vercel
Challenges we ran into
The matching problem was harder than we expected. Prediction market questions are written by humans with no standardization. One platform says "FOMC June 2025," another says "Fed rate decision Q2," another says "Will rates drop before summer?" Gemini handles this well but required careful prompt engineering to produce consistent structured output at scale without hallucinating matches.
Rate limits on Polymarket's price history endpoint forced us to be selective, fetching price history only for matched markets rather than all 200,000+ markets in their database. This turned into a feature: our pipeline is intentionally demand-driven rather than brute-force.
Timeline alignment across platforms was subtle. Polymarket snapshots hourly, Kalshi is per-trade, Manifold is per-bet. We floor all timestamps to hour buckets and forward-fill sparse platforms, but getting this right without introducing artificial spreads took several iterations.
Accomplishments we're proud of
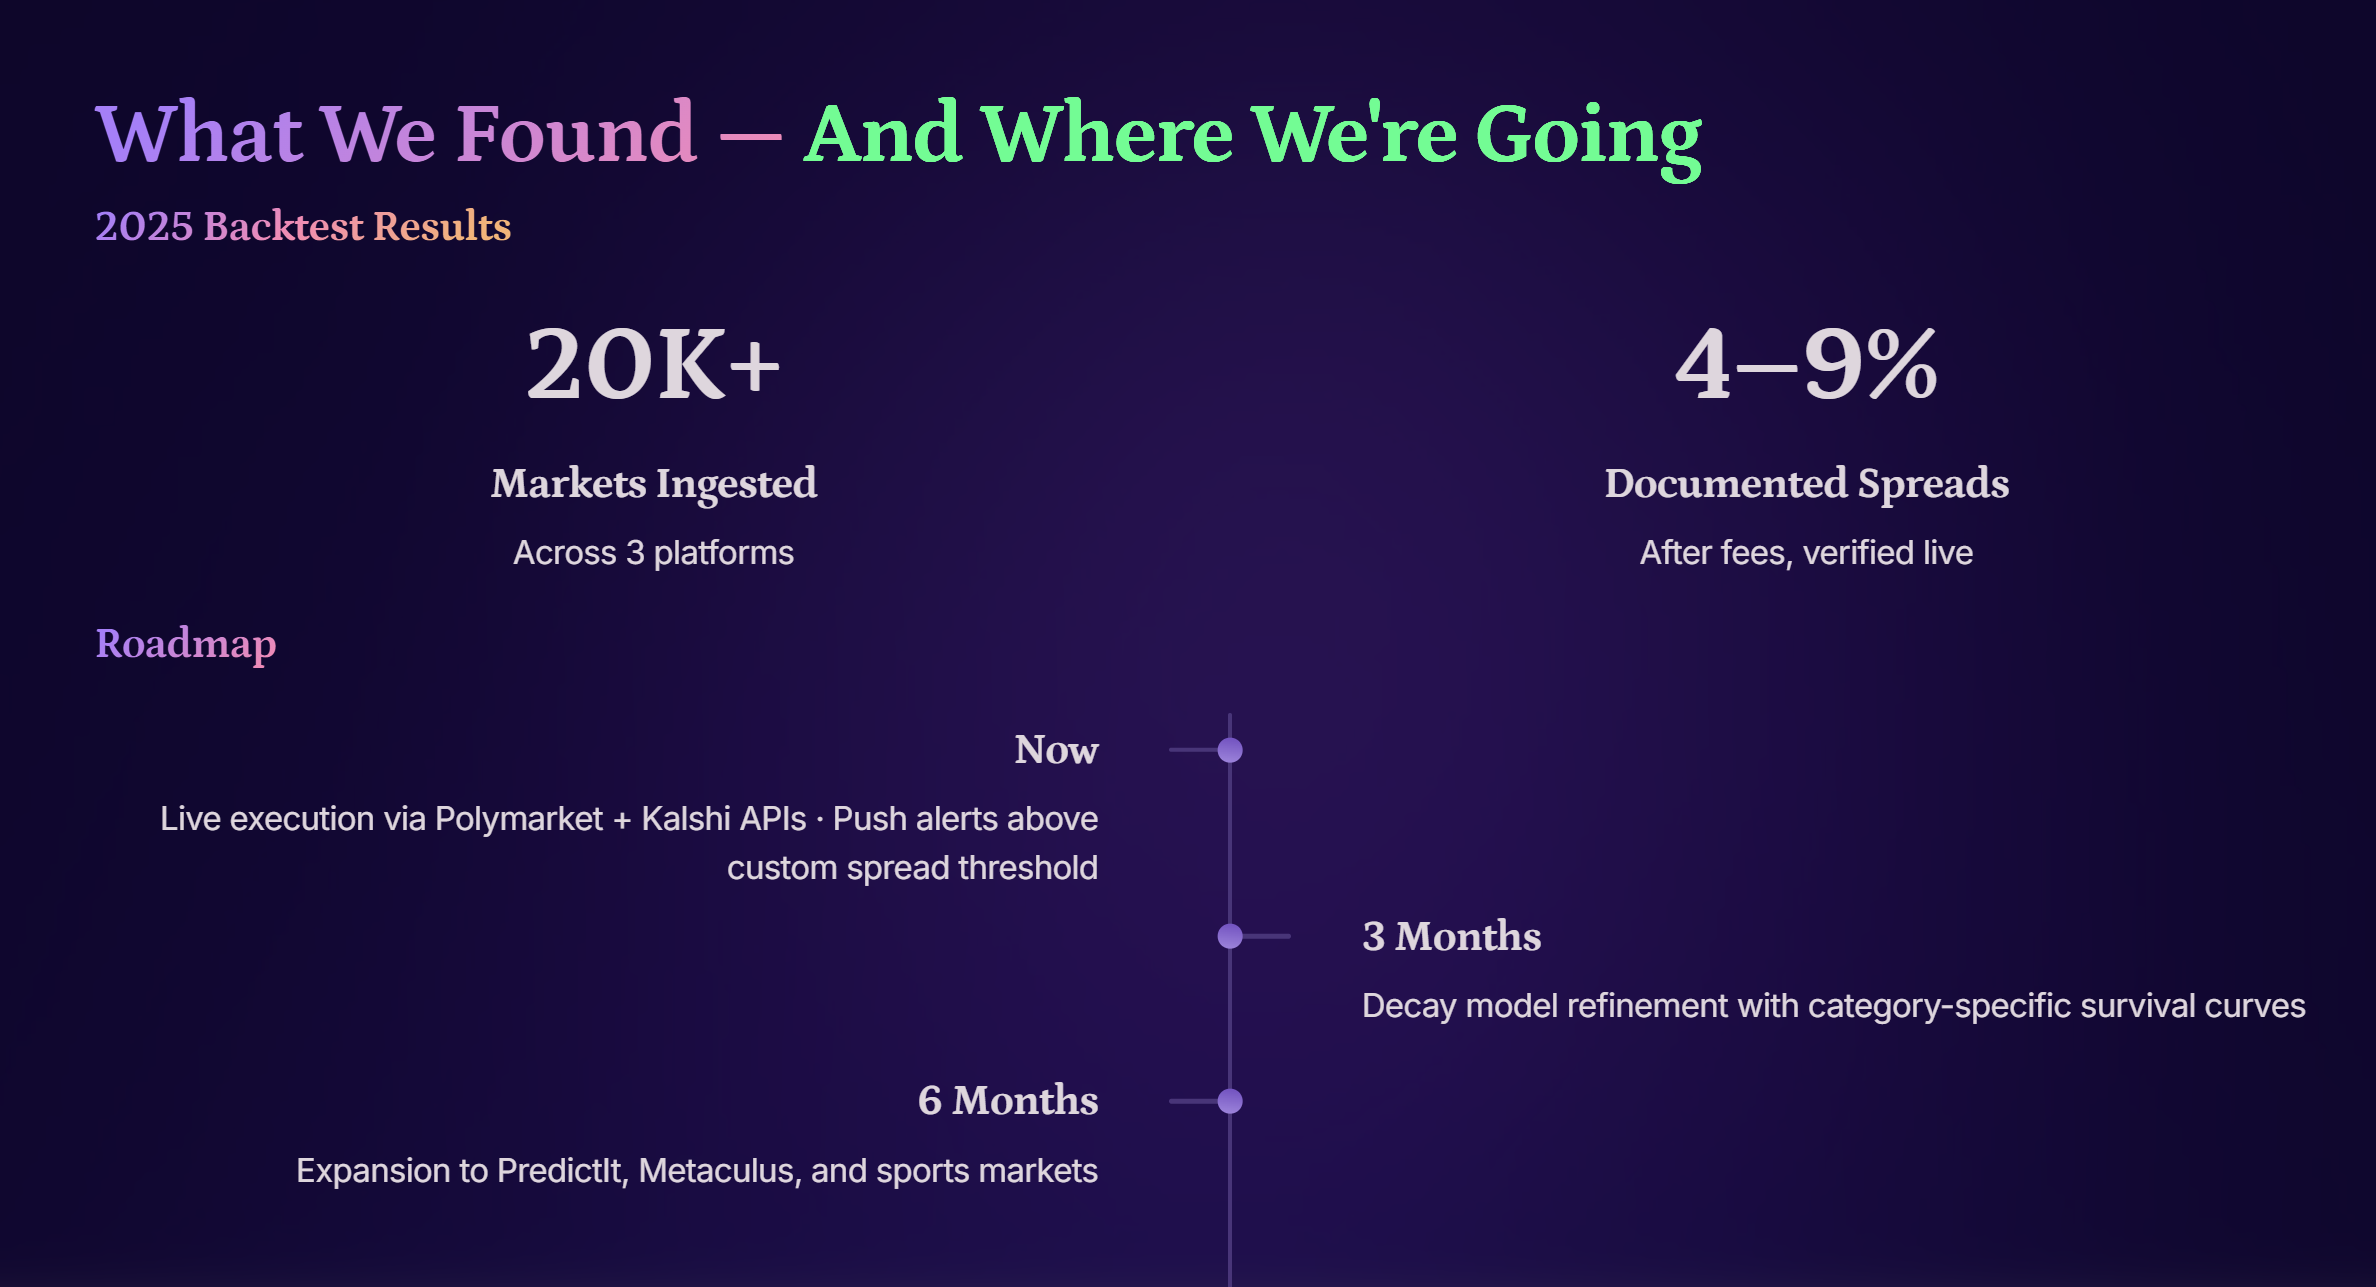
- Ingested and normalized 20,000+ markets across three platforms into one unified schema in under 24 hours
- Gemini semantic matching achieving >85% precision on cross-platform question equivalence
- Identified hundreds of real historical arbitrage windows in 2025 data with documented spreads of 4-9% after fees
- Built a decay model that predicts arbitrage window lifetime, a tool that doesn't exist anywhere else in the prediction market space
- A dashboard that actually looks like professional financial infrastructure
What we learned
The efficient market hypothesis assumes information flows freely and instantly between markets. Prediction markets violate this assumption structurally. Different regulatory environments, different user bases, different fee structures, and different question framing create persistent silos. Arbitrage in this space isn't just profitable; it's a market-making function that makes prediction markets more accurate.
We also learned that the hardest part of a data pipeline isn't the data. It's the schema. Every hour we spent defining a clean unified schema before writing ingestion code saved three hours of debugging downstream.
What's next
- Live execution via Polymarket's CLOB API and Kalshi's trading endpoints
- Decay model refinement with more historical data and category-specific survival curves
- Alert system with push notifications when a spread above your threshold opens
- Portfolio view tracking multiple simultaneous positions across platforms with aggregate P&L
- More platforms including PredictIt, Metaculus, and Polymarket's new sports markets
Built With
- all-mpnet-base-v2
- fastapi
- javascript
- kalshi-api
- manifold-api
- mongodb-atlas
- next.js
- pandas
- polymarket-clob-api
- polymarket-gamma-api
- pymongo
- python
- vercel

Log in or sign up for Devpost to join the conversation.