-
-

Landing Page
-

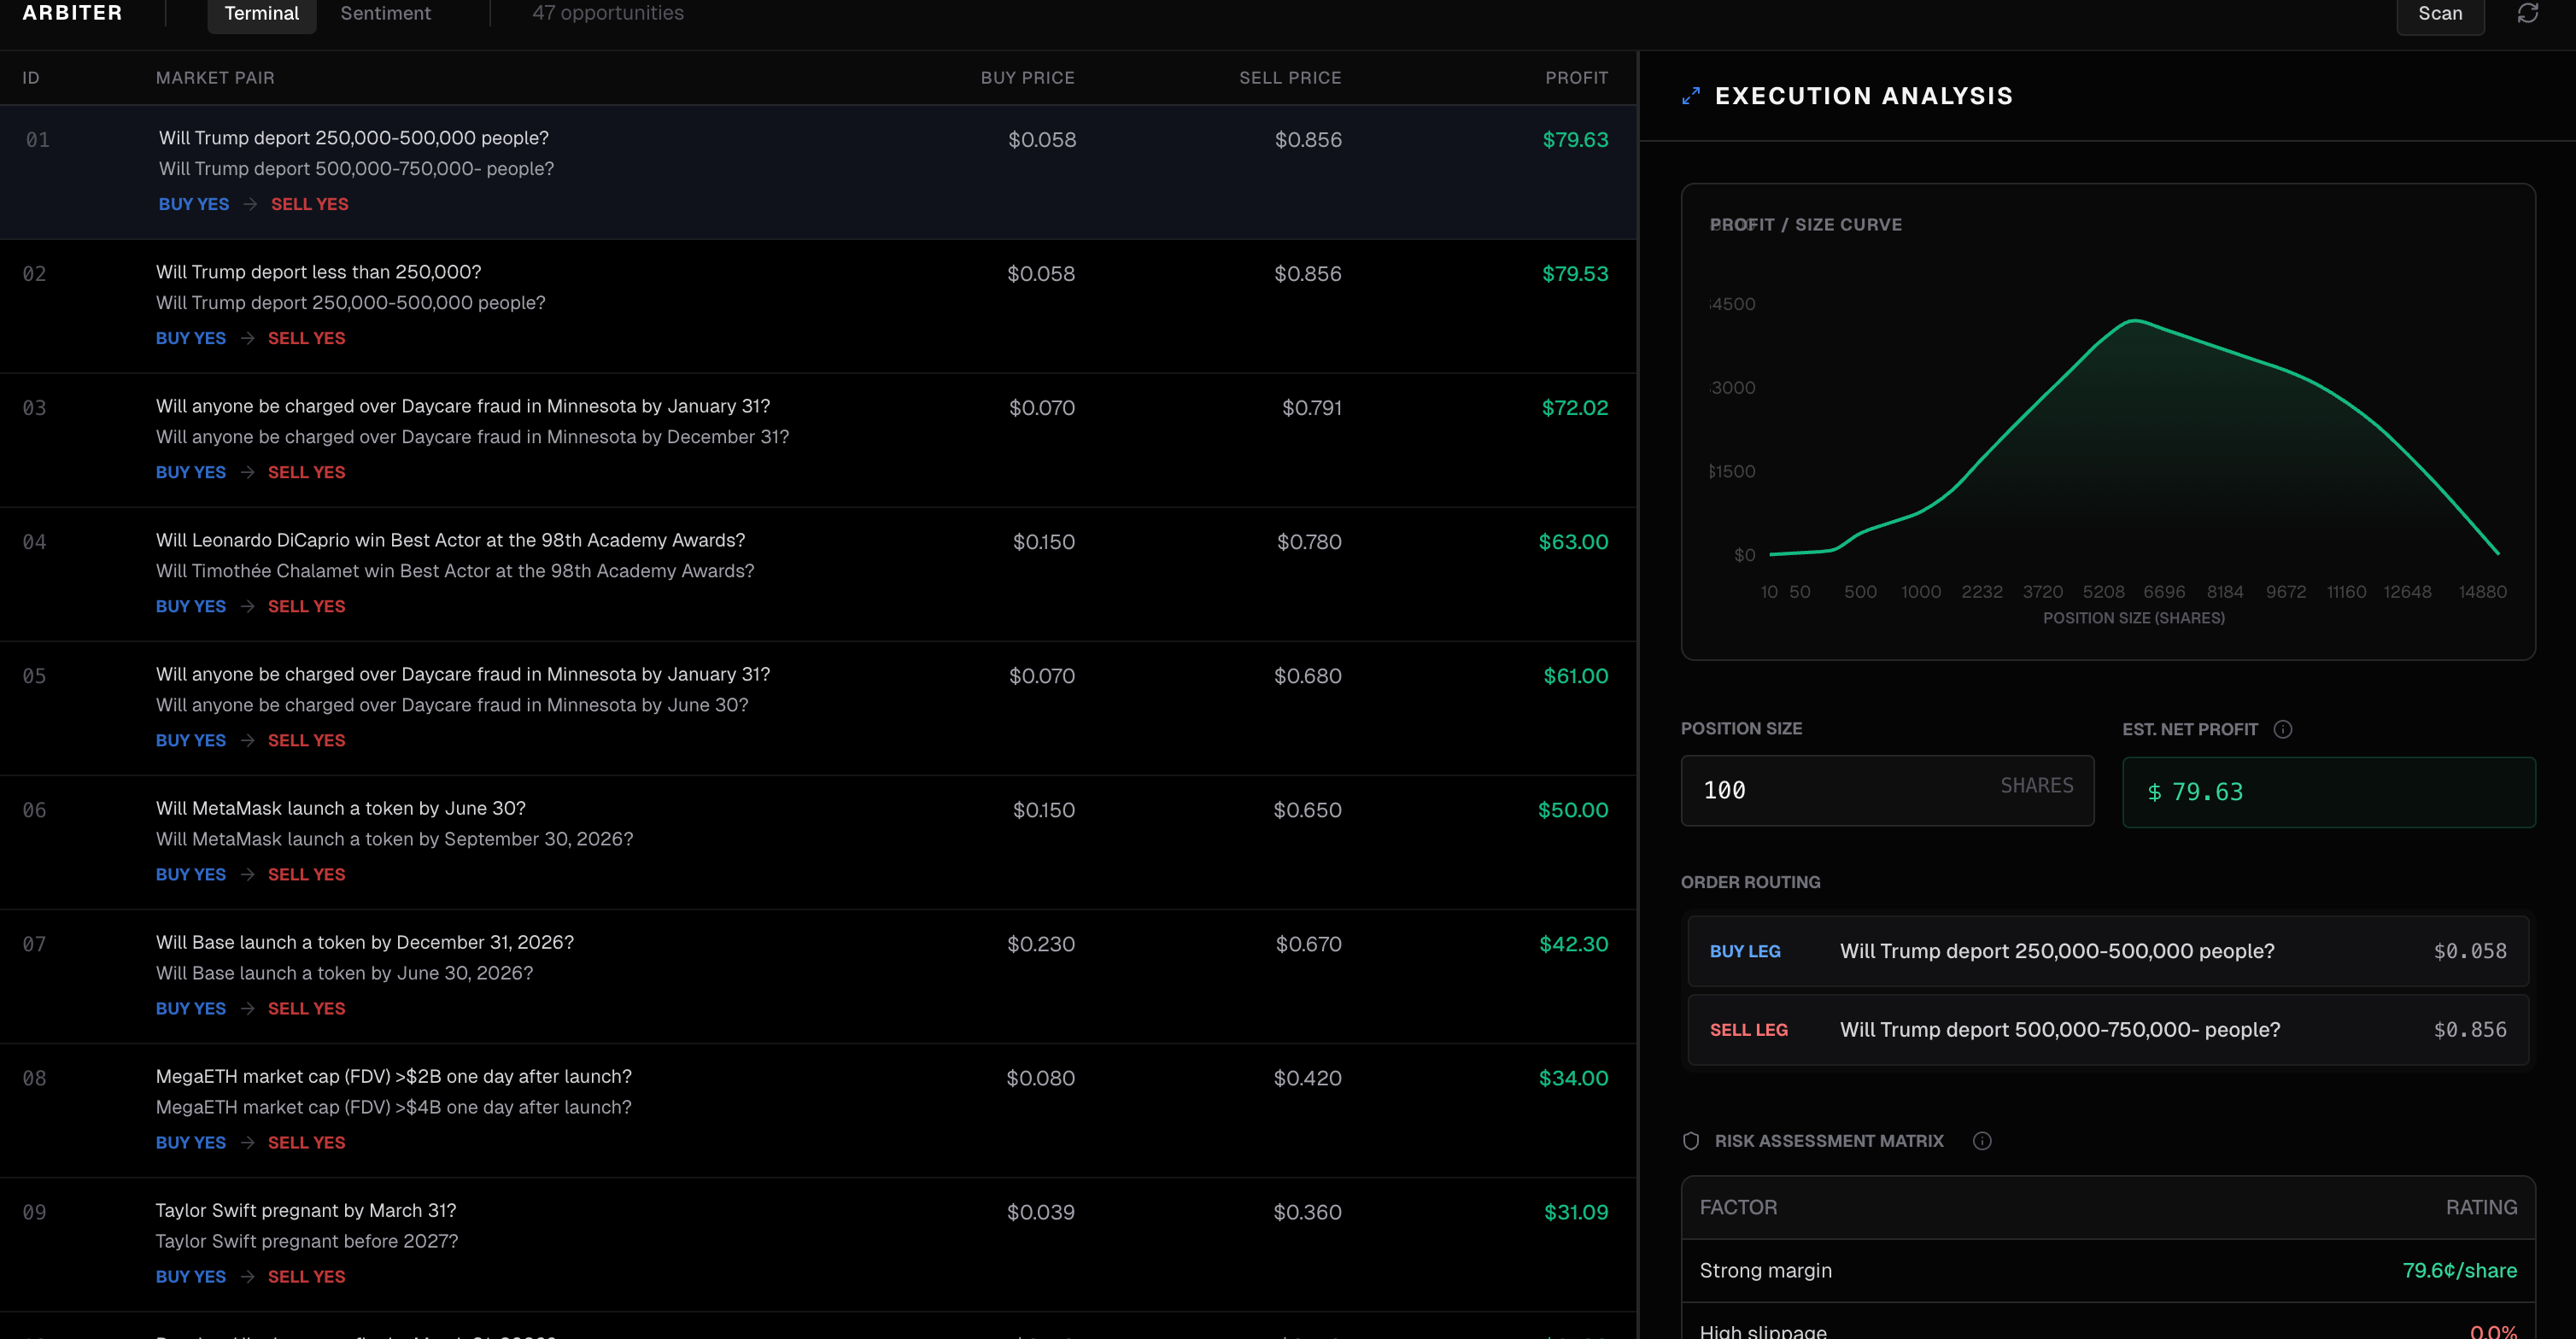
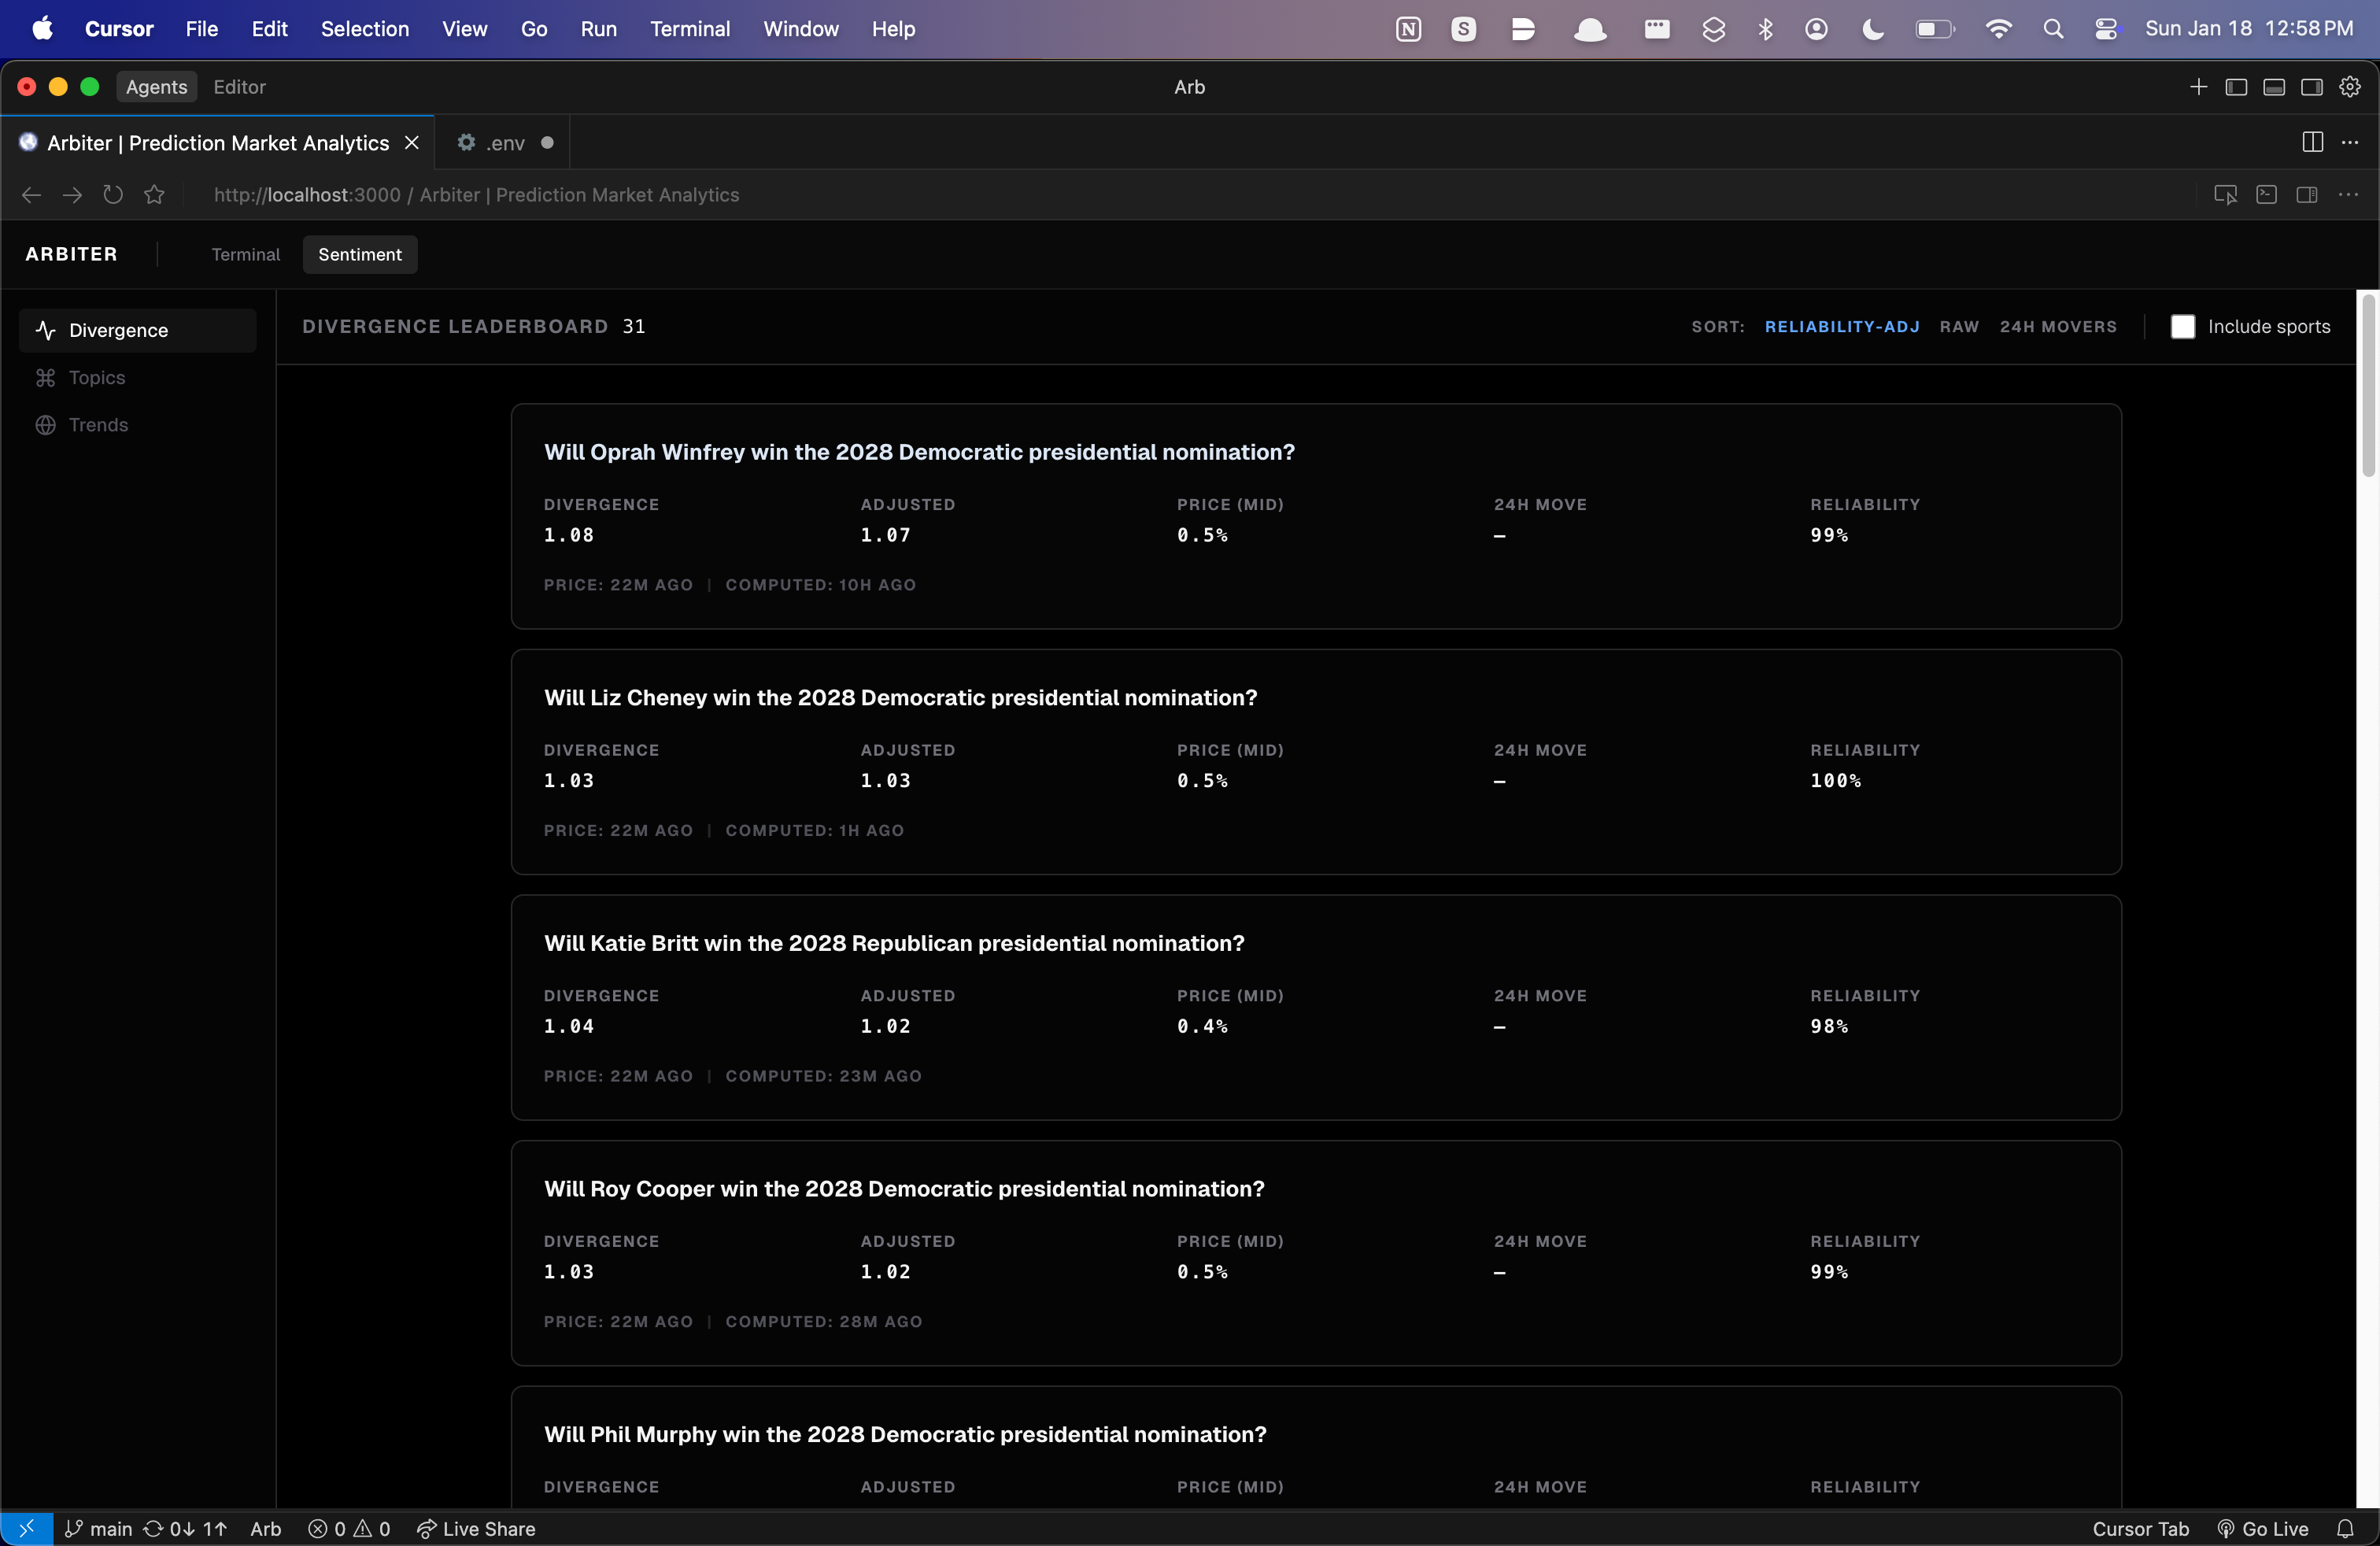
Dashboard
-
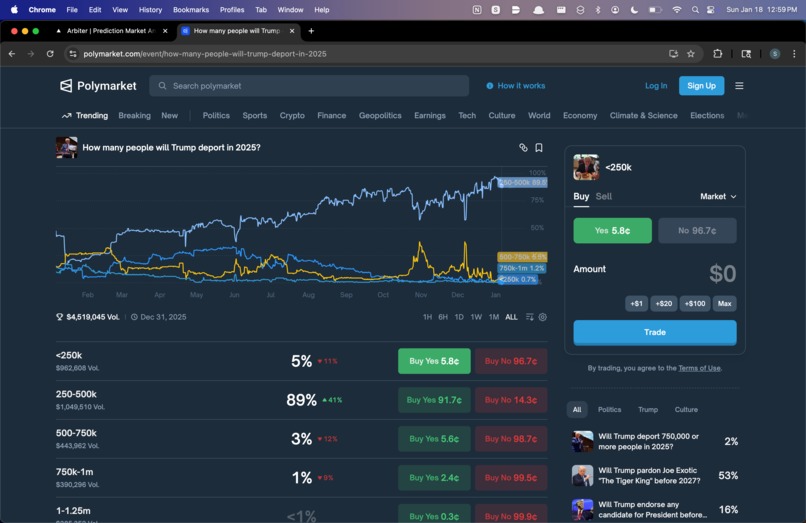
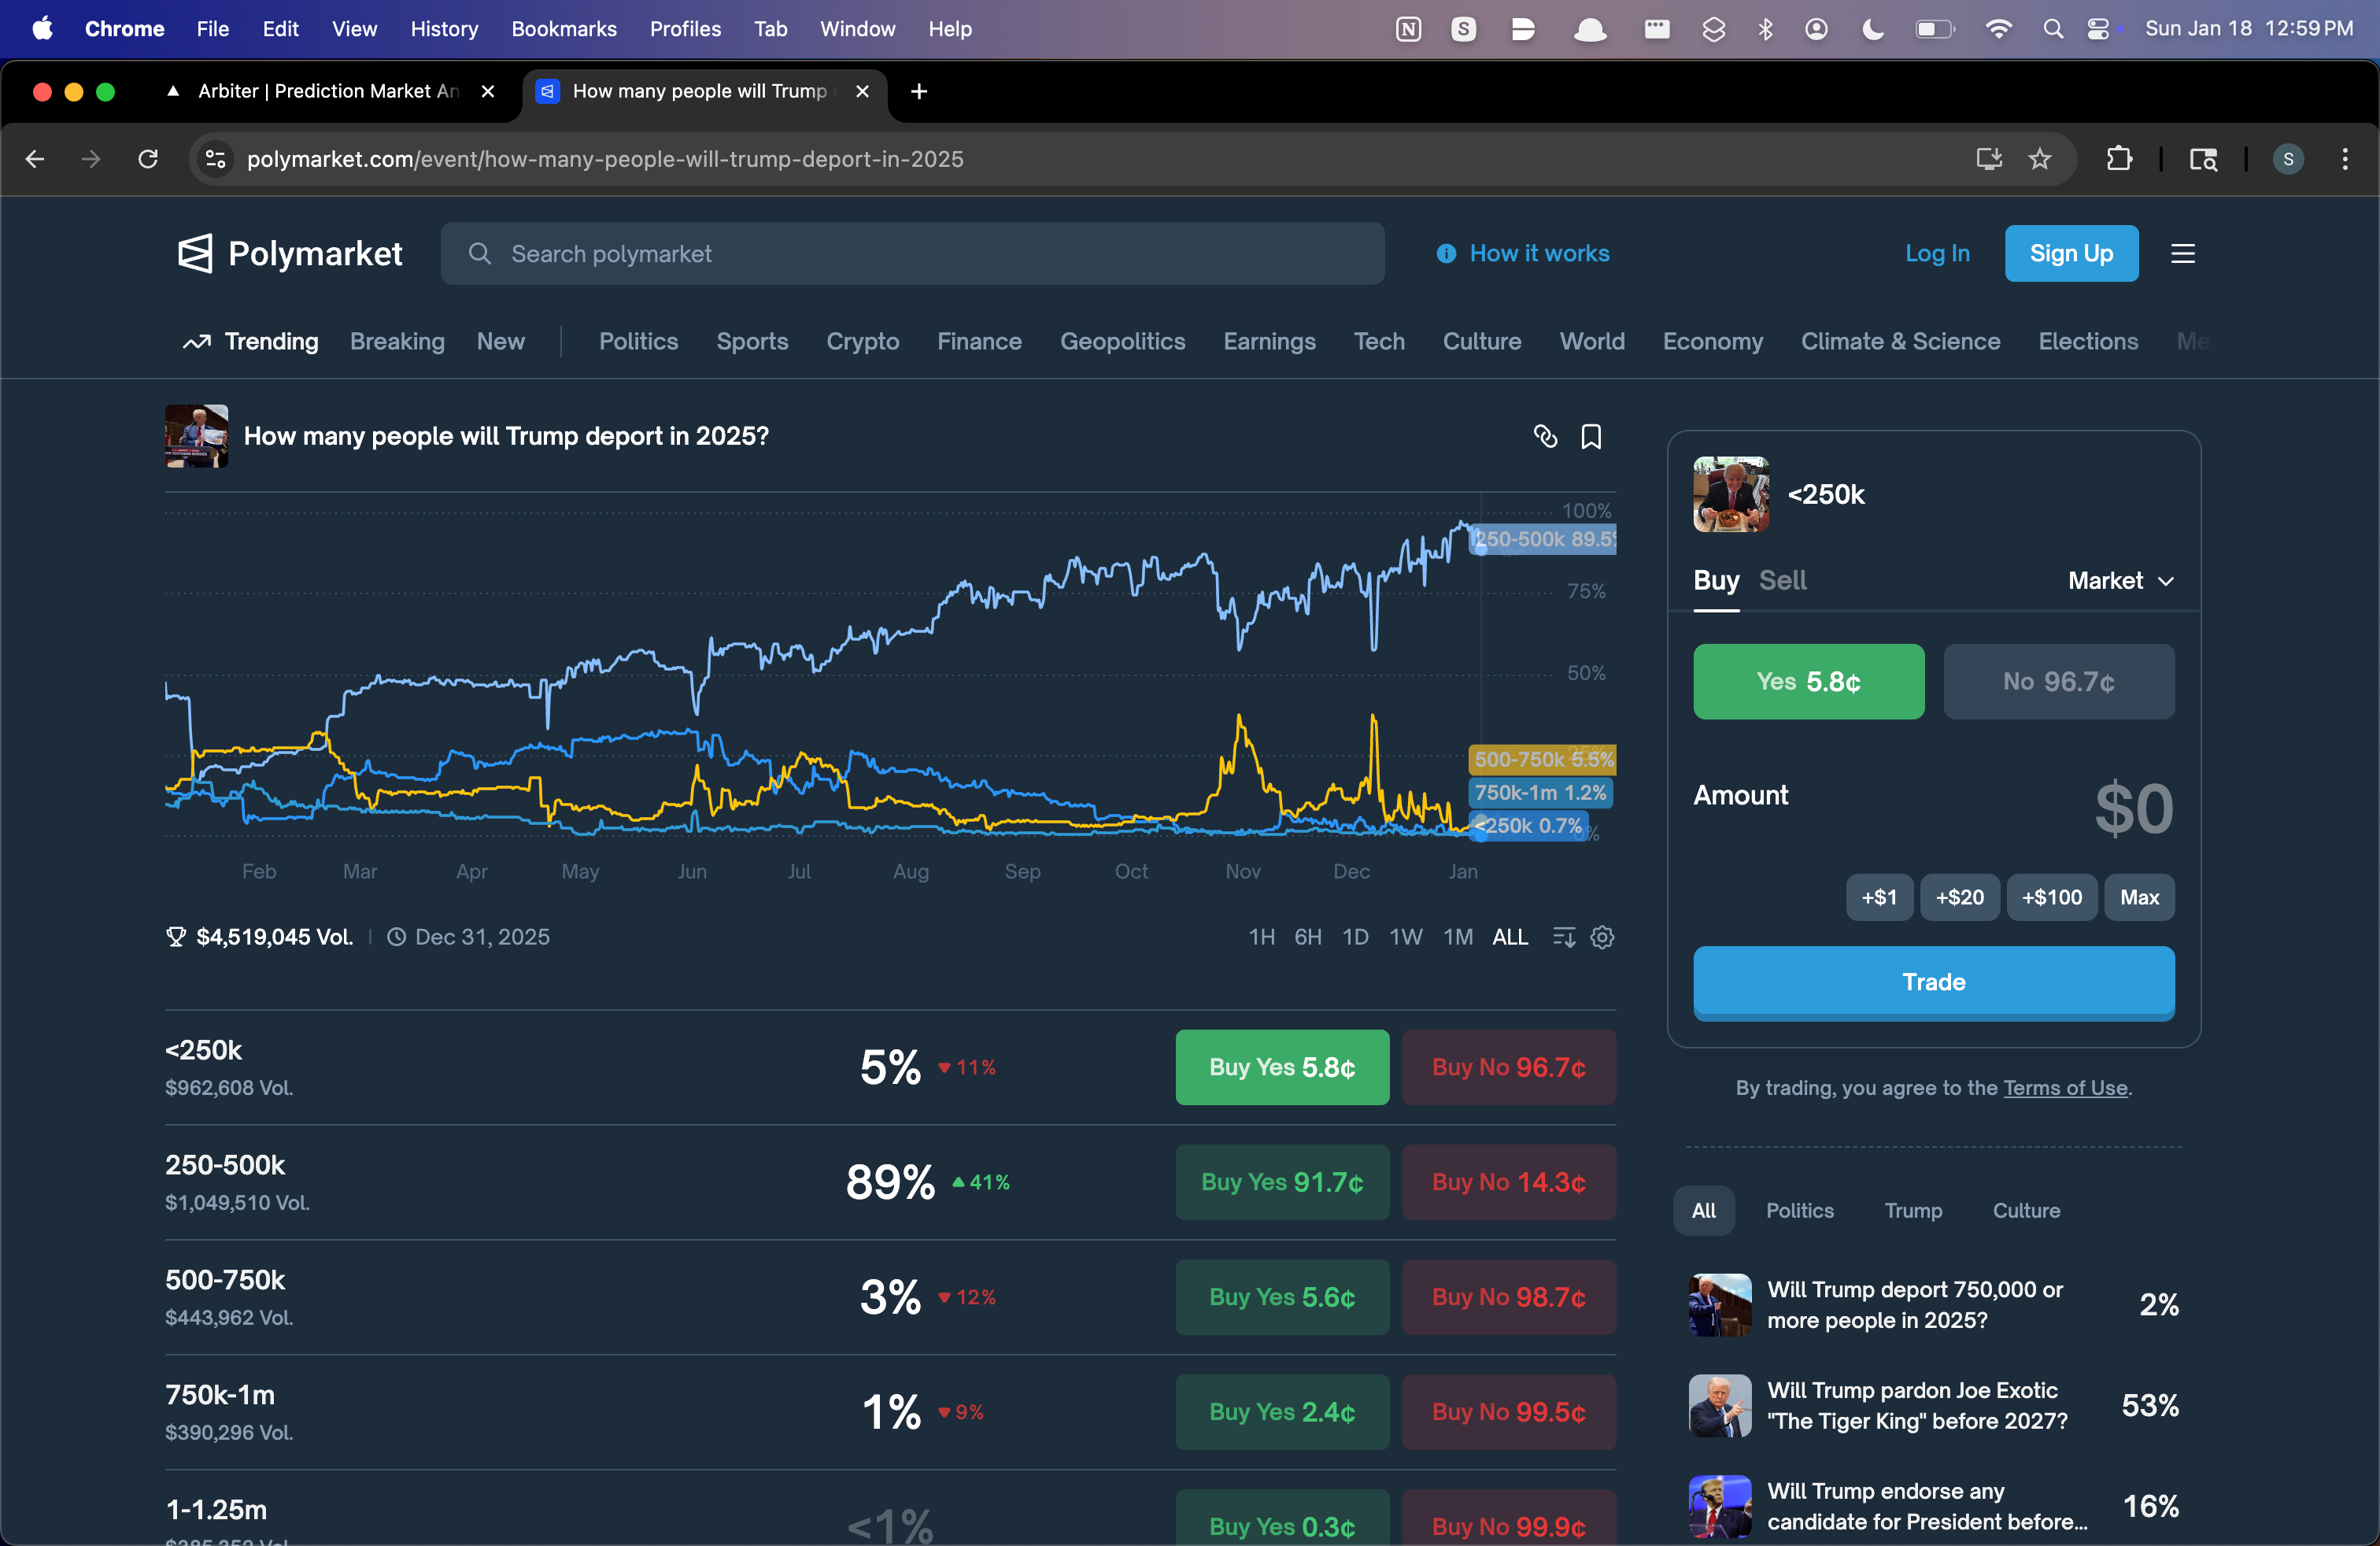
Comparison with Polymarket Data
-
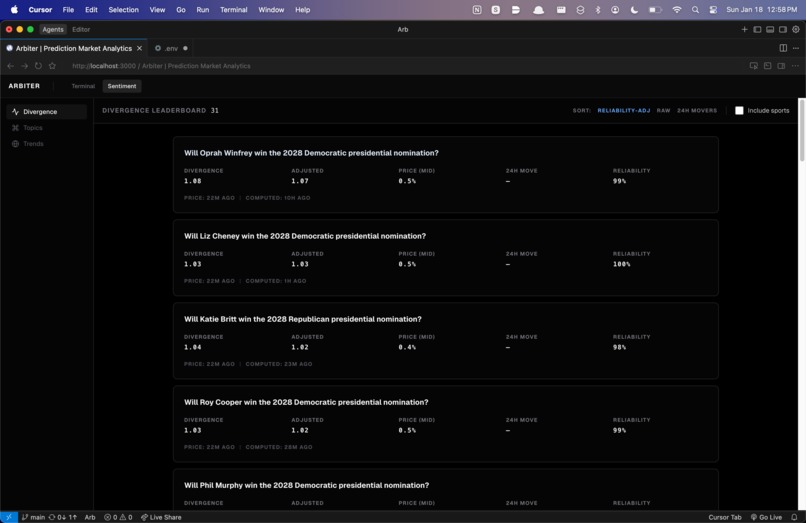
Quantifying General Public Emotions
-
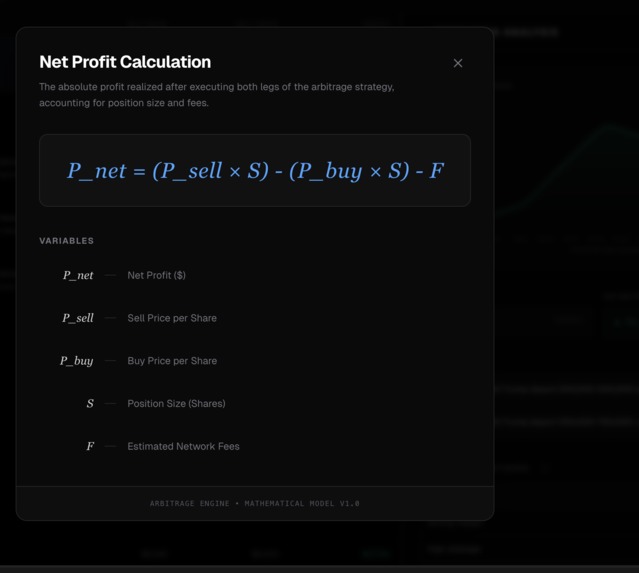
Net Profit Calculation
-

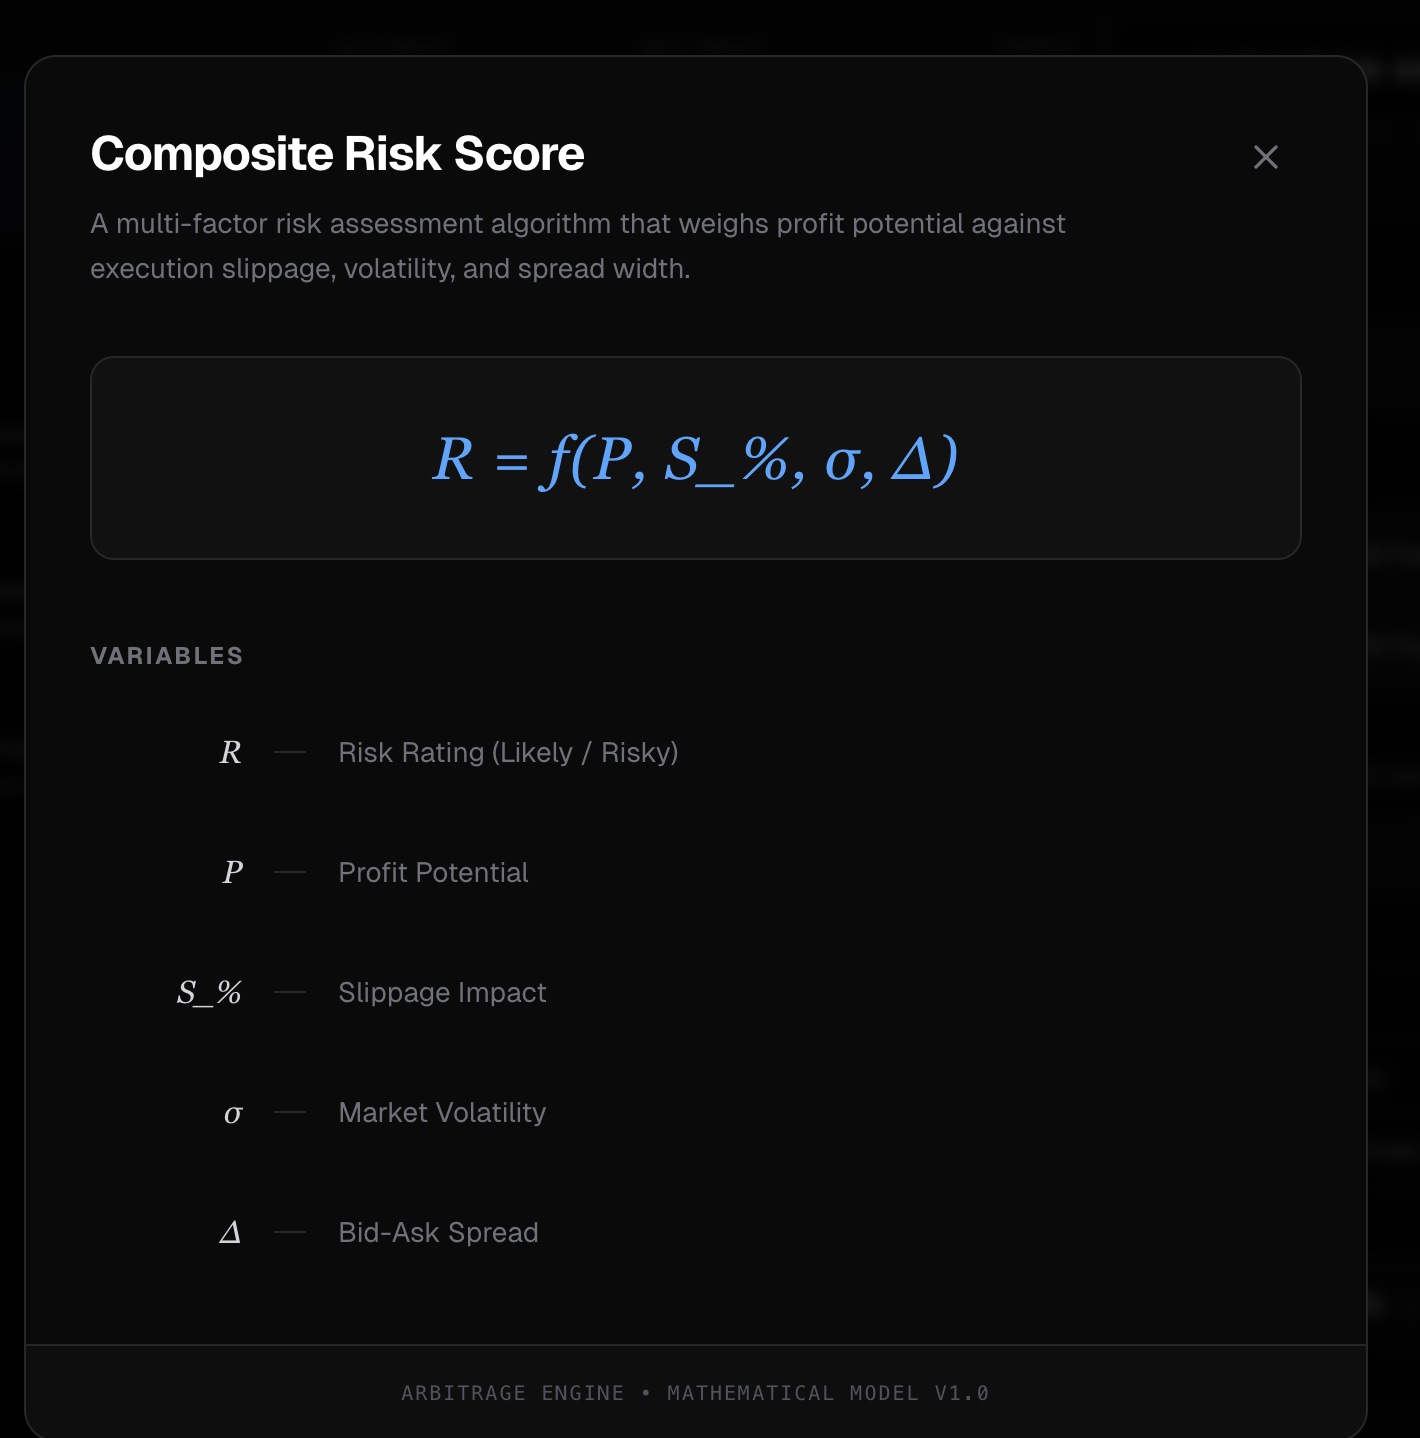
Composite Risk Score


Inspiration
Most prediction market dashboards show you a number and call it a probability. We wanted to guarantee profit and know what that number actually feels like.
Spoiler: it's harder than Twitter screenshots make it look.
The first thing we learned is that the price you see on Polymarket isn't the price you can trade at. Order books have depth. When you try to buy $5,000 worth of YES shares, you don't get filled at the displayed price. You eat through the book, your average fill gets worse, and suddenly that "guaranteed profit" evaporates. We spent the first few hours of the hackathon debugging what we thought was broken code before realizing the math was just... correct. Most arb opportunities aren't real once you model execution.
That was humbling. But it led us somewhere more interesting.
We started asking: why do prices inside Polymarket disagree with each other? Not Polymarket vs Kalshi (that's a different project). We mean markets on the same platform that should be logically consistent but aren't.
Example: "ETH above $4000 by June" trading at 45%, while "ETH above $4000 by December" trades at 40%. That's backwards. If you believe ETH hits $4k by June, it definitely hits $4k by December. But the prices don't reflect that. Why? Fragmented attention. Liquidity imbalances. People trading on vibes instead of logic.
We built tools to find these inconsistencies and show you whether you can actually profit from them after slippage.
Then we went further.
Prediction markets aggregate beliefs, but they don't capture how people feel about those beliefs. A market at 70% tells you the crowd thinks something is likely. It doesn't tell you if they're terrified or excited. For that, you need language. What people are saying on X, how they're framing the question, whether the discourse is panicked or calm.
So we fused both signals:
- What people are betting (Polymarket prices)
- What people are saying (X posts via Bird CLI)
We call the output Blended Online Sentiment. It's a number that combines money-weighted belief with narrative emotion. When they agree, confidence is high. When they diverge, something interesting is happening.
Who this is for
Traders who are tired of looking at midpoint prices and wondering why their fills are worse than expected. We show you executable prices at your size, not fantasy numbers.
Analysts and researchers who want to quantify crowd expectations on politics, crypto, macro, tech. Prediction markets are the closest thing we have to a real-time belief aggregator. We make that data legible.
Funds and institutions exploring prediction markets as alternative data. The sentiment signals here update faster than polls and surveys. When a market moves, you see it in minutes, not weeks.
Polymarket power users who want to find edge without leaving the platform. We deliberately kept this Polymarket-only. No cross-venue arbitrage that splits your capital across Kalshi and Polymarket and makes you manage two accounts, two interfaces, two sets of fees. Everything we surface is actionable within Polymarket itself. You find the trade, you execute the trade, you stay on Polymarket.
We're not trying to fragment liquidity across platforms. We're trying to make Polymarket's existing liquidity more efficient.
What it does
Arbiter finds logical inconsistencies in Polymarket and quantifies what the crowd actually feels about the future.
Intra-Market Arbitrage (within Polymarket only)
We scan for markets that should be logically related but are priced inconsistently:
- Subset/superset relationships (if A happens, B must happen)
- Mutual exclusivity violations
- Implication chains that don't add up
For each opportunity, we show you the executable price at your trade size, not the midpoint. We walk the order book and compute your actual average fill. If the arb dies at $500 because of thin liquidity, you see that before you trade.
This keeps you on Polymarket. We're not pointing you to some other exchange to complete the other leg. Both sides of every trade happen on the same platform.
Blended Online Sentiment
For any market or topic, we compute:
- Market belief: the probability implied by Polymarket prices
- Narrative emotion: fear, optimism, anger, confusion extracted from X posts
- Divergence: when money and mood disagree
You can also type any phrase ("AI bubble," "rate cuts," "WW3") and get instant sentiment across all semantically matched markets. We use pgvector embeddings, not keyword matching.
How we built it
Frontend Next.js (App Router) React TypeScript Interactive charts for trade simulation and analytics Backend / API Next.js API routes / server actions TypeScript Execution simulation logic (order book walking, slippage modeling) Data & Infrastructure Polymarket APIs Gamma API (market discovery & metadata) CLOB API (order books, bids/asks, spreads) Supabase (Postgres) Market metadata Cached analytics Optional pgvector support for semantic search Vercel Hosting Serverless functions Scheduled cron jobs AI / ML OpenAI API Used as a conservative logical relationship classifier Identifies which market pairs have hard resolution constraints Prevents false arbitrage from weak semantic similarity Optional Narrative Layer Bird CLI (X/Twitter ingestion) Best-effort, cached narrative context Not a core dependency; Polymarket remains the primary signal
Data
Polymarket: Gamma API for market discovery, CLOB API for order books and pricing. Important detail that cost us an hour: YES and NO are separate tokens with separate order books. You fetch by token ID, not market ID. The docs mention this but it's easy to miss.
X: Bird CLI, which scrapes X using your browser cookies. It works until it doesn't. We cache aggressively and the app degrades gracefully when X is unavailable.
Embeddings: We use OpenAI's text-embedding-3-small at 384 dimensions, stored in Supabase via pgvector. This powers the Custom Topic Builder. When you type "AI bubble," we embed that query and retrieve markets by cosine similarity. No keyword matching, no manual tagging. The slider in the UI adjusts the similarity threshold so you can tighten or loosen what counts as "related."
Testing: We indexed 9,812 open Polymarket markets, stored 49k+ price samples, cached 318 X posts, and computed blended sentiment for 50+ tracked markets (plus generated 409 embeddings for topic/trend matching). The pipeline refreshes automatically on a single laptop: prices every ~2 minutes, sentiment every ~5 minutes, and market metadata every ~10 minutes, with Supabase as the source of truth.
Execution math
When you buy into an order book, you consume liquidity at progressively worse prices. We model this explicitly.
Say you're buying and the order book has asks at different price levels, each with a price and available size. As you fill your order, you eat through these levels. Your average execution price is:
$$\bar{q} = \frac{\sum_i q_i \cdot x_i}{\sum_i x_i}$$
This is the volume-weighted average across all the levels you traded at.
Slippage is the difference between your average fill and the best price that was available:
$$\text{Slippage} = \bar{q} - q_{\text{best ask}}$$
We plot profit vs. trade size so you can see exactly where an opportunity breaks down.
Sentiment math
Polarity detection: A 70% YES on "Will there be a recession?" means fear. A 70% YES on "Will ETH hit $5k?" means optimism. Without this step, our sentiment scores were meaningless. We built a keyword classifier:
- Negative triggers: crash, pop, recession, war, bankrupt, collapse, fail, ban, lose, default
- Positive triggers: win, pass, approve, growth, rise, rally, launch, reach, record
If the question contains a negative trigger, high YES probability maps to fear. If it contains a positive trigger, high YES probability maps to optimism. If neither, we mark it neutral and exclude it from directional sentiment. Hacky, but it works and it's explainable.
Emotion extraction uses a fixed 9-category set (fear, optimism, anger, etc.) scored against market text and X posts. We blend market belief and narrative emotion with reliability weighting:
$$w_{\text{market}} = 0.50 + 0.20 \cdot r$$
The reliability score ranges from 0 to 1 based on volume, liquidity, and spread.
$$w_{\text{X}} = 1 - w_{\text{market}}$$
$$\text{Blended Mood} = w_{\text{market}} \cdot m_{\text{market}} + w_{\text{X}} \cdot m_{\text{X}}$$
The reliability score combines three signals:
$$\text{reliability} = 0.5 \cdot \text{vol_score} + 0.3 \cdot \text{liq_score} + 0.2 \cdot \text{spr_score}$$
Each component is log-scaled and clamped to [0,1]. A market with $1M volume, $500k liquidity, and 2% spread scores high. A market with $10k volume and 15% spread scores low. We weight market belief more heavily when reliability is high, and lean on narrative more when the market is thin.
Divergence measures how much money and mood disagree:
$$\text{Divergence} = |m_{\text{market}} - m_{\text{X}}|$$
High divergence means the money is saying one thing and Twitter is saying another.
We use a DistilBERT model fine-tuned on GoEmotions, which outputs probabilities across 28 emotion labels. We collapse those into 12 buckets that make sense for market analysis:
- Positive: optimism, joy, excitement, curiosity, trust
- Negative: fear, anger, disgust, sadness, confusion
- Ambiguous: surprise, neutral
The model runs locally via ONNX, so we're not making API calls for every tweet. That matters when you're scoring hundreds of posts per market.
Stack
Next.js, Supabase (Postgres + pgvector), Bird CLI running locally. No Docker, no Vercel in the MVP. We wanted something we could actually debug during a hackathon.
Technical choices
A few decisions that shaped the build:
- 12 emotion buckets, not 28: GoEmotions has 28 labels. We collapsed them into 12 that map to market-relevant sentiment (fear, optimism, anger, etc). Fewer buckets means cleaner UI and more stable scores.
- Engagement-weighted tweet aggregation: Not all tweets are equal. We weight by
1 + ln(1 + likes + 2*retweets + replies)so viral takes count more than noise. - 120-second price snapshots: We sample midpoint and spread every 2 minutes and store locally for sparklines. This avoids hammering the CLOB API and gives us smooth 24h charts.
- Lease-based job locking: Our worker uses database leases (not Postgres advisory locks) so we can run from networks that block direct DB connections. Jobs are idempotent and safe to overlap.
Why this measures public sentiment
Traditional sentiment analysis counts positive and negative words on social media. That's noisy and easy to game.
Prediction markets are different. When someone puts $10,000 on YES, they're revealing what they actually believe, not what they want to signal. Bad beliefs lose money. The prices that emerge aren't opinions. They're financially weighted expectations.
But prices alone miss texture. A market at 70% doesn't tell you if the crowd is calm or panicking. By layering X emotion analysis on top of Polymarket prices, we get:
- What people believe (from their bets)
- How they feel about it (from their words)
We're not claiming this represents "the general public." Polymarket traders skew tech-savvy and risk-tolerant. X users skew loud. We label it honestly as "Blended Online Sentiment" and show exactly how we compute it.
What we found
Running this on live Polymarket data surfaced some interesting patterns:
- Markets about AI consistently show higher fear scores in X discourse than their prices would suggest. The money is calmer than the conversation.
- Political markets have the highest divergence scores. People tweet one thing and bet another.
- Crypto markets move fast but sentiment lags. Price updates in seconds, narrative catches up over hours.
We're not claiming these are tradeable signals. But they're real patterns in real data, and we built the infrastructure to keep finding them.
Challenges
Token IDs vs Market IDs: Order books are per-token, not per-market. YES and NO have separate books. We didn't realize this for the first hour and thought our API calls were broken.
Vanishing arbs: Once we added slippage modeling, half the opportunities we found disappeared. They were never real. That was frustrating but also validated the approach.
Bird breaks: X's unofficial GraphQL API can change without notice. We built around this by caching everything and treating X as an optional enrichment layer. The app works without it.
Polarity detection: A 70% YES on "Will there be a recession?" means fear. A 70% YES on "Will ETH hit $5k?" means optimism. Without this step, our sentiment scores were meaningless. We ended up using keyword rules (crash, collapse, fail = negative; win, launch, growth = positive) which felt hacky but works.
API rate limits: Polymarket's CLOB API throttles requests through Cloudflare. We hit the ceiling multiple times while trying to backfill historical data and test real-time streaming. This blocked us from building a true live-updating dashboard during the hackathon. We had to batch our syncs carefully and cache more aggressively than we wanted. The current version refreshes every few minutes instead of streaming continuously. With more time (and possibly API partnership), we'd push this to true real-time.
Graceful degradation: Not every market has X coverage. Some questions are too niche, some are too new. We built a fallback: when X data is missing, we compute a category-level baseline from other markets in the same category and blend that with the price signal instead. The UI shows "Narrative: not available yet" so users know what they're looking at. This kept the dashboard useful even when Bird was rate-limited or a market had zero tweet matches.
What we're proud of
The execution-aware pricing is real. We're not just comparing midpoints and pretending you can trade there. We show you bid/ask/spread and what happens when you try to fill at size.
The sentiment fusion is novel. We haven't seen another tool that combines prediction market prices with X emotion signals into a single index. Most dashboards show you one or the other.
The divergence metric surfaces something genuinely useful: moments when the money and the narrative disagree. That's where the interesting trades live.
The emotion model runs locally via ONNX. No API calls per tweet, no latency spikes, no third-party dependency for inference. We score hundreds of posts in seconds.
And we kept everything on Polymarket. This isn't a cross-venue arbitrage play that fragments your capital across platforms. It's about finding edge within a single ecosystem. You don't need a Kalshi account. You don't need to bridge funds. You don't need to compare resolution criteria across different platforms. One venue, one set of rules, one place to trade.
What we learned
- Midpoint prices lie. Modeling execution is the whole game.
- Prices are beliefs, not emotions. You need language to get emotion.
- Intra-market inconsistencies exist because attention is fragmented and most traders don't think in logical relationships.
- Bird is held together with duct tape and prayers. Cache everything.
- "Sentiment analysis" is a vague term. Being specific about what you're measuring (and what you're not) builds more trust than making broad claims.
- Rate limits are real. Plan for them from the start, not after you've burned through your request budget debugging.
What's next
- Multi-leg strategies: payoff curves for combinations of related markets within Polymarket
- Websocket streaming for live updates
- Historical backtesting: did past divergences predict price moves?
- More sentiment sources if we expand scope (Reddit, news, Metaculus)
- Websocket streaming for live updates (pending rate limit negotiation)
Why we built this
Prediction markets are the closest thing we have to a real-time belief aggregator. Millions of dollars flow through Polymarket every day, each trade a tiny confession about what someone actually thinks will happen.
But prices don't tell the whole story. They tell you what people believe. They don't tell you how they feel about it.
We built Arbiter to surface both. One platform, one set of tools, one place to understand what the crowd knows and what the crowd fears.
The math is transparent. The methodology is explainable. And everything stays on Polymarket.
Built in 24 hours. No mock data. No Figma prototypes. Just Polymarket, X, and math.
Built With
- openai
- pnpm
- postgresql
- semantics
- supabase
- typescript
- vector

Log in or sign up for Devpost to join the conversation.