Inspiration
All of us on our team come from Latin American backgrounds, and that is where the idea for ARAZUL started.
In many Latin American cities, choosing how to get somewhere is not only about finding the fastest route. People develop informal knowledge about which streets they prefer at night, which areas they would rather avoid, or when taking a route that is a few minutes longer feels worth it. That knowledge usually comes from family, friends, drivers, or simply from knowing a city well.
We started asking: what happens when someone does not have that local knowledge?
Navigation apps are very good at optimizing for time, distance, and traffic, but they usually do not help users understand local safety context when comparing routes. We wanted to explore whether historical public-safety data could become another useful layer of navigation—without pretending that we could predict crime or guarantee that one route is safe.
That became ARAZUL.
Our first and most complete model focuses on São Paulo because its public data provided a strong combination of location, incident categories, time-of-day information, and enough detail to support both walking and driving.
What We Built
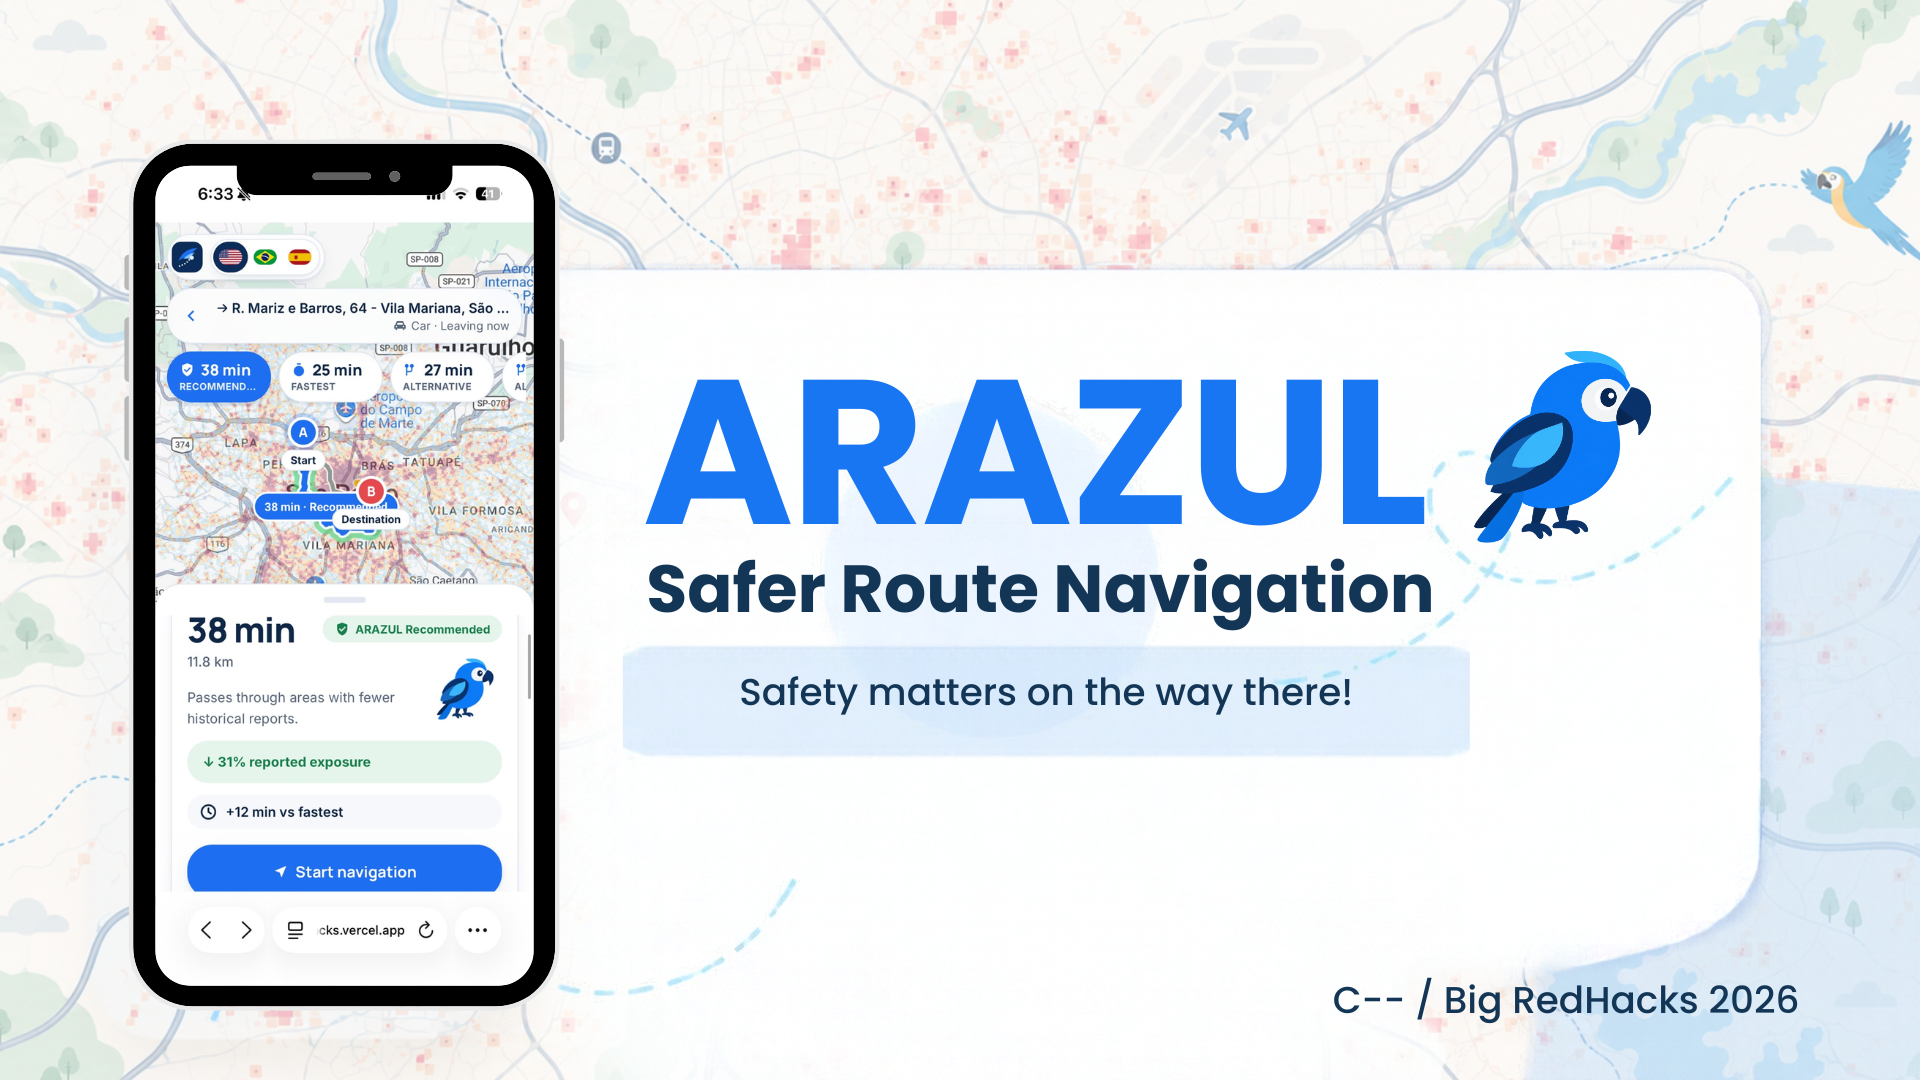
ARAZUL is a context-aware navigation system that compares travel time with modeled historical incident exposure.
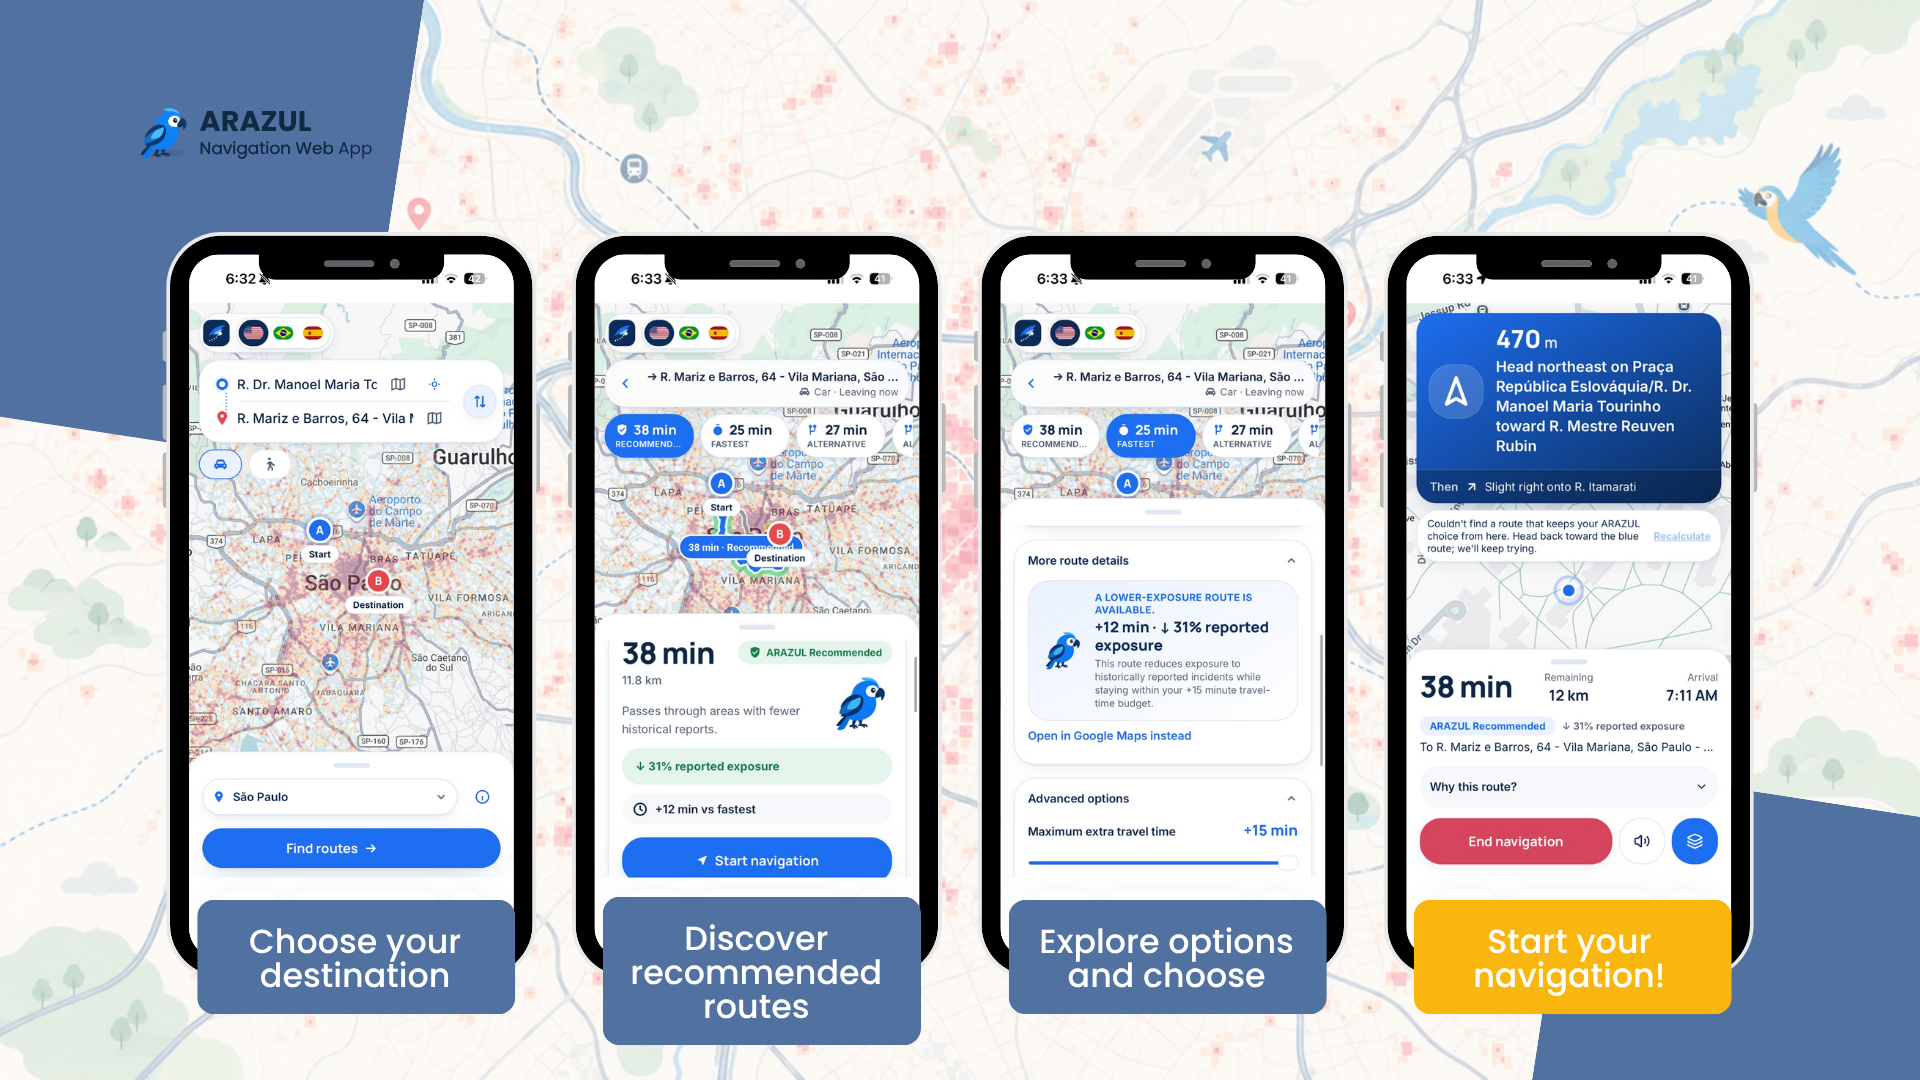
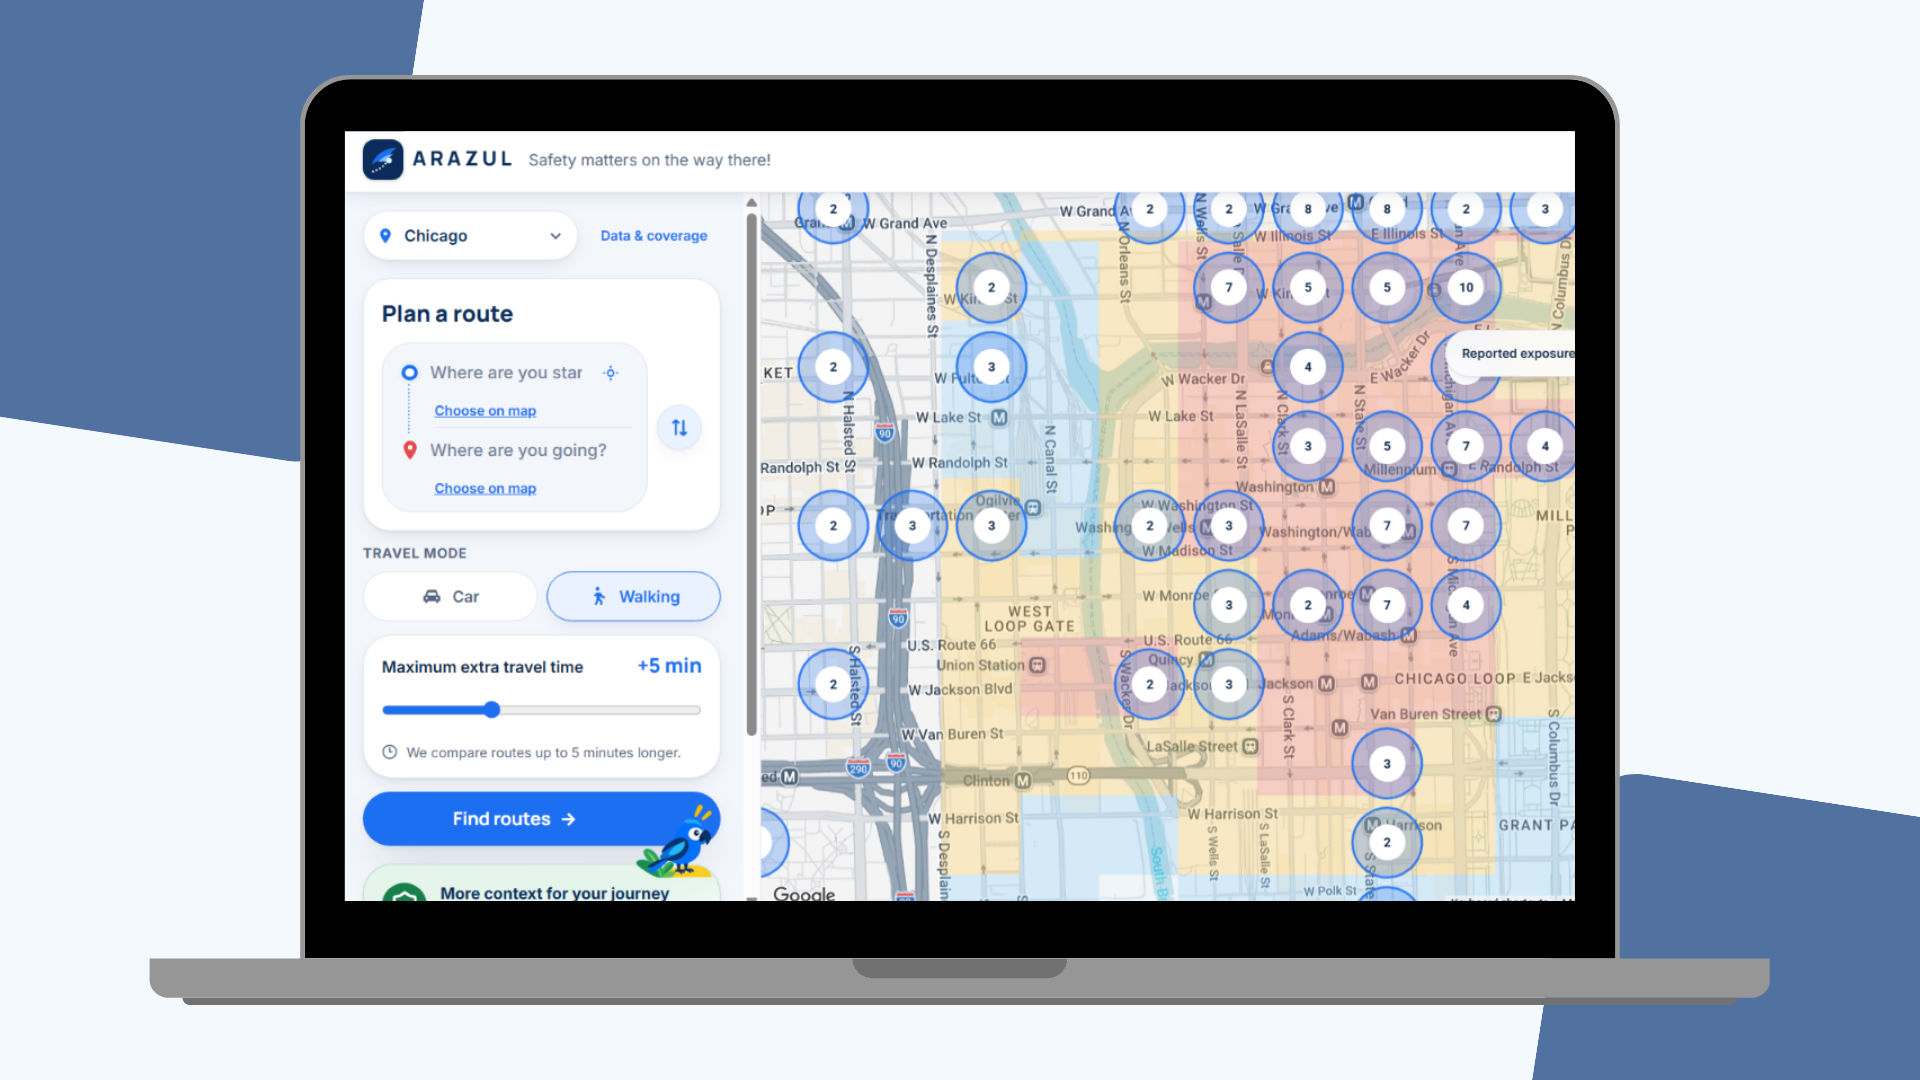
A user chooses:
- an origin and destination
- walking or driving, when supported by the city's data
- a departure time, when time information is available
- how many extra minutes they are willing to spend for a lower-exposure route
Instead of simply choosing the fastest route, ARAZUL asks a different question:
Is there a meaningfully lower-exposure route that is still reasonable for this user?
Google provides the real road network, valid routes, route geometry, distance, travel time, and traffic-aware driving estimates. ARAZUL adds our exposure analysis on top.
We sample each route approximately every 30 meters and accumulate historical exposure along the entire path rather than looking only at the origin and destination.
How the Exposure Model Works
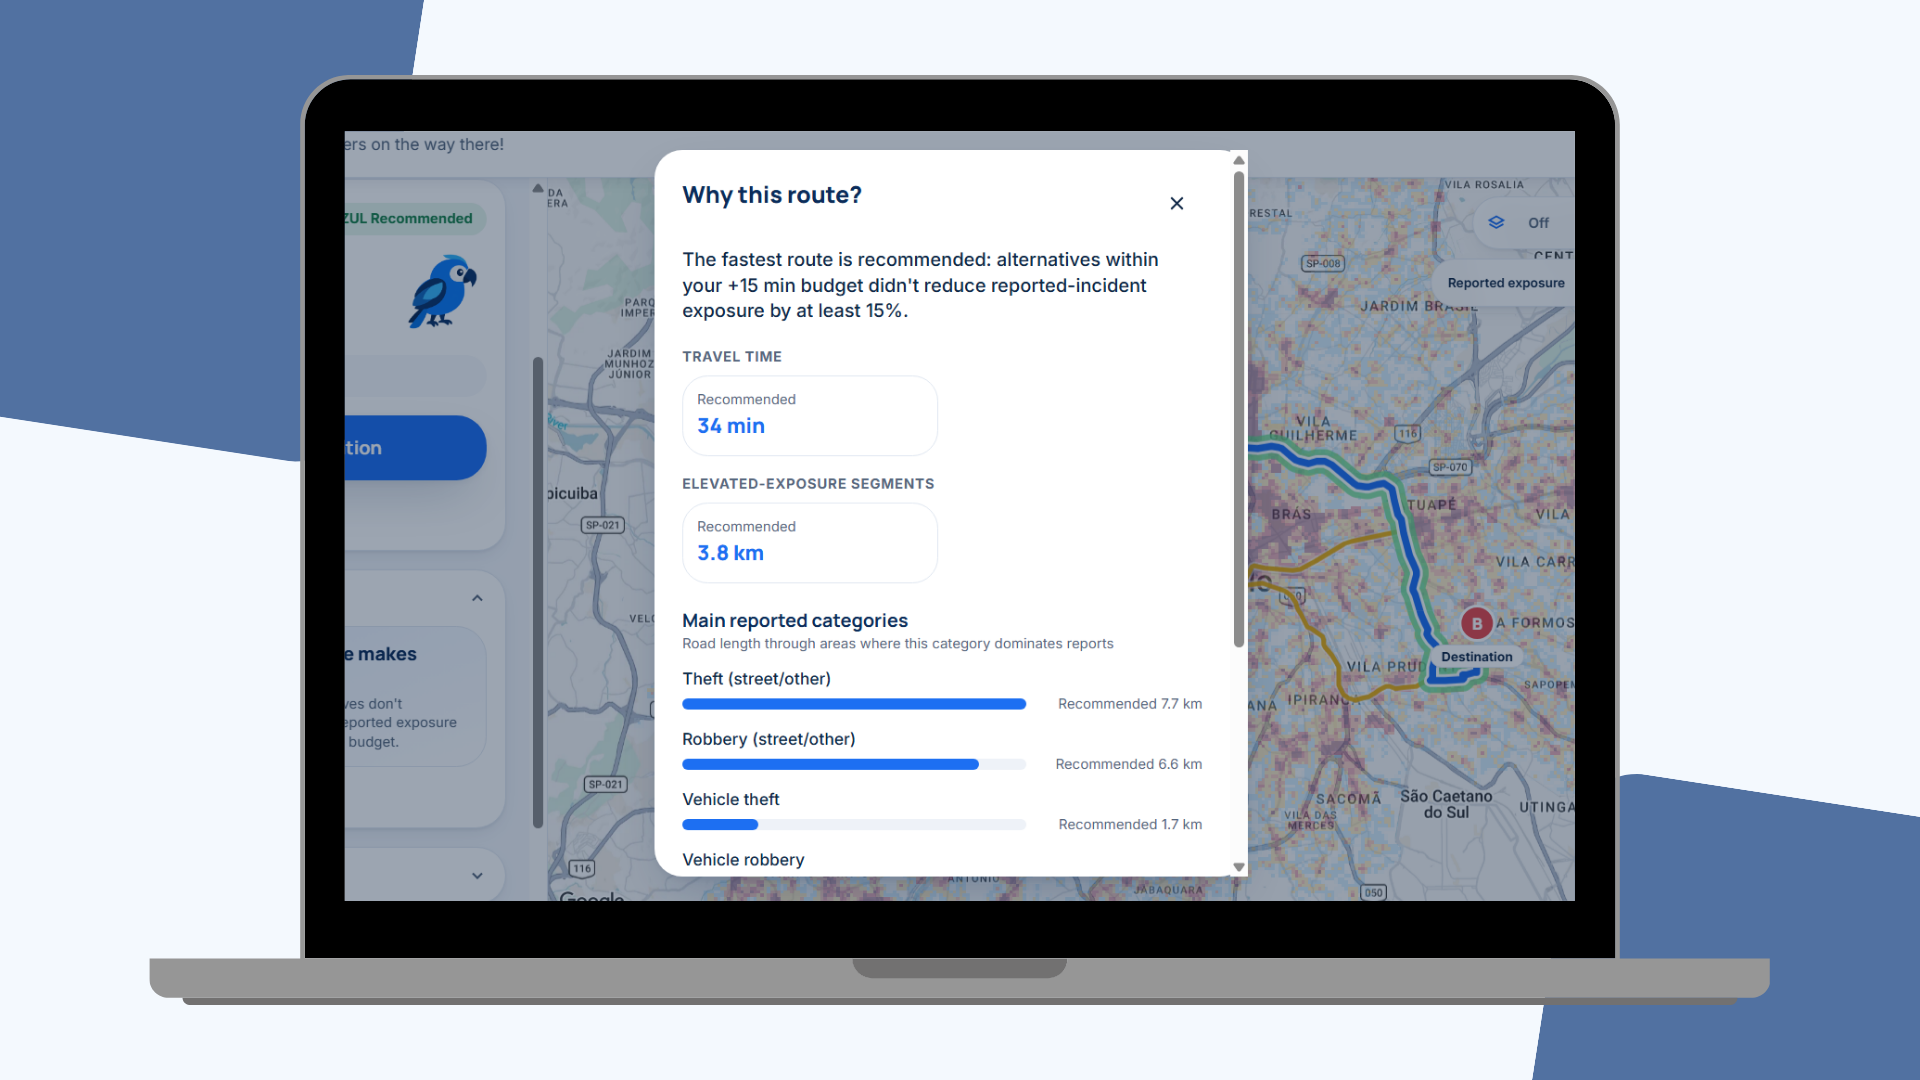
One important part of our São Paulo model is that different incident categories should not affect walking and driving in exactly the same way. For example, a street robbery is more relevant to someone walking, while a vehicle robbery is more relevant to someone driving.
During preprocessing, incident categories receive both a severity value and a transportation-mode relevance value:
Contribution = Severity × Mode Relevance
These values are already incorporated into separate walking and driving exposure layers before the user searches for a route. The application does not reclassify every incident in real time.
This means the walking and driving maps can look different even though they come from the same underlying historical data.
Time also matters
Where the dataset includes time-of-day information, ARAZUL gives more importance to the selected period while still considering the broader daily pattern.
Our prototype uses:
Ecell = 0.70 × Eselected period + 0.30 × Edaily average
The 70/30 rule acts as a time-smoothing mechanism. We did not want a route's result to depend entirely on one potentially noisy historical time bucket.
Balancing Exposure and Travel Time
One of our most important design decisions was not to combine time and exposure into a single arbitrary score.
Minutes and historical incident exposure are fundamentally different quantities. We did not think it made sense for us to decide that one minute of someone's time should equal some fixed amount of exposure.
Instead, the user controls the tradeoff.
If the fastest route takes 20 minutes and the user accepts five extra minutes, ARAZUL primarily searches for alternatives that take 25 minutes or less.
We calculate the relative improvement as:
Improvement = (Efastest − Ealternative) / Efastest
During testing, we found that very small exposure differences could cause unnecessary detours. We experimented with different thresholds and currently use 15% as our prototype definition of a meaningful improvement.
We do not treat that number as a universal scientific safety boundary. It is a design threshold that would need further calibration with substantially more testing and user research.
ARAZUL can also show a strong route that falls slightly outside the user's selected time budget rather than automatically choosing it. The goal is to explain the tradeoff and let the user decide.
Challenges We Faced
Escaping high-exposure regions
One of our biggest routing challenges appeared when generating detours around high-exposure portions of a route. Our first approach focused on avoiding individual high-exposure points by creating nearby waypoints. But sometimes many neighboring cells also had elevated exposure. The algorithm would generate another route only to end up inside almost the same area again, like trapped inside a bubble.
Instead of reasoning only about isolated points, ARAZUL began identifying connected areas where exposure is concentrated, generating candidate detours around those regions, asking Google for valid routes, and then evaluating those routes using the same exposure model.
Getting travel time right
Travel-time accuracy also became critical. Early in development, we compared some of our estimates with Google Maps and realized that rough local calculations were not accurate enough.
That matters because a recommendation can change completely depending on whether a detour costs three, five, or ten additional minutes.
We therefore moved toward using Google's actual routing and traffic-aware duration estimates.
Building a real navigation experience
A static map or simple visual approximation was not enough for the product we wanted.
We needed:
- real coordinates
- valid streets
- route geometry
- travel times
- location search
- legitimate detours
- interactive map overlays
This pushed us toward deeper integration with Google Maps Platform.
Google Maps Platform
Different Google Maps services support different parts of ARAZUL.
Maps JavaScript API powers the interactive map, route visualization, markers, and exposure overlays.
Places powers origin and destination search.
Geocoding allows selected geographic points to be converted into readable addresses.
Routes provides valid route alternatives, route geometry, distance, navigation steps, duration, and traffic-aware driving estimates.
Google determines the physical road network, legal turns, traffic conditions, and valid routes.
ARAZUL evaluates those routes using our historical-exposure model and can generate additional detour candidates when useful.
Working Across Different Cities
One of the biggest things we learned is that public-safety data is not uniform. Some datasets include precise coordinates, timestamps, and detailed incident categories, and others provide broader geographic areas, monthly summaries, or no time-of-day information at all.
São Paulo currently supports our most complete walking-and-driving model. Other cities can still support route-level analysis, but some are limited to walking because their public datasets do not provide enough information to justify a separate driving model.
What We Learned
The biggest lesson from building ARAZUL was that the hardest part of a data-driven project is not always producing a number.
It is understanding what that number actually means.
Early on, it was tempting to describe our result as a universal "safety score." As the project evolved, we realized that historical data cannot honestly support such a strong claim.
That is why we describe our metric as modeled historical incident exposure.
It compares routes using historical public-safety information. It does not predict where a crime will happen, calculate an individual's probability of victimization, or guarantee that one route is safe.
Our routing evolved from avoiding isolated points, to detecting sustained hotspots, to reasoning about connected high-exposure corridors, and our travel-time model improved after comparing it against real Google Maps results.
The city model improved once we realized that datasets from different places cannot simply be treated as identical.
How We Worked as a Team
- Mateus worked mainly on core engineering, routing logic, exposure calculations, travel-time comparisons, thresholds, and detour behavior.
- Henrique focused on finding, analyzing, converting, and integrating public-safety datasets.
- Vania worked on application development, UI/UX, map interactions, route comparison, recommendation display, and debugging.
- Kimberly focused on slides, pitching, storytelling, product framing, and communicating the methodology.
We used GitHub branches and merges so each person could work independently while continuously integrating the different pieces of the project.
What's Next
We see several directions for ARAZUL:
- Expand across Latin America: Build city-specific exposure models based on what each local public dataset can actually support.
- Explore Peru: Continue investigating public safety datasets and improve our conversion pipeline for new formats and cities.
- AI-powered voice assistant: Allow users to ask why a route was recommended, compare alternatives, and understand how changing their travel-time budget affects their options.
- Native mobile app: Bring ARAZUL to mobile with live location, navigation, and voice interaction.
- Improve the model: Continue working on threshold calibration, confidence indicators for sparse-data areas, corridor detection, dataset refresh pipelines, and broader route testing.
Contact
- Mateus Maeda Shida ([email protected])
- Vania Pachas Acuna ([email protected])
- Kimberly Yuen ([email protected])
- Henrique Akabane ([email protected])
Built With
- css
- github
- google-places
- googlegeocodingapi
- googlemapsjavascriptapi
- googlemapsplatform
- googleroutesapi
- html
- javascript
- node.js
- npm
- react
- tailwindcss
- typescript
- vite


Log in or sign up for Devpost to join the conversation.