-
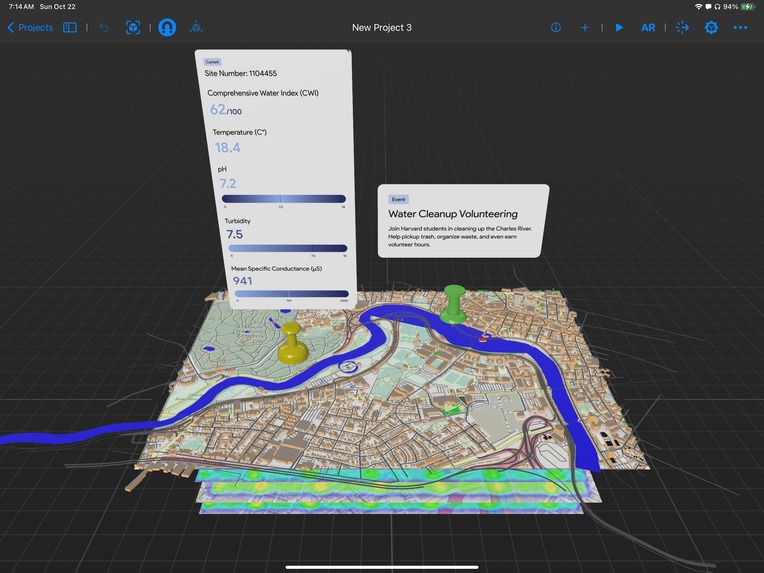
AR experience
-
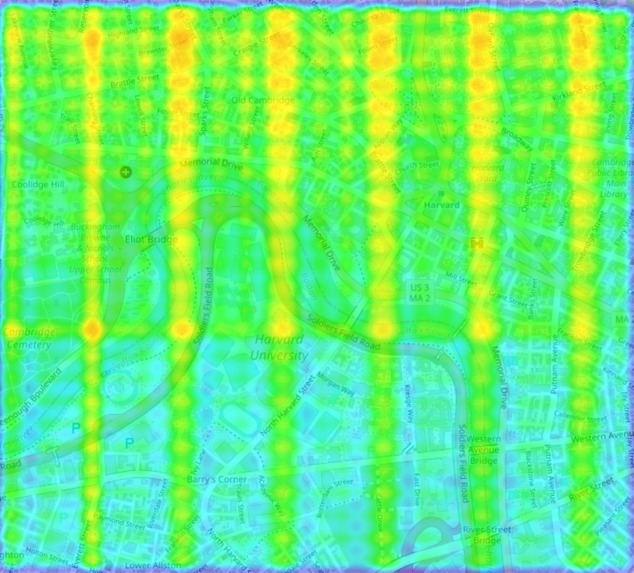
Heat Map 1
-
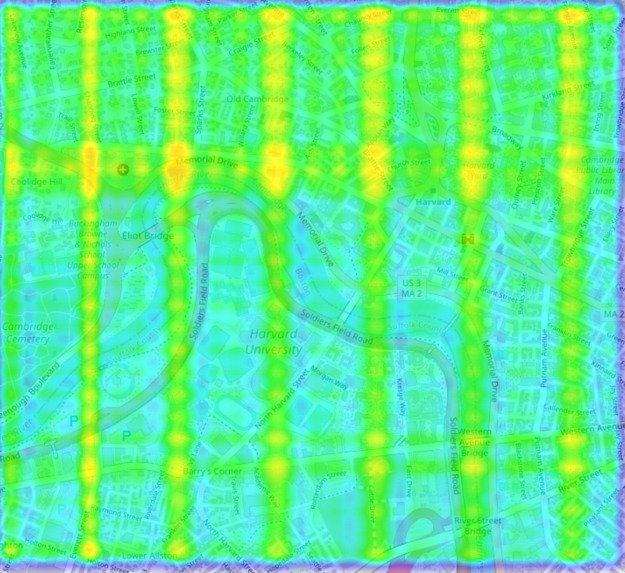
Heat Map 2


Inspiration
The inception of our platform comes from the incident where citizens of Ann Arbor had to drink highly polluted water with harmful toxins like dioxane during the 2010s and the government agencies did not spread much awareness or means to bring it to an immediate stop, thus keeping the public in the dark. In today's day and age, freedom of information is key and everyone has the right to know about the quality of the water they drink and the contents within it. Today, the water crisis is a growing problem along with the lack of accessible, real-time data on water quality. We recognized the urgent need for a tool that could offer immediate insights and predictive analysis on water quality. We aim to ensure that every individual, community, and authority is equipped with precise knowledge and can make informed decisions
What it does❓
Our platform offers a dual solution of real-time water quality tracking and predictive analysis of its contents. It integrates data from 11 diverse sources to provide live water quality indices. Our predictive model, trained on 15,000+ data points, offers 99.7% accuracy in predicting water quality, presented through visuals for various stakeholders. Users can visualize these insights through intuitive heat maps and graphs, which makes the data accessible to a larger audience, which can include concerned individuals, all the way up to governments.
Moreover, we have also developed an AR experience that will allow users to interact with and visualize the real-time data, in addition to the heat map; all of which demonstrates the effectiveness and strength of the model.
How we built it 🛠️
We used Machine Learning (ML) and Data Analytics to construct the platform. This real-time tracking and quality checker features consolidated data from 11 different APIs (Google Maps, Google generative AI, etc.), databases, and datasets, and utilizes advanced algorithms to generate live water quality indices. This predictive model is part of cutting-edge technology based on regression analysis, trained on a dataset consisting of more than 15000 data points from 400+ events across the country, from three big data sources.
This makes our platform scalable and versatile, which ensures accurate predictions and visualization that empower users to act upon water quality data.
Challenges we ran into 🤔
1) Collecting and consolidating a large dataset from numerous sources to extract unbiased information and to find detailed 3D models. 2) To use the model's predictions and mathematical calculations to interpret and interpolate the heat maps to accurately represent and visualize the data. 3) To increase the efficiency of the model and to reduce the errors to negligible amounts.
Accomplishments that we're proud of 😎
1) A 99.7% accurate model that has been trained on more than 15000 data points that we have collected and consolidated ourselves. 2) Finding a large range of data regarding the properties such as turbidity indices, pH levels, and mean water temperatures, will help us for future projects. 3) Using numerous GCP services consisting of ML, satellite datasets, and more. 4) Learning about many more api's.
What we learned 📖
Advanced Machine Learning, Data Sourcing, model optimization, error handling, stress management, and many new things through the side events of the hackathon.
What's next for AQUITY - WATER WEALTH 🔮
1) Enhanced Data Integration: Expand data sources and coverage through IoT sensors, satellite imagery, and citizen-contributed data.
2) To foster community growth and awareness through user-friendly apps.


Log in or sign up for Devpost to join the conversation.