-
-
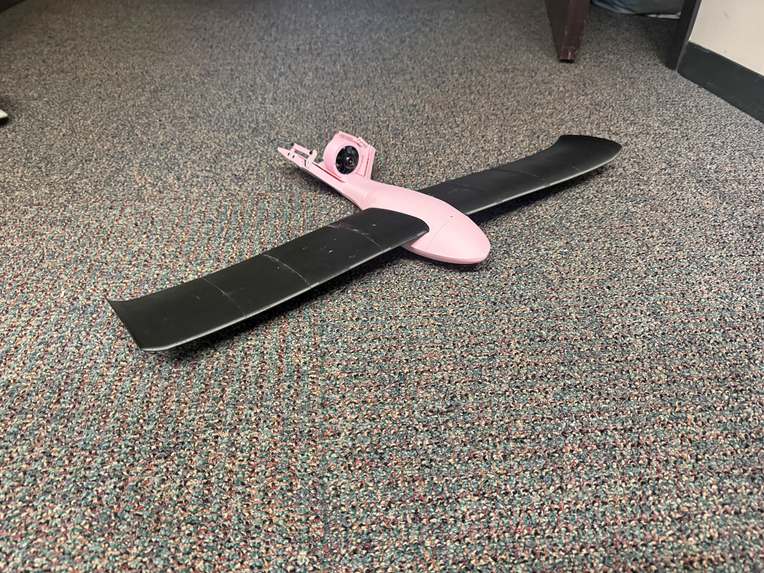
Image of the drone
-
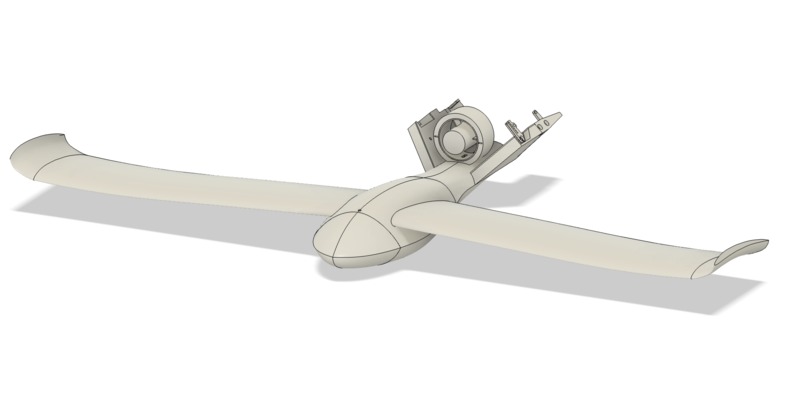
Cad model of drone


Inspiration
I was inspired by my passion for conservation, the challenges faced by ecosystems in my hometown, and the lack of water quality data coverage. Many freshwater bodies and smaller reef systems are not monitored, so scientists aren't notified when the ecosystems become at risk.
We were inspired to use a drone to collect data due to its accessibility. To collect water temperature data, you need access to a permanent water quality system, and most water systems don't have that. These methods are far more costly (and time-consuming) than using a drone, which has a net cost of less than $200 and can be flown remotely. Additionally, this has much less environmental impact, as the drone is only 1.5lbs and consumes a meager amount of energy to fly compared to the materials and energy it would take to build a water quality monitoring system like IRLON.
What it does
Aquatic Stress Sentinel is a low-altitude drone system that collects air temperature readings at the air-water interface (about 1m above the water) and uses a boundary layer thermal correction to estimate water surface temperature. When checking for coral bleaching stressors, it compares those readings against live NOAA and USGS baseline data to generate a stress risk score.
The dashboard detects three key stressors: fish kill risk in freshwater ecosystems, harmful algal bloom conditions in both freshwater and marine environments, and coral bleaching preconditions in marine environments. It also accepts real-world water quality datasets from monitoring networks like IRLON, automatically normalizing column names to match the expected format regardless of the source.
How we built it
We built this as a two-person team with a clean hardware/software split. Niko built the drone and integrated a temperature and humidity sensor with a microcontroller designed to log readings to a CSV file at regular intervals. Willow built the full software pipeline in Python: a data ingestion layer that normalizes CSV formatting, a stressor detection module with scientifically grounded temperature thresholds, a baseline comparison system that automatically queries the nearest NOAA CO-OPS station or falls back to the Open-Meteo marine API for global coverage, and a Streamlit dashboard that visually presents the data and results.
Challenges we ran into
On the hardware side, we ran into integration challenges that prevented us from completing a live flight to successfully collect data during the event. The biggest technical challenge was that our sensor reads air temperature, not water temperature directly. I addressed this by creating an atmospheric boundary layer thermal correction, which adds approximately 1.5°C per meter of altitude to estimate water surface temperature from air readings. Although this is not completely accurate, when we compared our estimates with real air and water temperature conditions, we found that it was usually accurate, but sometimes a degree or two off. Additionally, I encountered issues when using external data sources due to the way they formatted the CSV files and named the columns.
Accomplishments that we're proud of
We're proud that our app works with real data and not just our own drone CSV. It can take live data from the IRLON Indian River Lagoon monitoring network. Our 9 am readings matched IRLON's published water temperature within 0.3°C. We're also proud of the global coverage of our baseline system when assessing coral bleaching risk, which automatically finds the nearest NOAA station for US waters and falls back to the Open-Meteo marine API for international locations like the Great Barrier Reef.
What we learned
We learned how to build a full data pipeline from raw sensor output to calculating risk scores. Ingesting and normalizing CSVs, applying physics-based corrections, using live REST APIs, and rendering results in an interactive dashboard. Working with the NOAA CO-OPS and Open-Meteo APIs taught me how to handle real-world API responses, fallback logic for when stations have no data, and the difference between US and global ocean monitoring infrastructure. I also learned that atmospheric boundary layer physics is more nuanced than a simple linear correction. The air-water temperature relationship varies with wind speed, solar radiation, and time of day.
What's next for Aquatic Stress Sentinel
We want to add a radio telemetry link to the drone so that the data can be transferred wirelessly. Also, a calibrated time-of-day correction factor to improve the accuracy of our conversions. Additionally, it would be helpful to replace the air temperature sensor with a waterproof DS18B20 probe that can be suspended from the drone to make direct contact with the water surface (and possibly add sensors to collect other water quality readings), eliminating the need for the boundary layer correction, which would significantly improve measurement accuracy and therefore stress risk accuracy.
Built With
- claude
- noaa-water-temp-data
- python
- streamlit


Log in or sign up for Devpost to join the conversation.