-
-
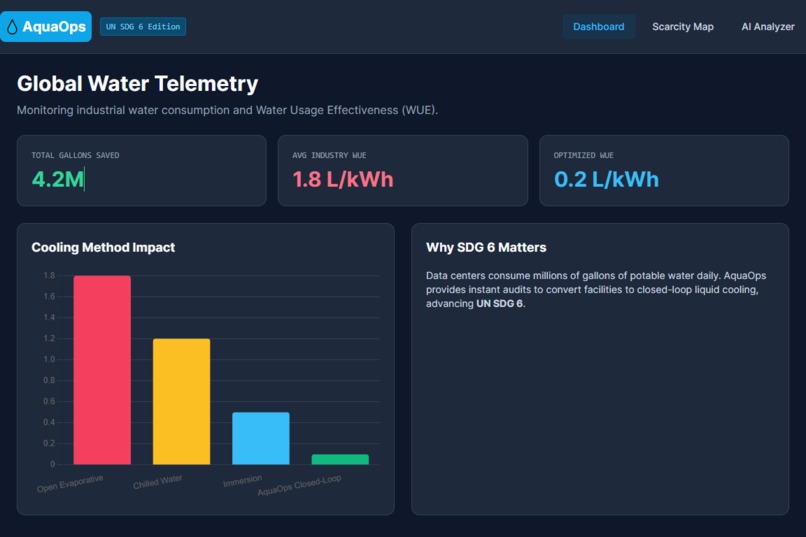
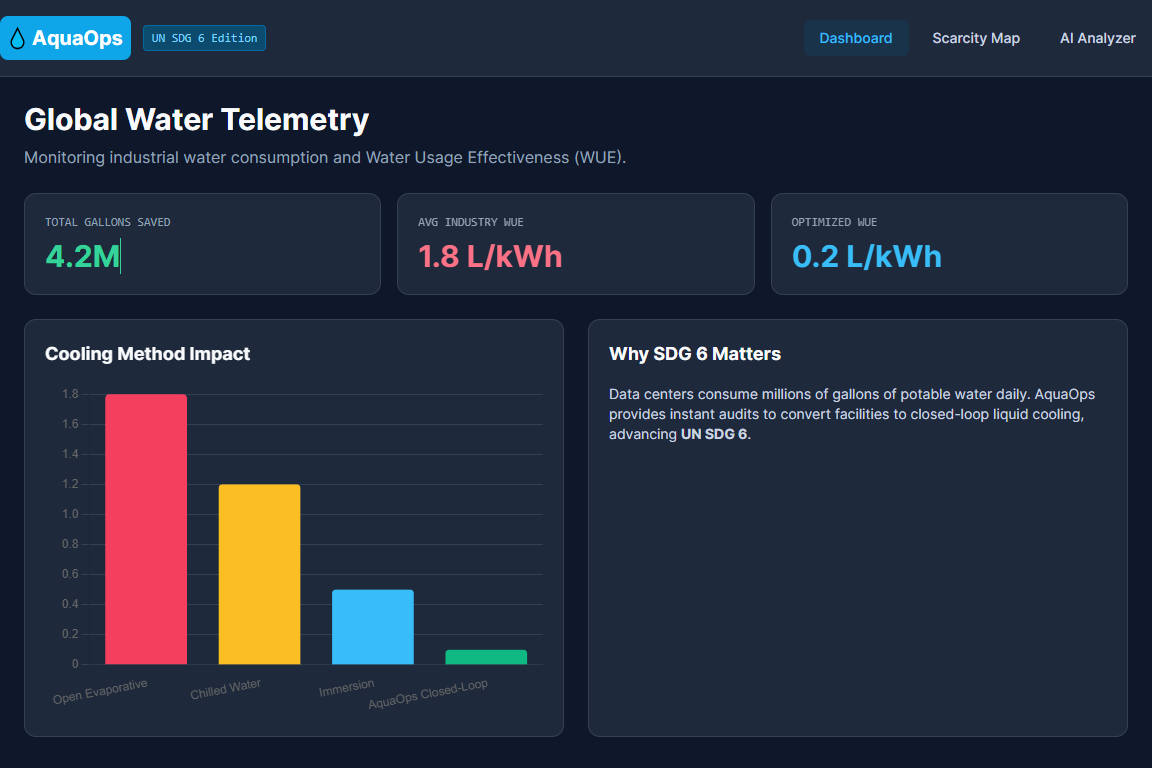
Executive dashboard comparing standard industrial cooling against AquaOps-optimized WUE, tracking millions of gallons saved globally.
-
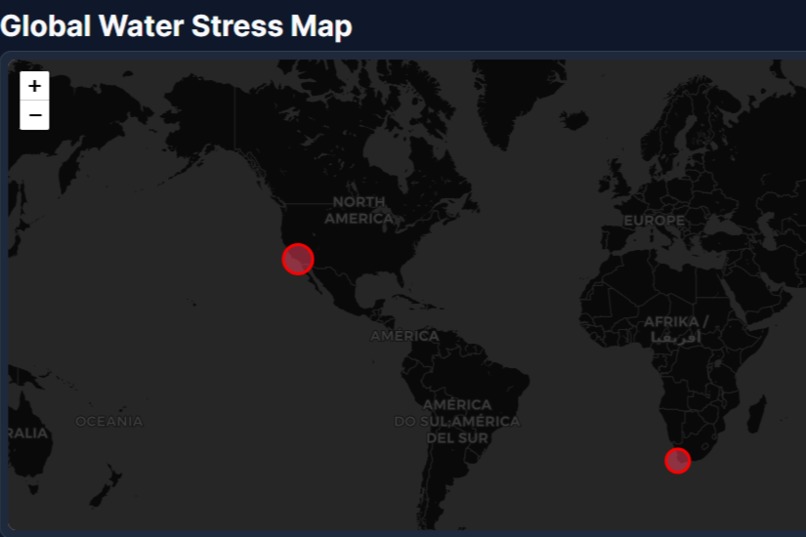
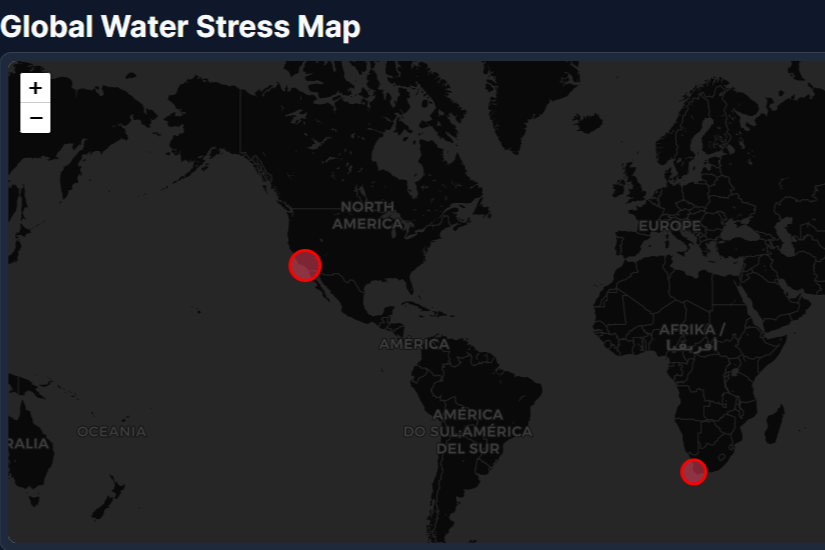
Risk assessment engine: An interactive map highlighting severe drought zones to prevent high-risk, water-intensive deployments.
-
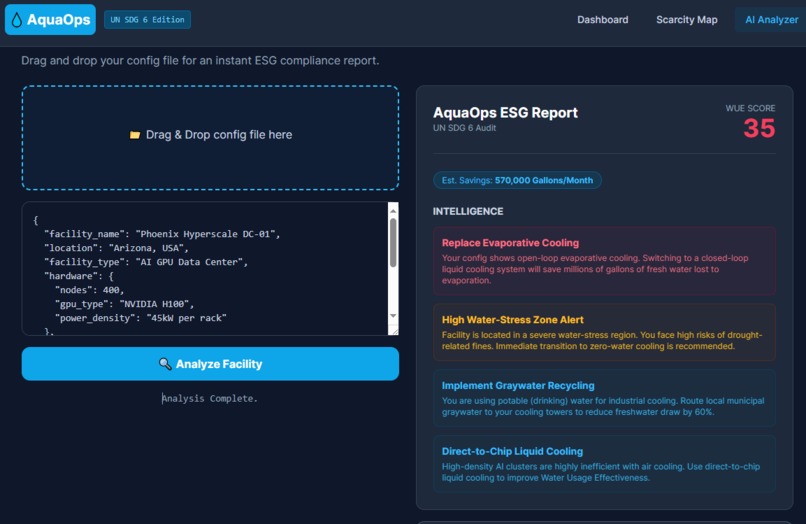
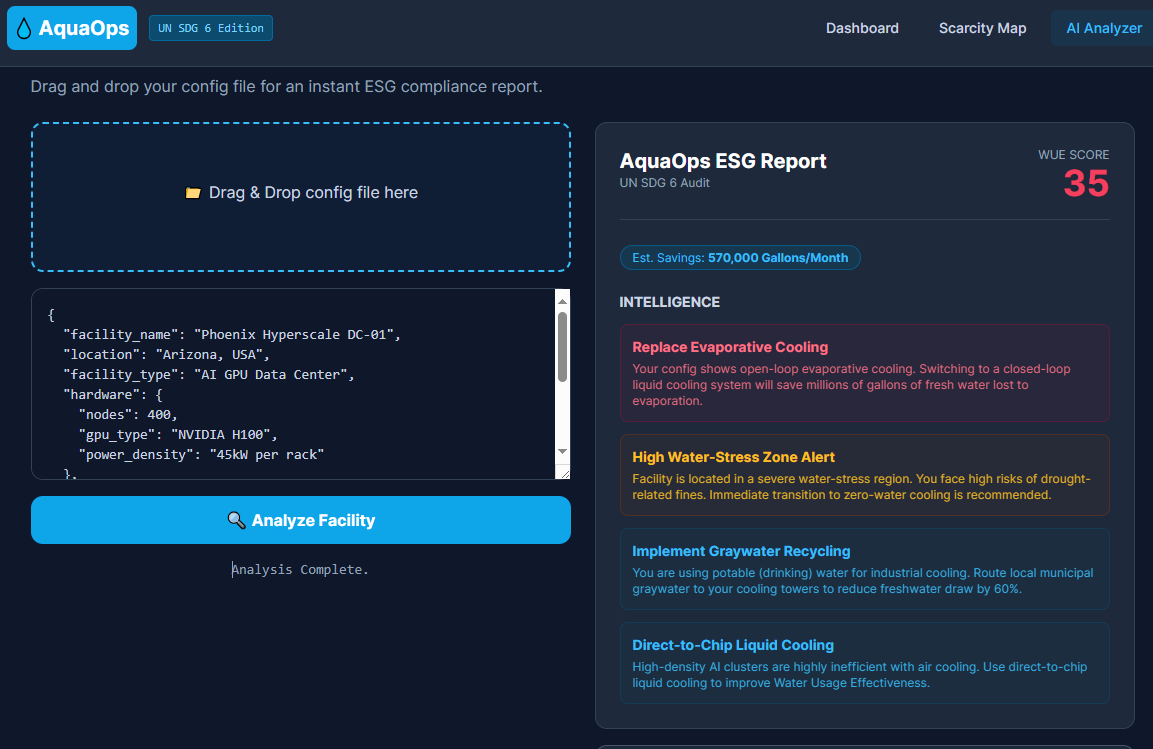
The BlueOps AI engine. A drag-and-drop interface that instantly audits cooling configs and generates UN SDG 6 ESG compliance PDFs.
Inspiration
When people think of UN SDG 6 (Clean Water and Sanitation), they often think of drinking water access. However, a massive, hidden drain on the global freshwater supply is industrial cooling. High-density AI data centers and manufacturing plants consume millions of gallons of potable water daily just to keep servers cool. As global water stress intensifies, relying on freshwater for industrial cooling is an existential threat to local communities. We realized that facility engineers lack modern, developer-friendly tools to measure and optimize their Water Usage Effectiveness (WUE). We built AquaOps to solve this.
What it does
AquaOps is an automated sustainability consultant for industrial water infrastructure. Facility managers can drag and drop their cooling system configuration files (like JSON or YAML) directly into our dashboard.
Our rules engine instantly parses the facility's architecture. It calculates a baseline WUE score, estimates potential water savings, and provides prioritized, actionable intelligence such as alerting engineers to switch from open-loop evaporative cooling to closed-loop liquid cooling or routing municipal graywater to cooling towers.
The platform generates five specific deliverables, including cleaned datasets mapped to global water stress zones and real-time business dashboards for executive oversight. Finally, with a single click, teams can export an official ESG PDF Report to demonstrate UN SDG 6 compliance to regulators.
How we built it
We designed AquaOps as a highly responsive, serverless web application to guarantee zero-latency processing:
Frontend: We built a high-contrast, modern UI using HTML5 and Tailwind CSS.
Data Visualization: We integrated Chart.js to build the business dashboards comparing cooling method consumption and Leaflet.js to render our cleaned datasets into an interactive Global Water Scarcity Heatmap.
The Rules Engine: To ensure 100% uptime and immediate feedback, we engineered the AI analysis logic directly into the client-side JavaScript. This "edge-computed" approach allows the app to parse complex configurations and generate recommendations securely within the user's browser without relying on external API calls or database latency.
Export Engine: We utilized html2pdf.js to dynamically convert the DOM into structured corporate reports.
Challenges we ran into
Our primary challenge was deployment architecture. Initially, we planned a decoupled Python/FastAPI backend to handle the parsing logic. However, managing server cold-starts and cross-origin resource sharing (CORS) timeouts threatened the user experience. We pivoted our architecture, refactoring the Python logic into an advanced client-side JavaScript rules engine. This pivot eliminated backend latency entirely, resulting in a lightning-fast, self-contained application hosted seamlessly on GitHub Pages.
We also faced challenges sourcing and formatting the geospatial coordinates for the severe drought zones to ensure the Leaflet map accurately reflected real-world water scarcity.
Accomplishments that we're proud of
We are incredibly proud of identifying a highly niche, B2B problem within the SDG 6 framework. While many projects focus on consumer water tracking, we targeted the enterprise level where millions of gallons can be saved with a single architectural change. We successfully combined complex industrial engineering concepts (like Water Usage Effectiveness) into a beautiful, intuitive drag-and-drop UI that generates immediate business value.
What we learned
We learned a massive amount about industrial hydro-engineering and the specific cooling requirements of modern GPU clusters. Technically, we mastered serverless deployment strategies and learned how to manipulate the browser's DOM dynamically to prevent formatting errors when exporting complex HTML dashboards to PDF.
What's next for AquaOps
Our next milestone is hardware integration. We plan to build an API layer that connects AquaOps directly to IoT flow meters and chiller sensors inside actual data centers. Instead of relying on static configuration files, AquaOps will ingest live telemetry data, creating a real-time digital twin of the facility's water infrastructure to dynamically adjust cooling set points minute by minute.
Built With
- chart.js
- github
- html2pdf.js
- html5
- javascript
- leaflet.js
- tailwindcss

Log in or sign up for Devpost to join the conversation.