-
-
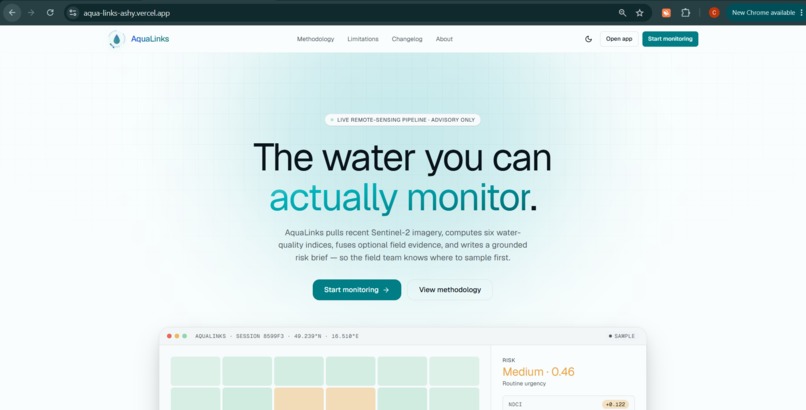
Landing Page - Light
-
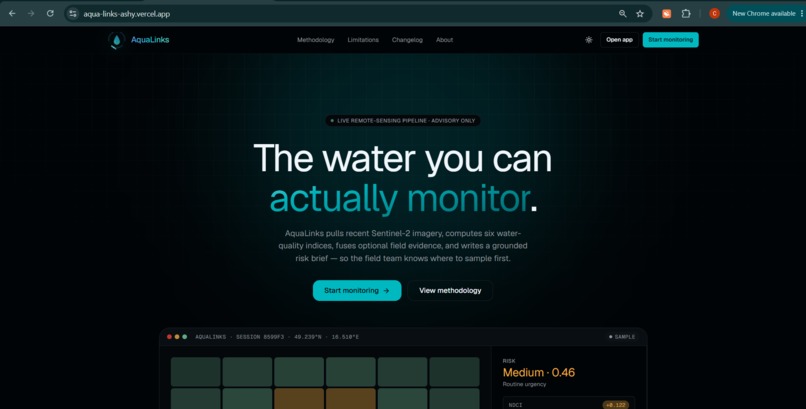
Landing Page - Dark
-
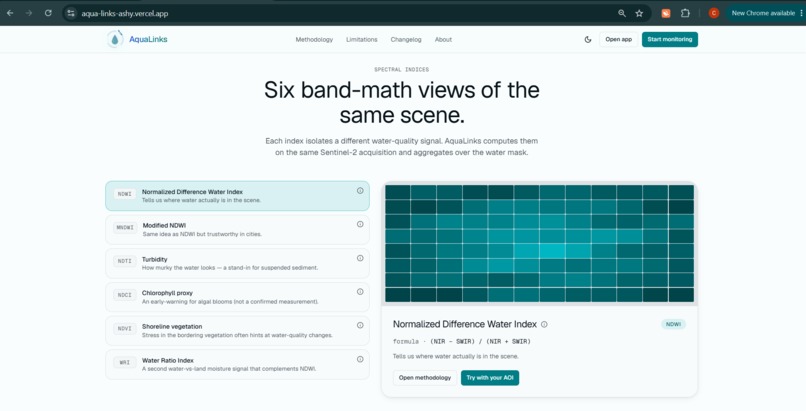
Features
-
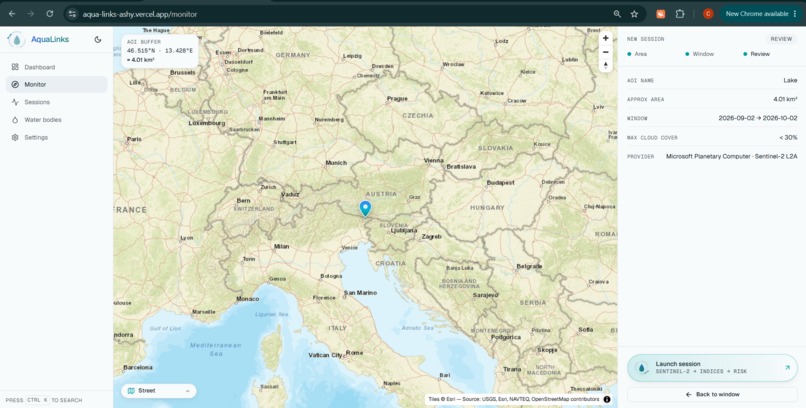
Map
-
Sessions
-
Dashboard
Inspiration
Cities grow fast. Their rivers, lakes, and streams receive waste, runoff, and algae growth.
The old method needs a person to visit the water body and send a sample to a laboratory. This method is slow and covers few locations. As a result, cities and citizens often learn about a polluted water body after the problem is serious.
The IEEE OneAquaHealth Global Hackathon asks teams to connect urban water health to the health of people and animals. We built a tool that gives a first answer from space. A user does not need sensors or a site visit.
What it does
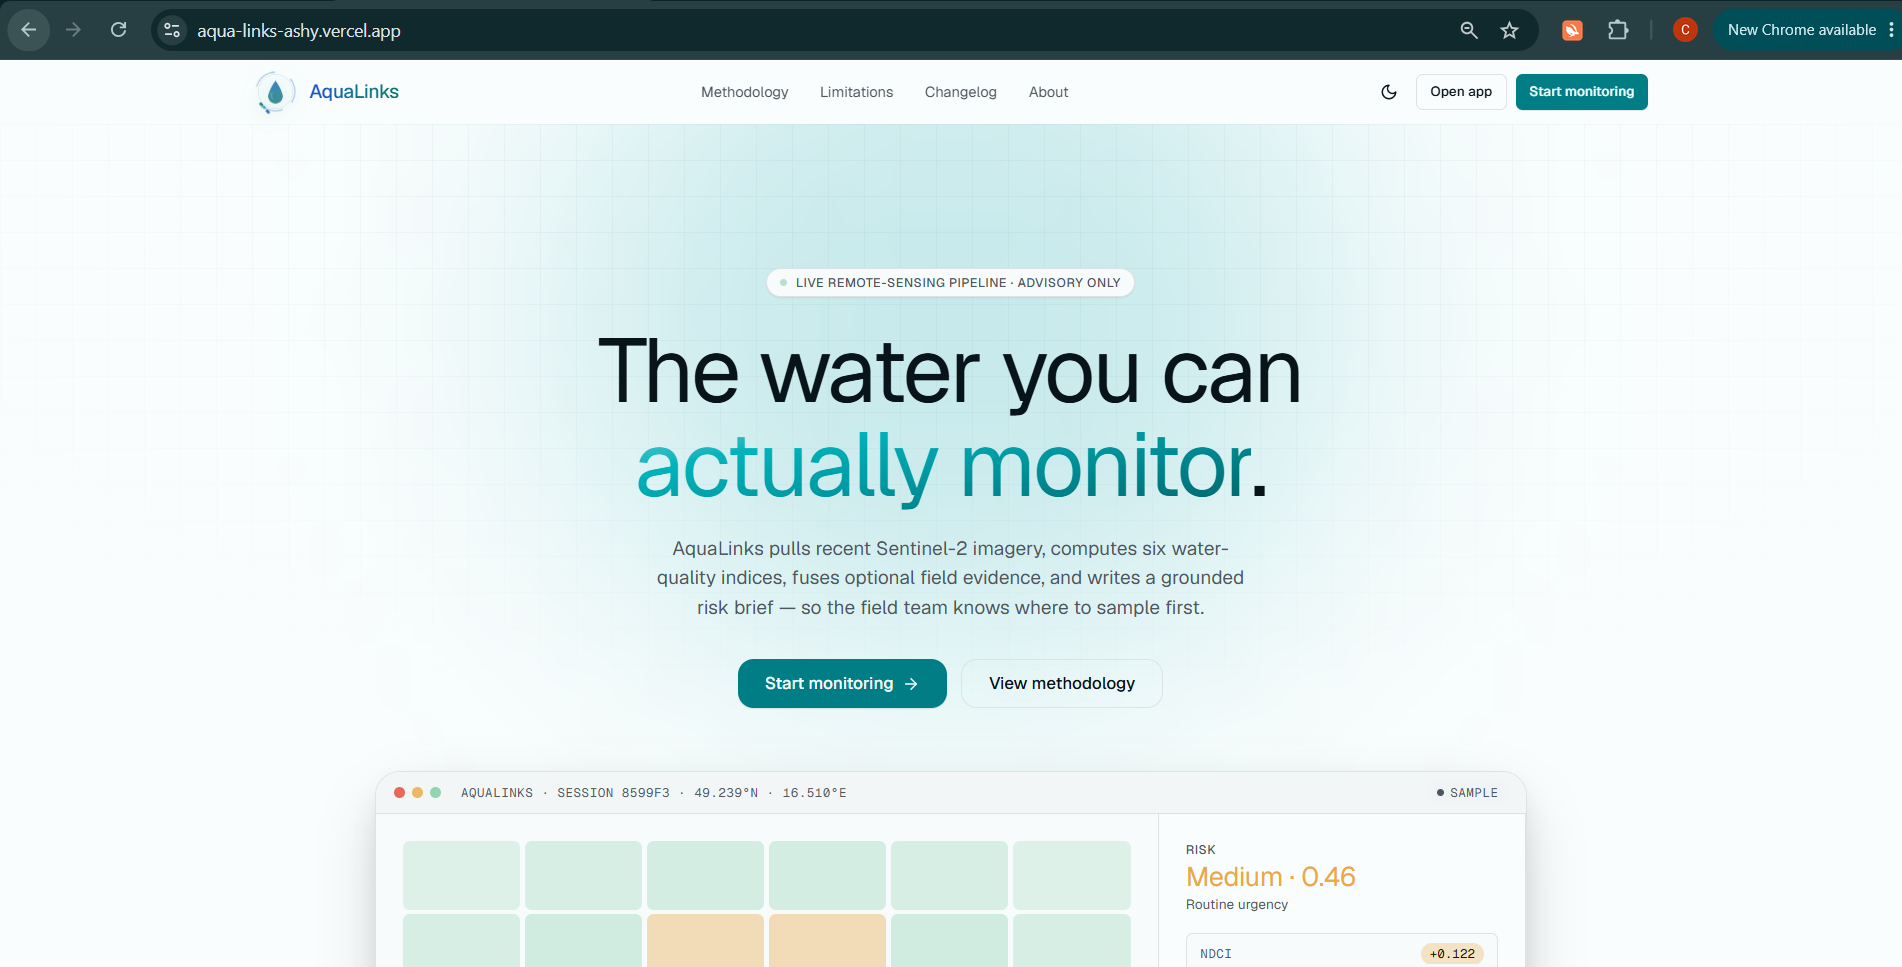
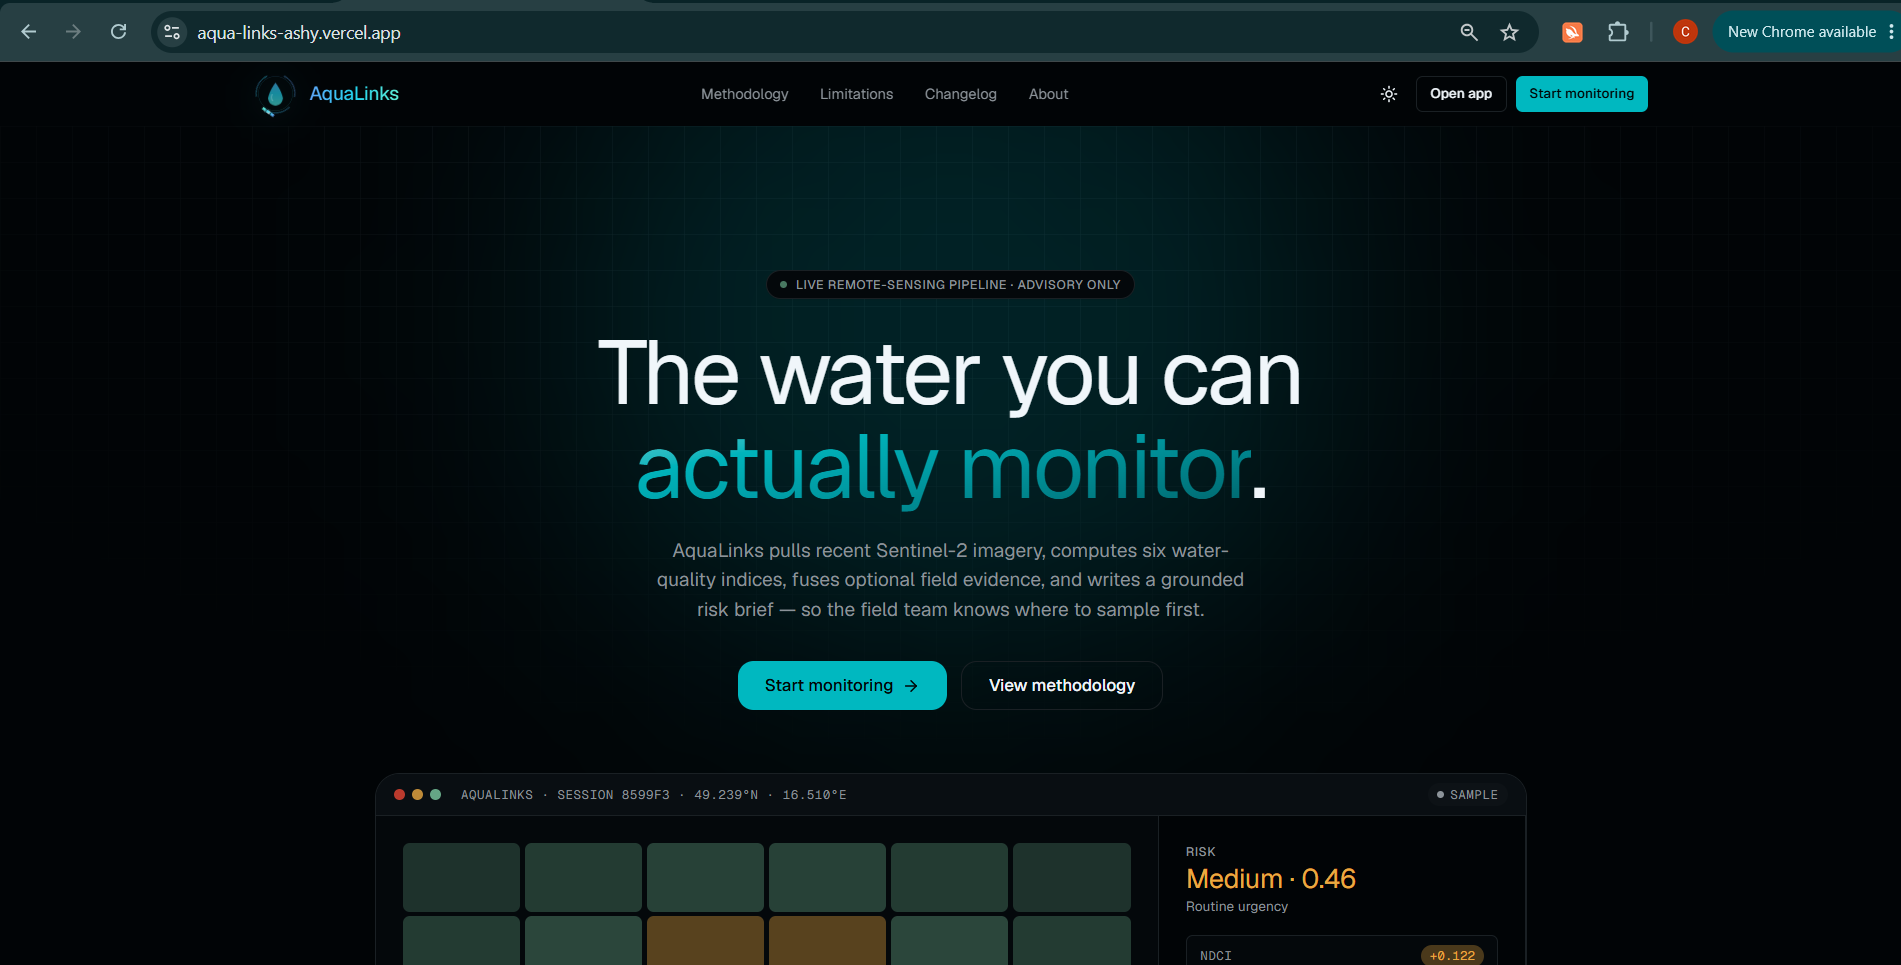
AquaLinks checks the pollution risk of a lake, river, or stream from satellite images.
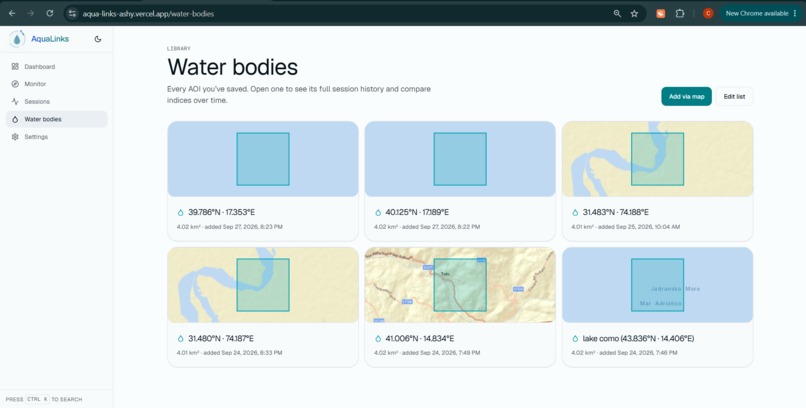
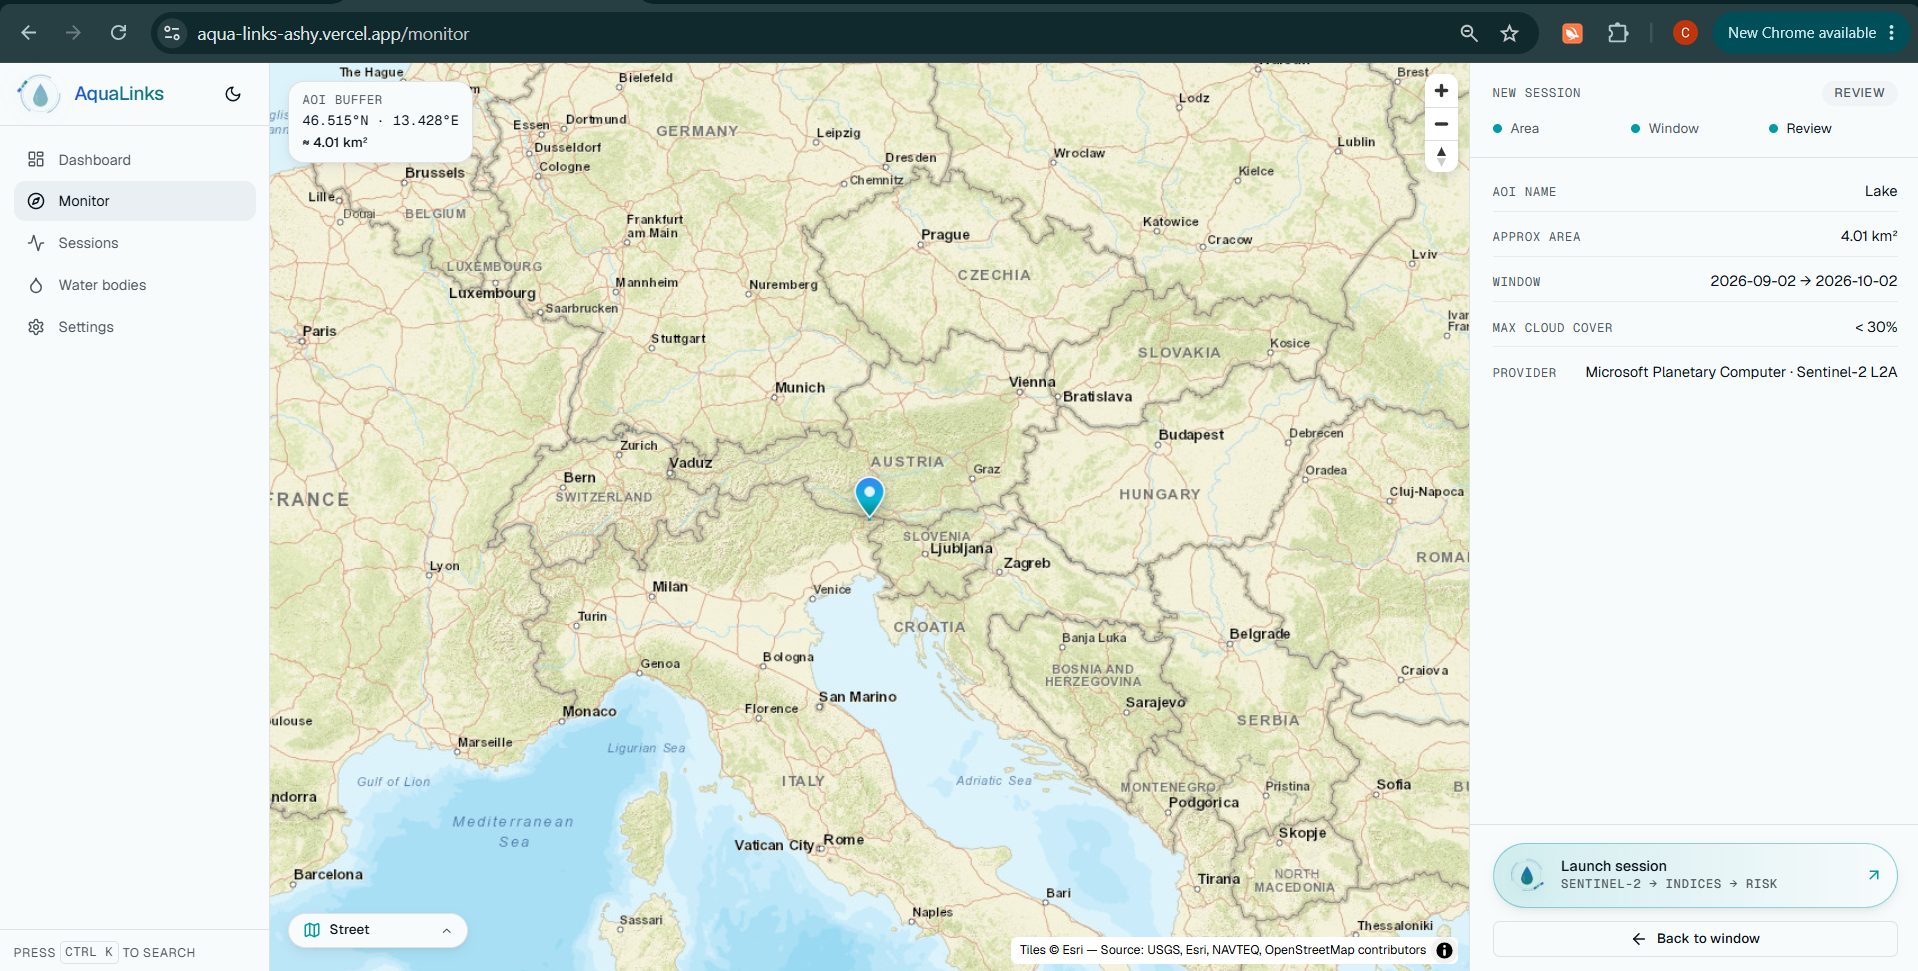
A user picks a place by name search, by coordinates, or by a click on the map. For a map click, AquaLinks draws a square of about 1 km around the point. Then it downloads a recent, low-cloud Sentinel-2 image of that area.
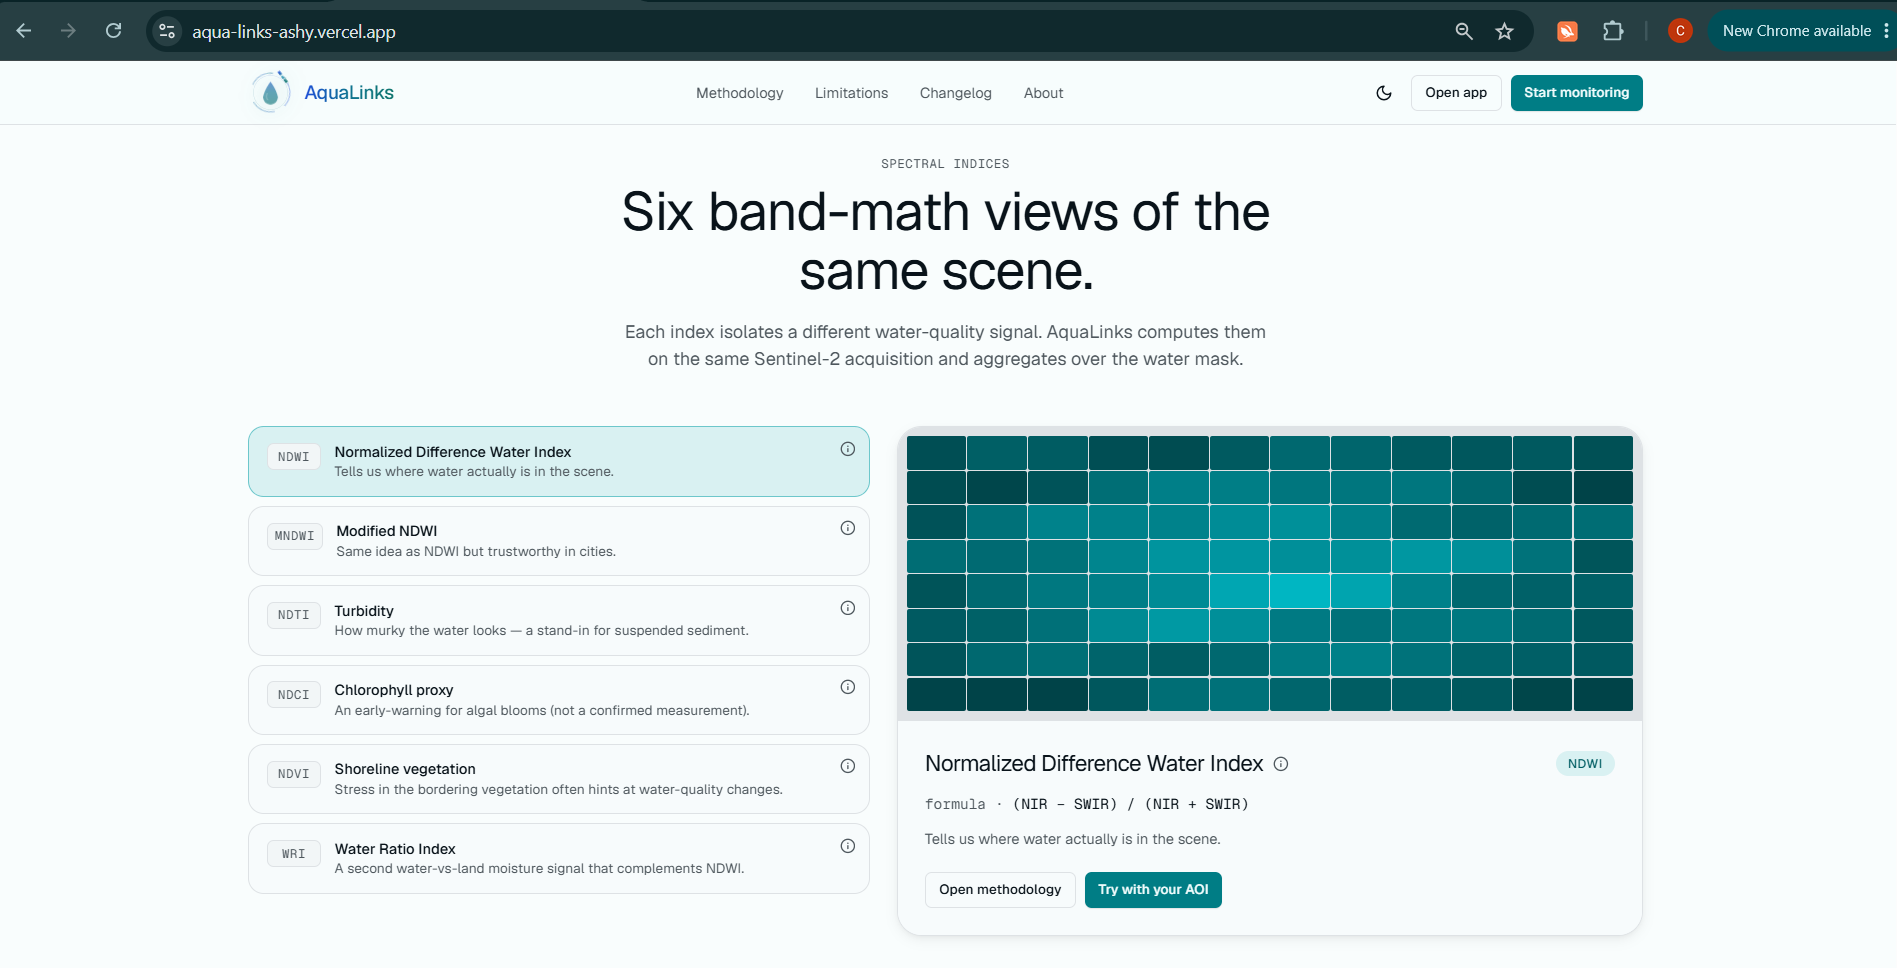
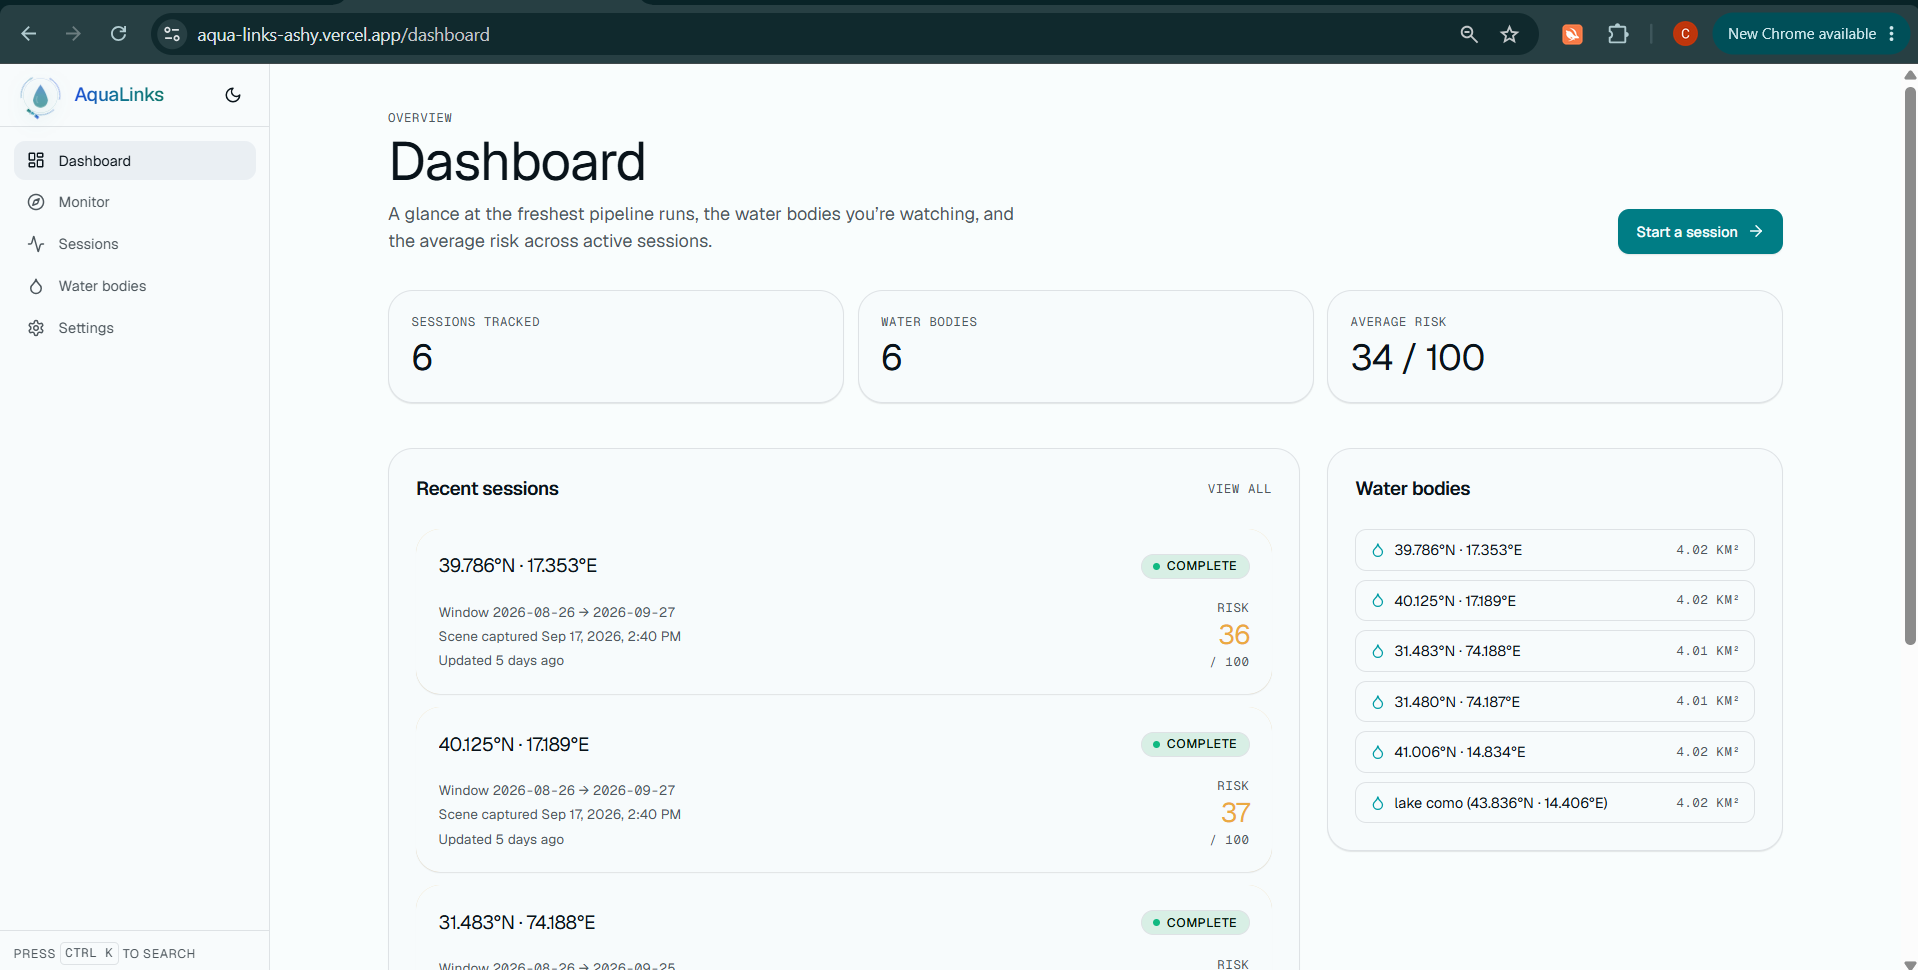
AquaLinks measures six spectral indices over the water: NDWI, MNDWI, NDTI, NDCI, NDVI, and WRI. From these values, it calculates a risk score, a risk level, and an urgency level. The score runs from 0 to 100 percent. The urgency is routine, elevated, or immediate.
Fixed math makes the score. The AI cannot change it.
If the area is mostly water, five AI agents write the report. Experts get a technical analysis. The public gets a short citizen summary. The session page shows every agent step.
Users can also:
- Add field evidence, such as water color, odor, algae, dead fish, or a photo. New evidence re-scores the session.
- Download a branded PDF report.
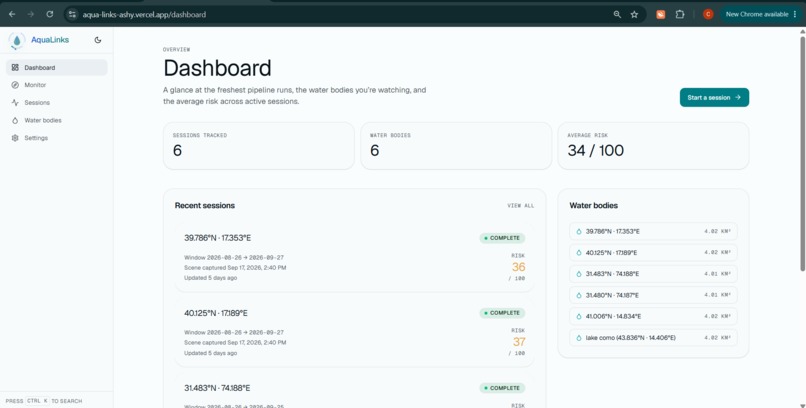
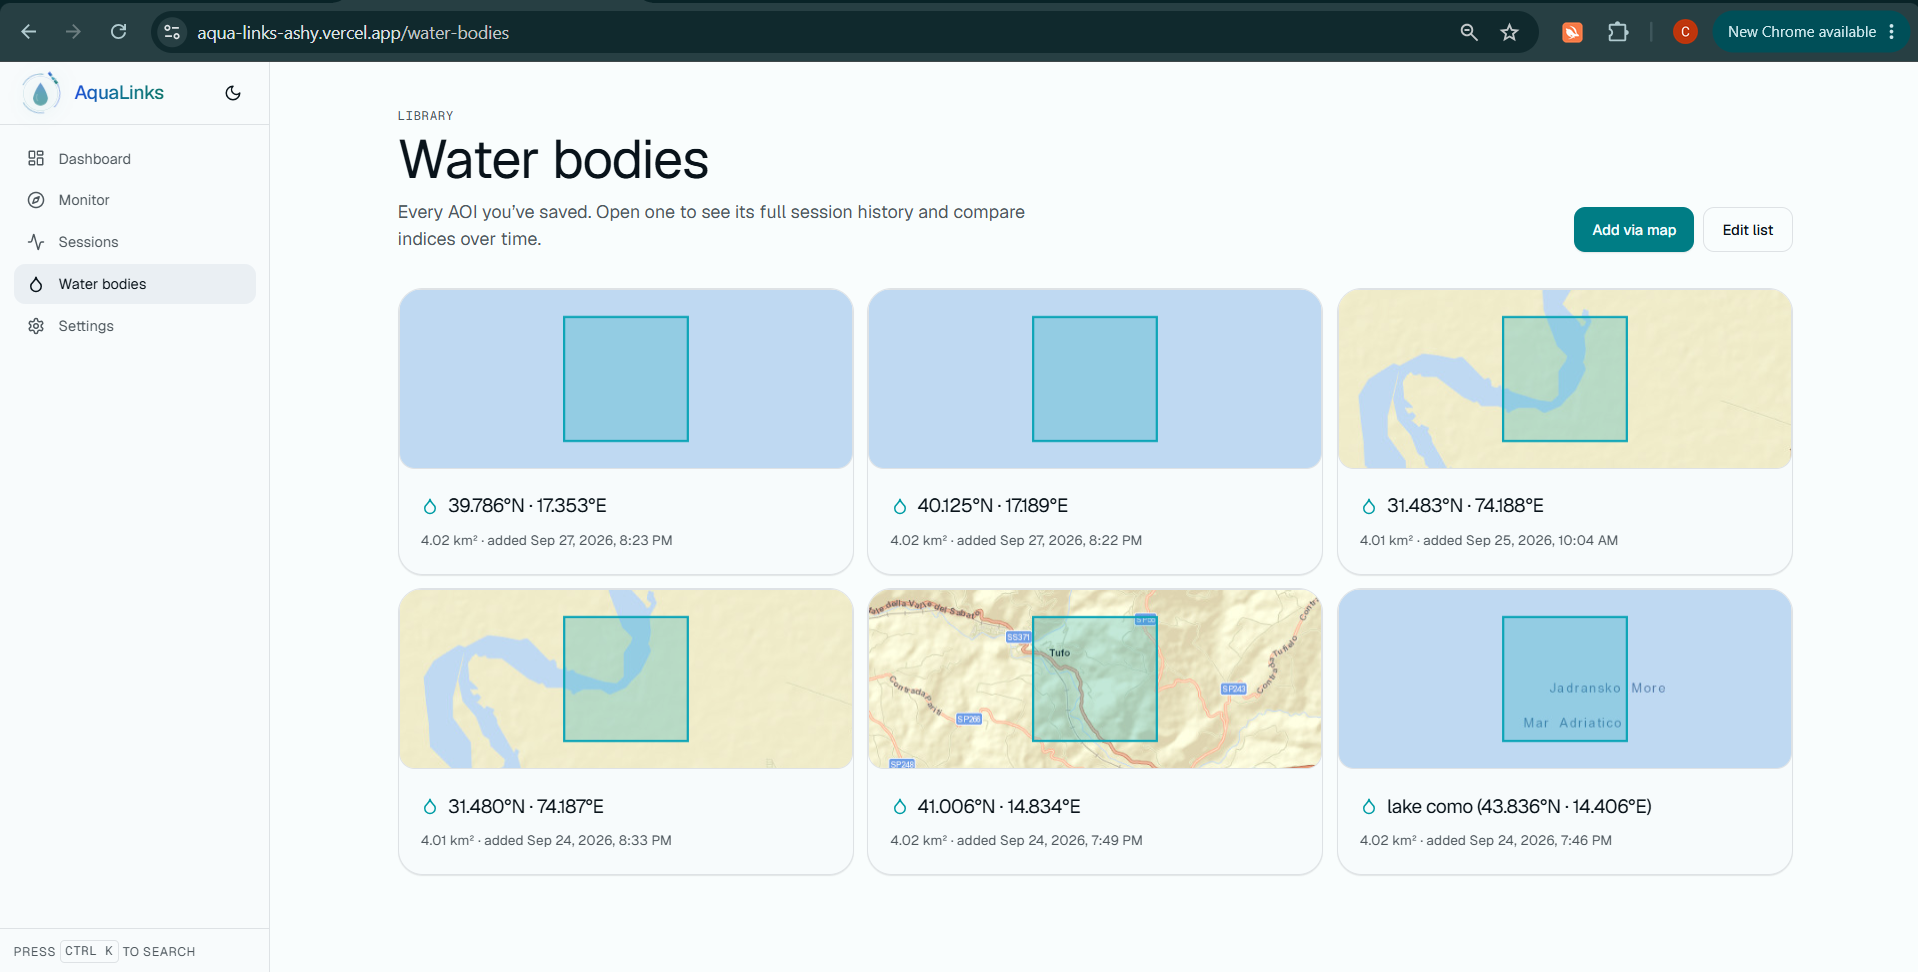
- See past checks of the same water body.
AquaLinks supports three hackathon tracks: AI-Supported Assessment, Data-to-Insight, and Resilience Informatics.
How we built it
AquaLinks has two linked pipelines.
Pipeline 1 is the score pipeline. It fetches Sentinel-2 L2A images from the Microsoft Planetary Computer. Pure Python functions with numpy compute the six indices. A weighted sum turns them into the score. The NDCI chlorophyll signal has the largest weight at 0.40. Turbidity (NDTI) comes next at 0.25. The same input always gives the same score.
The system also measures the water fraction of each area. An area is water, mixed, or land. Pipeline 2 runs only for water.
Pipeline 2 is the report pipeline. Five agents run on Groq with the openai/gpt-oss-120b model:
- Coordinator: plans which agents run and sets a budget for each.
- Scout: finds a readable place name when the water body name is weak. The fixed pipeline picks the satellite scene.
- Historian: builds a briefing from past sessions and the web. It uses database tools, a trend slope for each metric, memory notes, and web search through Tavily or DuckDuckGo. It runs only when the water body has an earlier session.
- Analyst: writes the recommendation, reasoning, and limitations. It drafts, critiques, and rewrites at most once.
- Reporter: writes the citizen summary as structured JSON.
The backend uses FastAPI, SQLModel, and Alembic. The frontend uses Next.js 15, Tailwind, TypeScript, and MapLibre. PostgreSQL with PostGIS stores the data, and pgvector is optional. The agent_traces table stores each plan, tool call, output, latency, and token count. WeasyPrint and Jinja2 create the PDF. The backend runs on Railway, the frontend runs on Vercel, and the database runs on Supabase. GitHub Actions runs the tests on every pull request.
Challenges we ran into
The AI must not change the score. We split the system into two pipelines. Pipeline 1 calculates the score. Pipeline 2 only reads it.
Groq has rate limits. A limit can stop a session. The runtime waits for a cooldown and retries the request.
Groq has no embeddings, search grounding, or code execution. We used web search for context and a linear trend slope for history. Memory recall uses a hash-based stand-in for embeddings, so similarity scores are not yet meaningful.
Some areas are not water. An area with a low water fraction is land or mixed. AquaLinks skips the agents for these areas and shows a "Not water" badge.
Any agent can fail. Each agent has a fixed fallback. The session always finishes, and the trace records every failure.
Accomplishments that we're proud of
- The risk score is deterministic, unit-tested, and the same on every run.
- A user can see every step of every agent, with tool calls, latency, and token usage.
- Every agent has a fallback, so a session always finishes.
- One check gives two outputs: a technical report for experts and a simple summary for citizens.
- Field evidence re-scores a session, so a human can add real observations.
- The backend has about 100 tests. The end-to-end test runs with sample imagery and a fake LLM, so it needs no network or API key.
- The live app is deployed and covers three hackathon tracks.
What we learned
- Measurement and explanation need separate steps. Math gives the number. The AI explains it.
- Saved traces build trust. A user can check each AI step.
- Every external service fails at some point. A fallback for each service keeps the product working.
- A water mask must come first. Indices over land give wrong risk scores.
- A change of AI provider changes the tools. We replaced three Gemini features with web search and a trend slope.
What's next for AquaLinks
- Replace the stand-in embeddings with a real embeddings endpoint.
- Add a forecasting layer to the urgency score for early warnings (Track 6).
- Export session risk data in FHIR format for public-health systems (Track 7).
- Add engagement features for citizen contributors (Track 5).
Built With
- alembic
- docker
- fastapi
- gpt-oss-120b
- groq
- jinja
- maplibre
- next.js
- numpy
- pgvector
- postgis
- postgresql
- pydantic
- python
- railway
- react
- sentinel-2
- sqlmodel
- supabase
- tailwindcss
- typescript
- vercel
- weasyprint

Log in or sign up for Devpost to join the conversation.