-
-
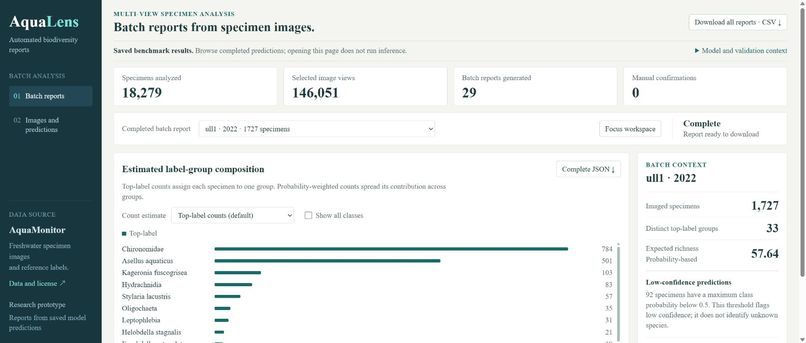
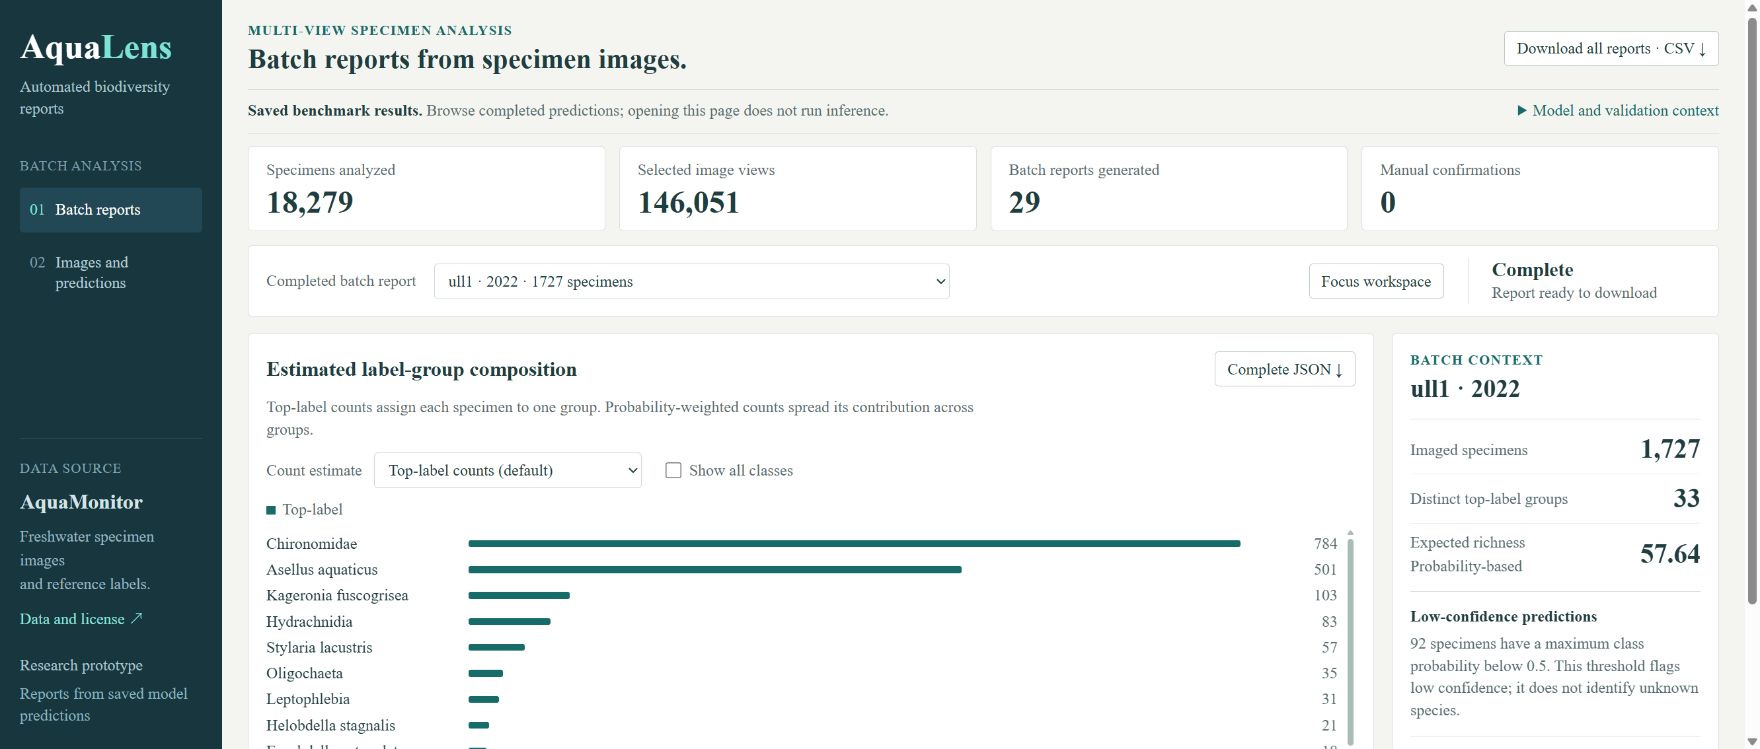
Site-year reports with predicted organism counts, label-group richness estimates, and downloadable results.
-
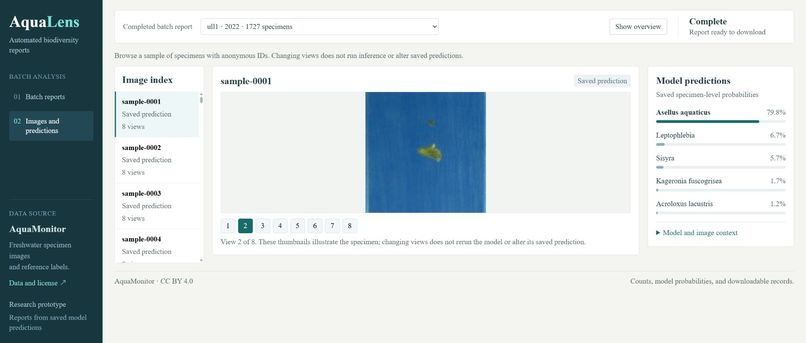
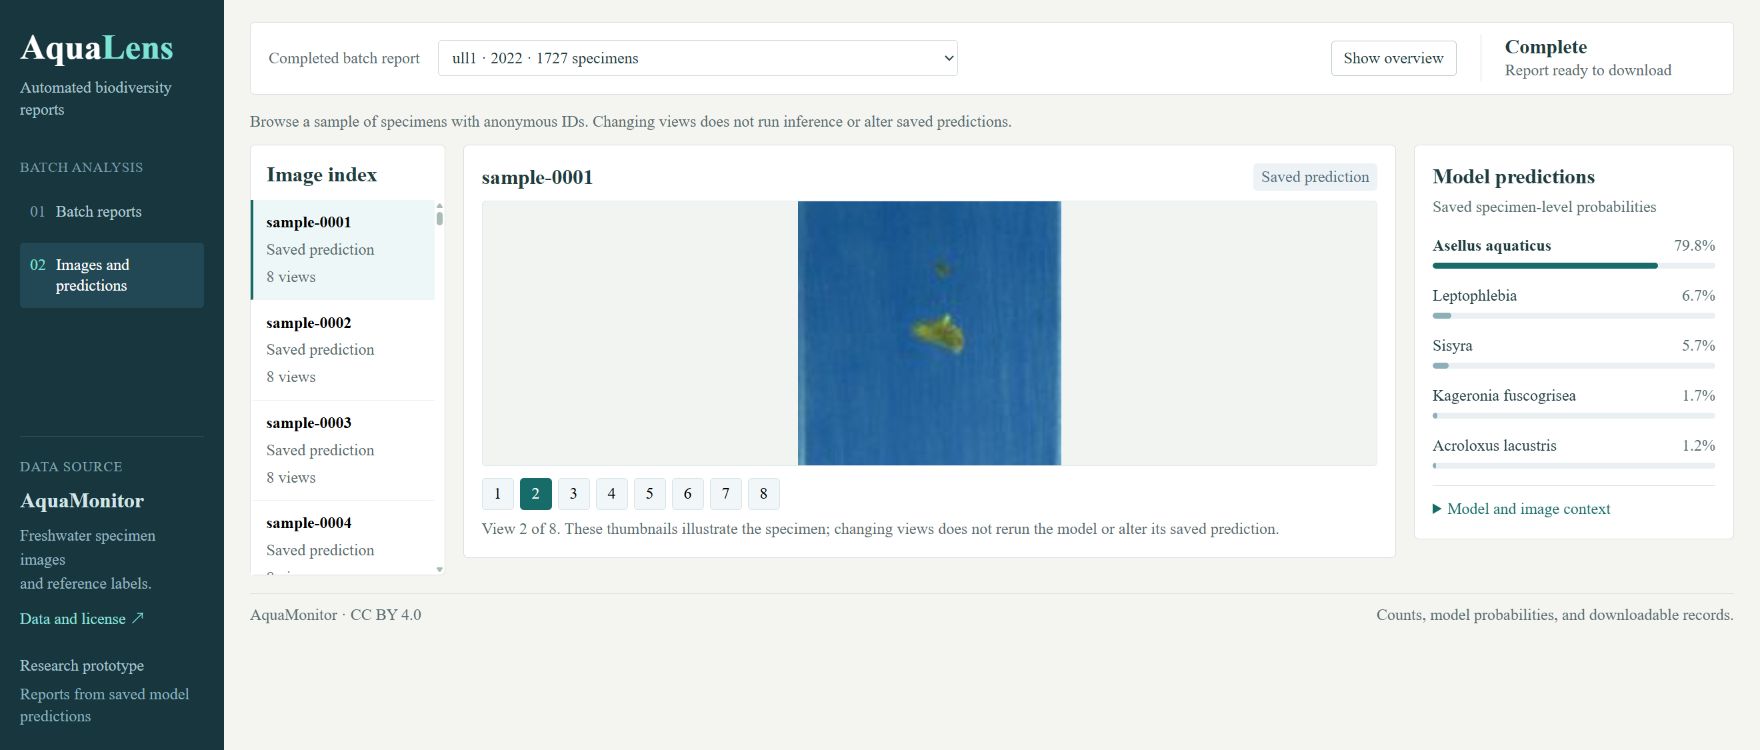
Multiple views of a freshwater specimen alongside its saved predictions and class probabilities.
-
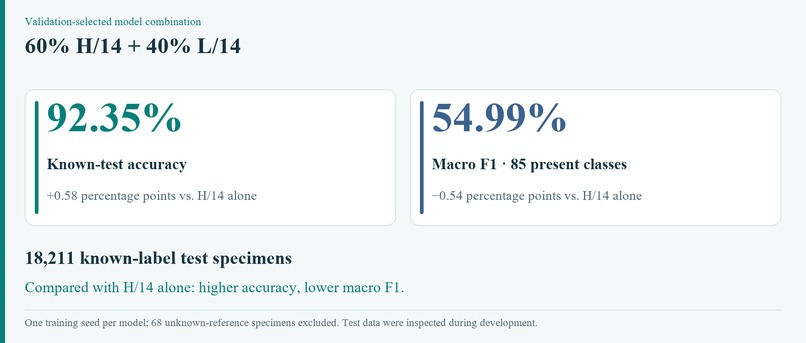
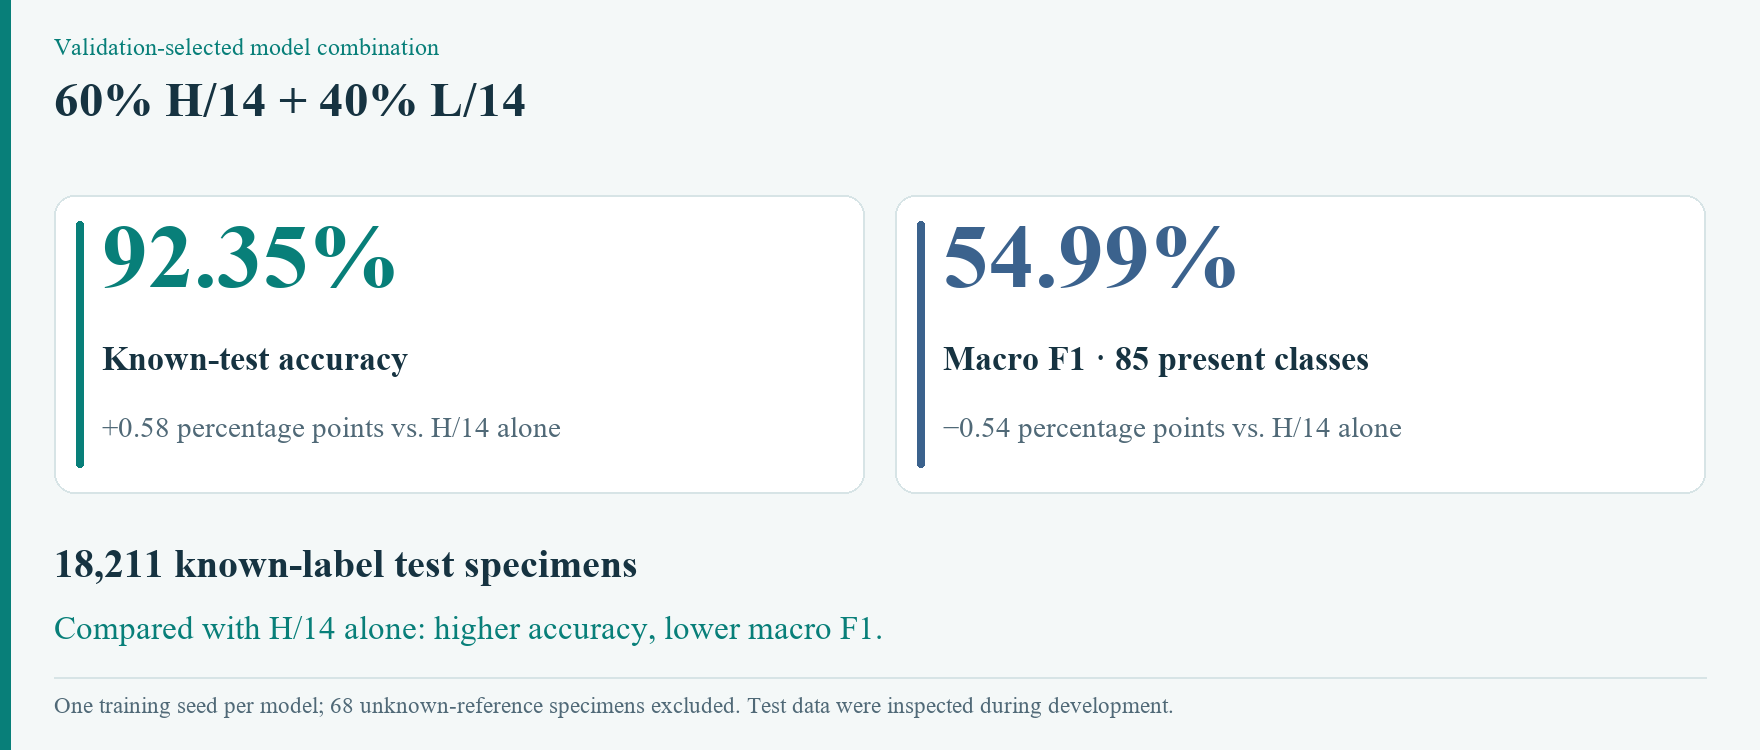
Combined model: 92.35% accuracy on 18,211 known-label specimens; 54.99% macro F1 across 85 test-present classes.
Inspiration
Recognizing an organism in an image is only part of freshwater monitoring. The next question is what many individual predictions tell us about a sample.
AquaLens connects specimen recognition with reports that monitoring analysts and researchers can inspect, compare, and reuse. The project addresses Track 2: Data-to-Insight through biodiversity reporting. Our starting benchmark uses laboratory images of freshwater specimens from Finnish lakes; applying the workflow to citizen-collected urban-stream images is a future step.
What it does
AquaLens groups specimen predictions by sampling site and year. Users can compare predicted organism counts, inspect label-group richness estimates, examine low-confidence predictions, and download CSV or JSON reports.
The demonstration includes 29 reports covering 18,279 test specimens. An image browser displays 200 example specimens through 1,600 views, alongside their saved predictions.
The public website opens without installation and displays completed benchmark results. A separate command-line tool runs the trained H/14 model on new specimen images and generates reports when the checkpoint is available.
How we built it
We used Python, PyTorch, and OpenCLIP to adapt BioCLIP 2 L/14 and BioCLIP 2.5 H/14. Both model branches used the same specimen split and selected views from the public AquaMonitor dataset: 43,189 specimens and 345,030 selected images.
Each branch included a frozen-encoder control and six epochs of full visual fine-tuning. The branches ran independently on two machines, then their specimen predictions were aligned and combined. Validation data selected the checkpoints, calibration temperatures, and a mixture of 60% H/14 and 40% L/14.
We built the reporting pipeline, estimator comparisons, downloadable records, and an HTML/CSS/JavaScript interface. GitHub Pages serves the public demonstration without a model server.
Challenges we faced
The larger visual encoder required careful memory management. Mixed precision, gradient checkpointing, and gradient accumulation made training possible within the available GPU memory.
The statistical challenge was equally important: a model can classify more specimens correctly while producing worse estimates of biodiversity. We therefore evaluated specimen classification, group counts, and richness separately.
The dataset also contains labels at different taxonomic ranks and life stages. We report label-group richness rather than presenting every label as a distinct species.
Results and what we learned
The validation-selected mixture achieved 92.35% accuracy and 54.99% macro F1 across 85 test-present classes, evaluated on 18,211 known-label specimens.
Compared with fine-tuned H/14 alone, the mixture increased accuracy by 0.58 percentage points but reduced macro F1 by 0.54 points. L/14 fine-tuning improved classification and count estimates while worsening richness estimates.
These tradeoffs shaped the interface: users can compare count estimators and inspect confidence instead of receiving a single unexplained biodiversity score.
Our contribution is the working connection from multiview recognition to inspectable batch reports, together with an evaluation of how model choices affect those reports. Report generation requires no new annotation or manual confirmation.
What comes next
The next step is independent evaluation on imagery from new locations and capture conditions, followed by testing compatibility with citizen-science workflows.
The current experiments use one training seed per model and a test split inspected during development. Reports describe the imaged samples; field performance, whole-waterbody biodiversity, and human-health benefits have not been established.
Credits
AquaMonitor provides the dataset and specimen imagery under CC BY 4.0. Recognition models build on BioCLIP 2 and BioCLIP 2.5. Dataset, model, and software references are documented in the repository.
Built With
- css
- github
- html
- huggingface
- javascript
- numpy
- openclip
- pandas
- python
- pytorch
- scikit-learn


Log in or sign up for Devpost to join the conversation.