-
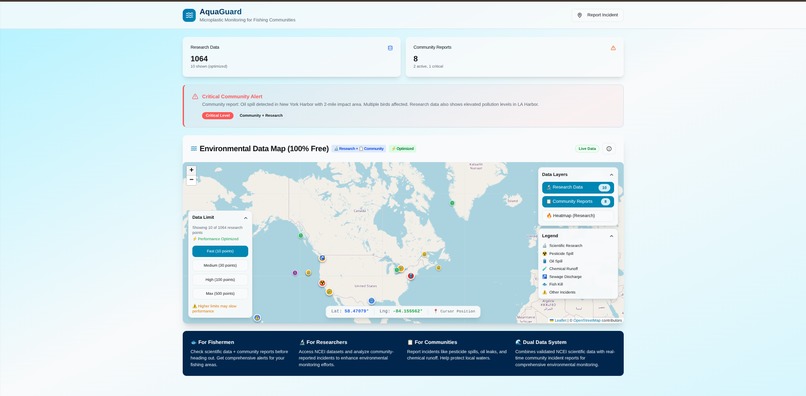
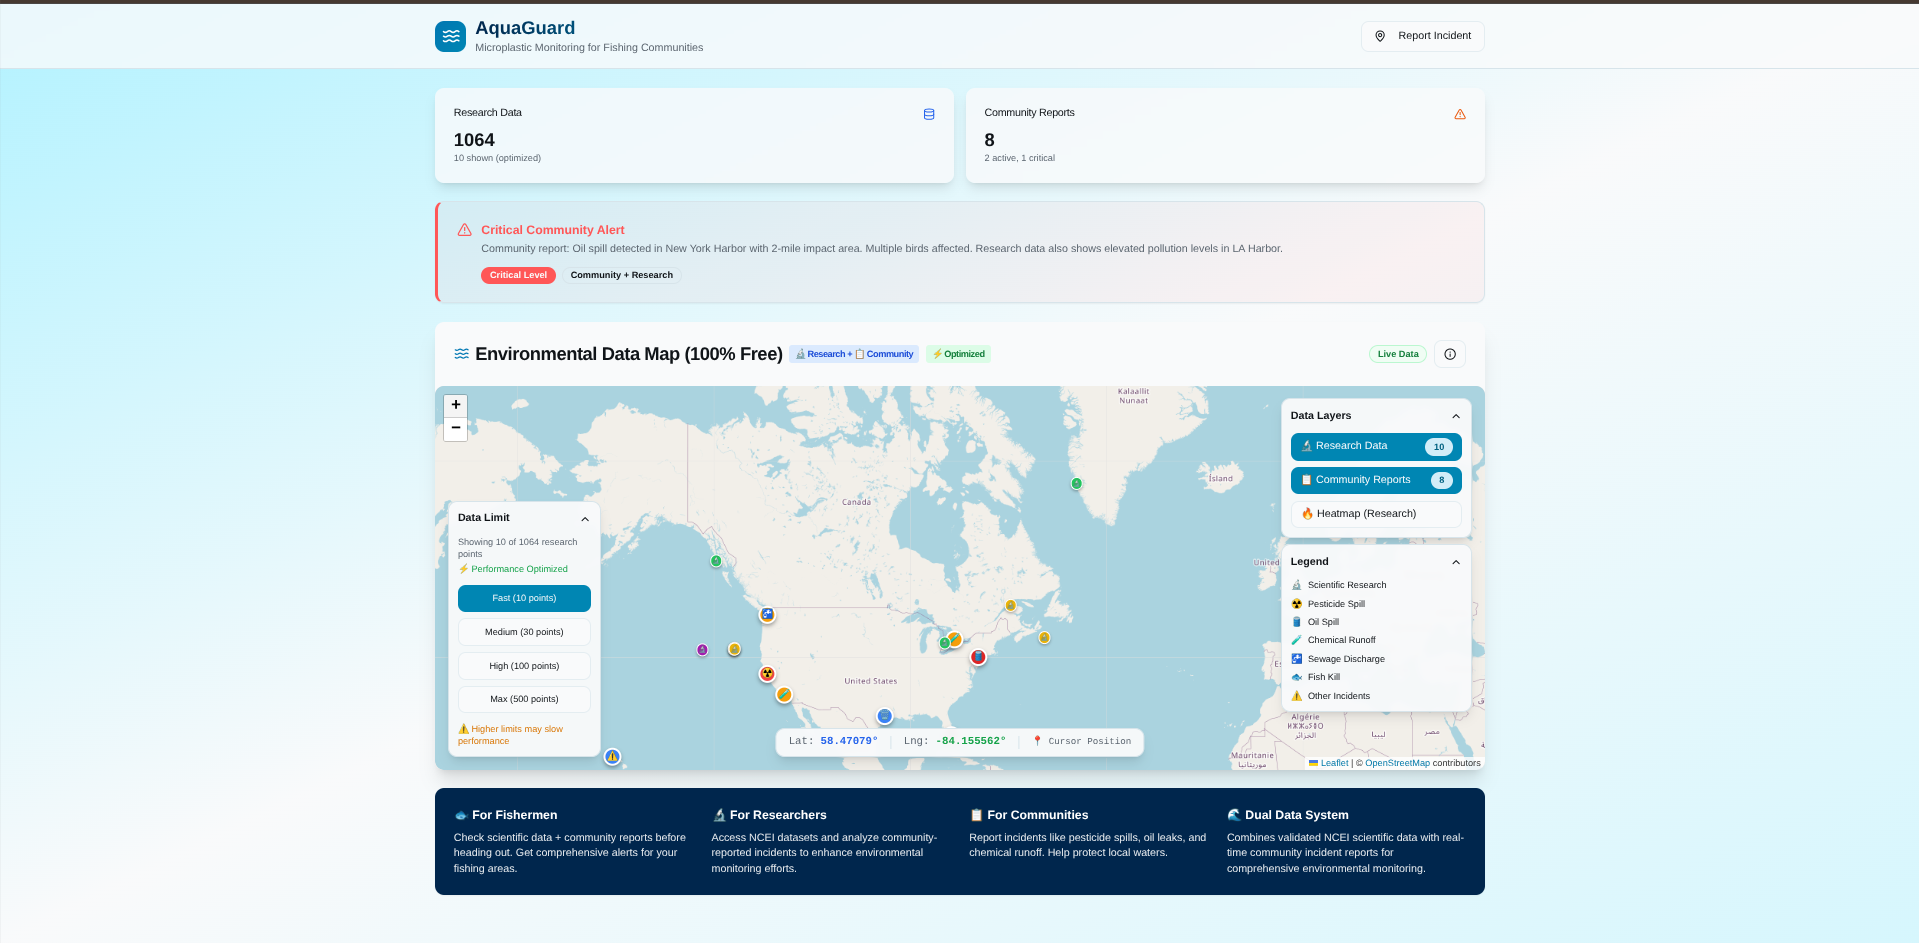
Final version of the website after designing the user interface with Builder.io
-
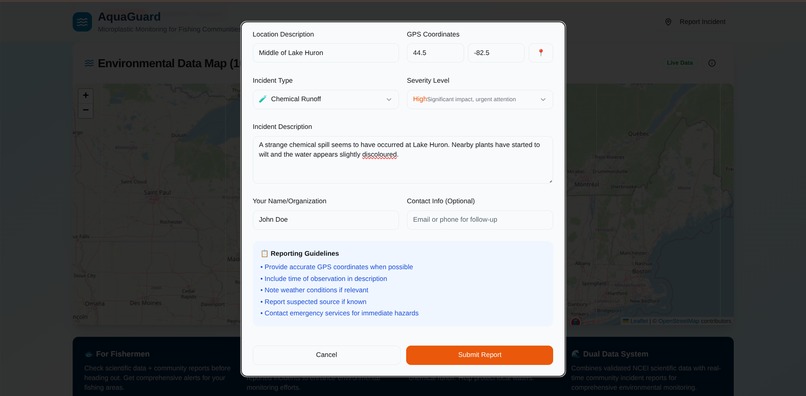
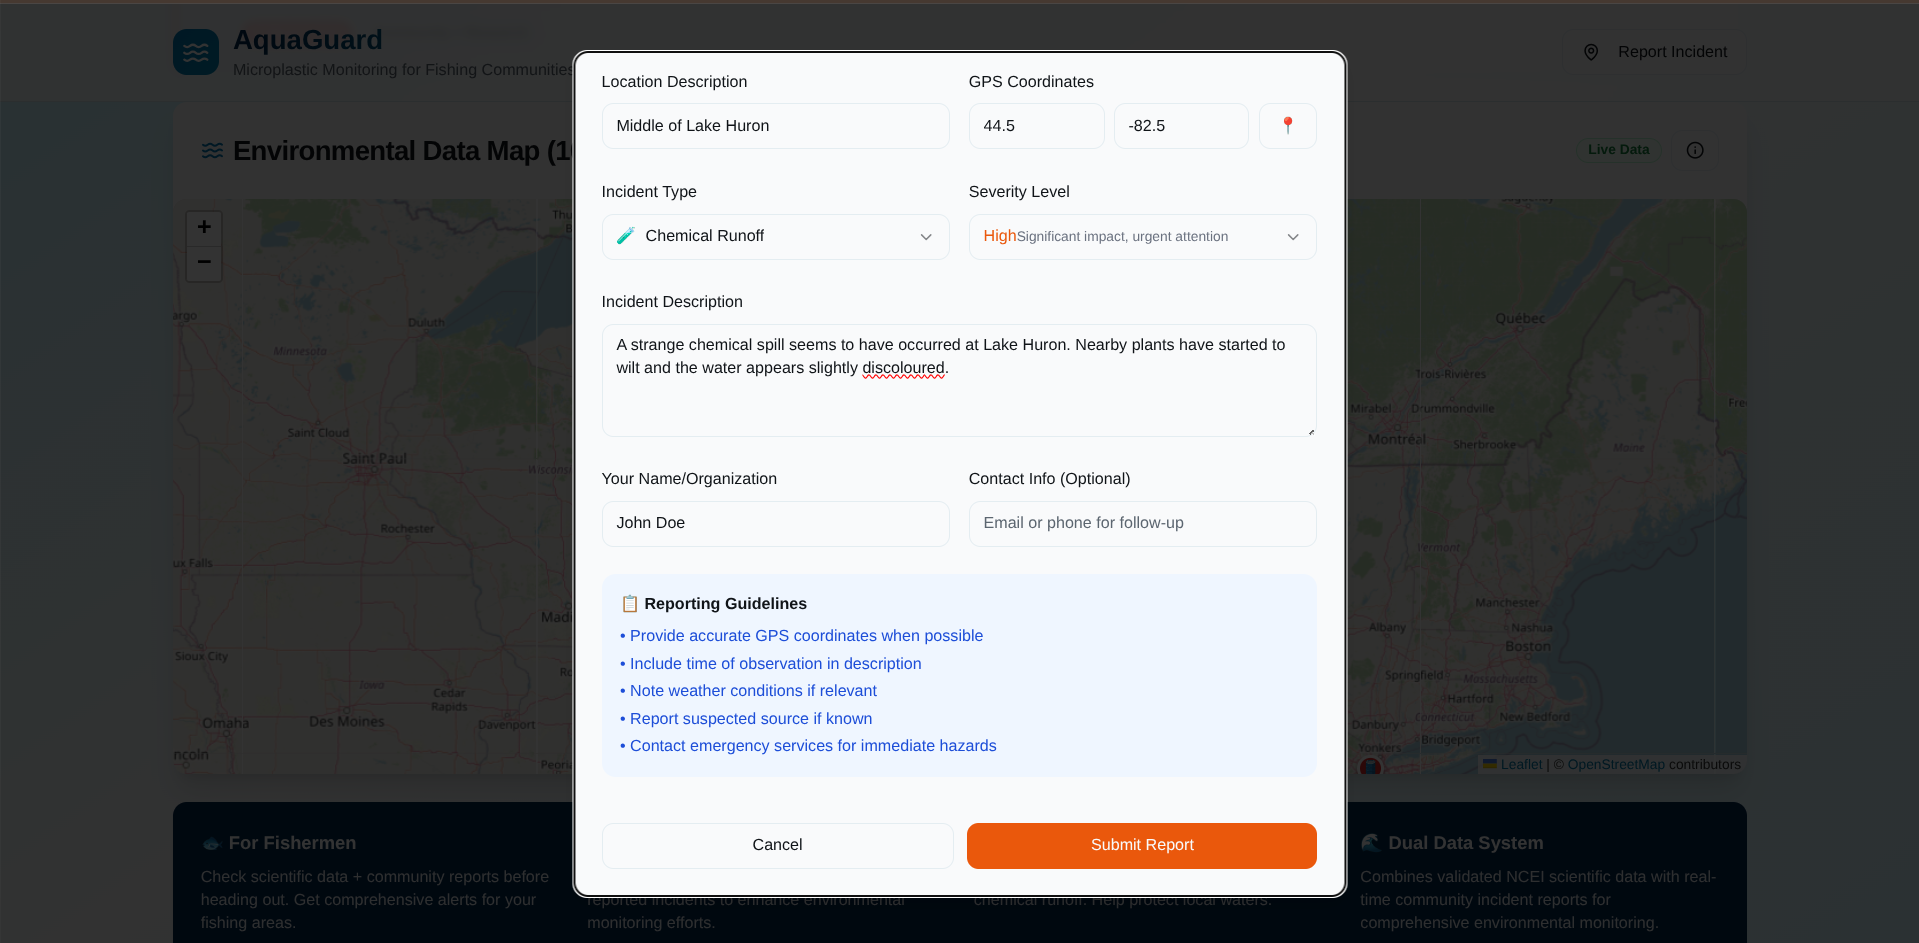
Reporting an incident
-
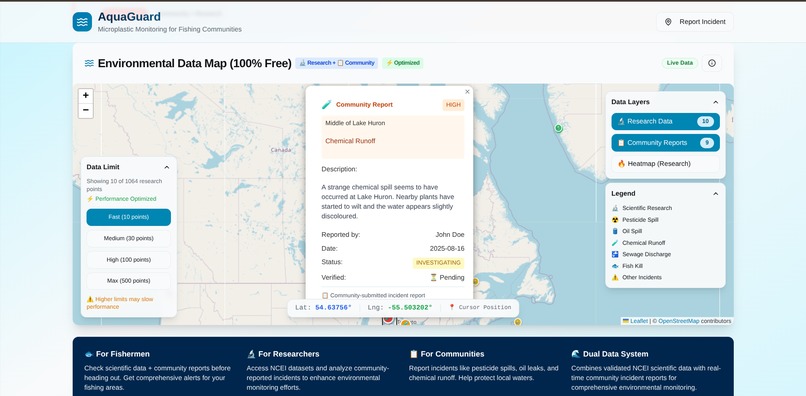
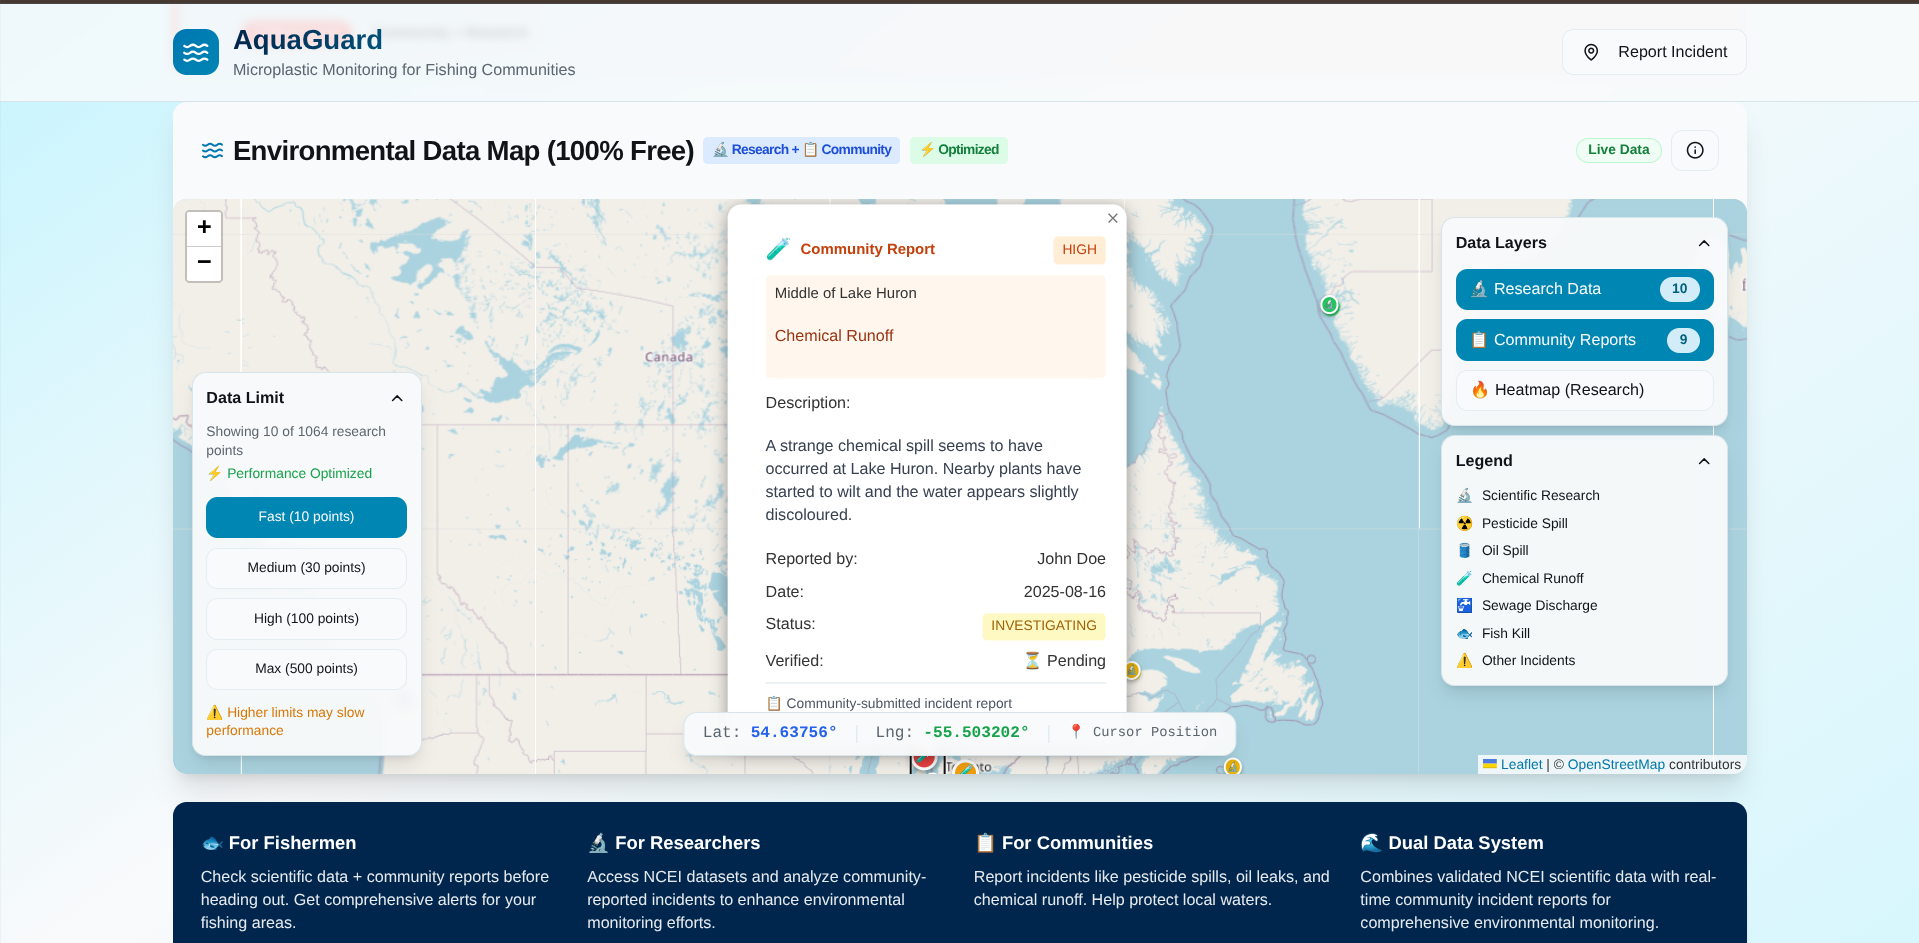
The incident has been newly added to the map
-
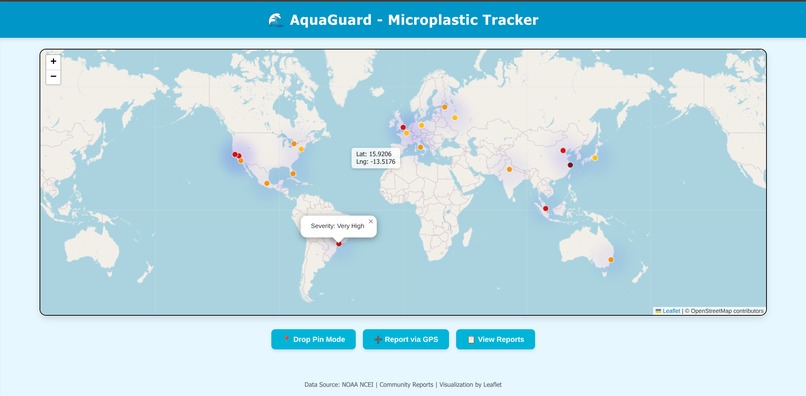
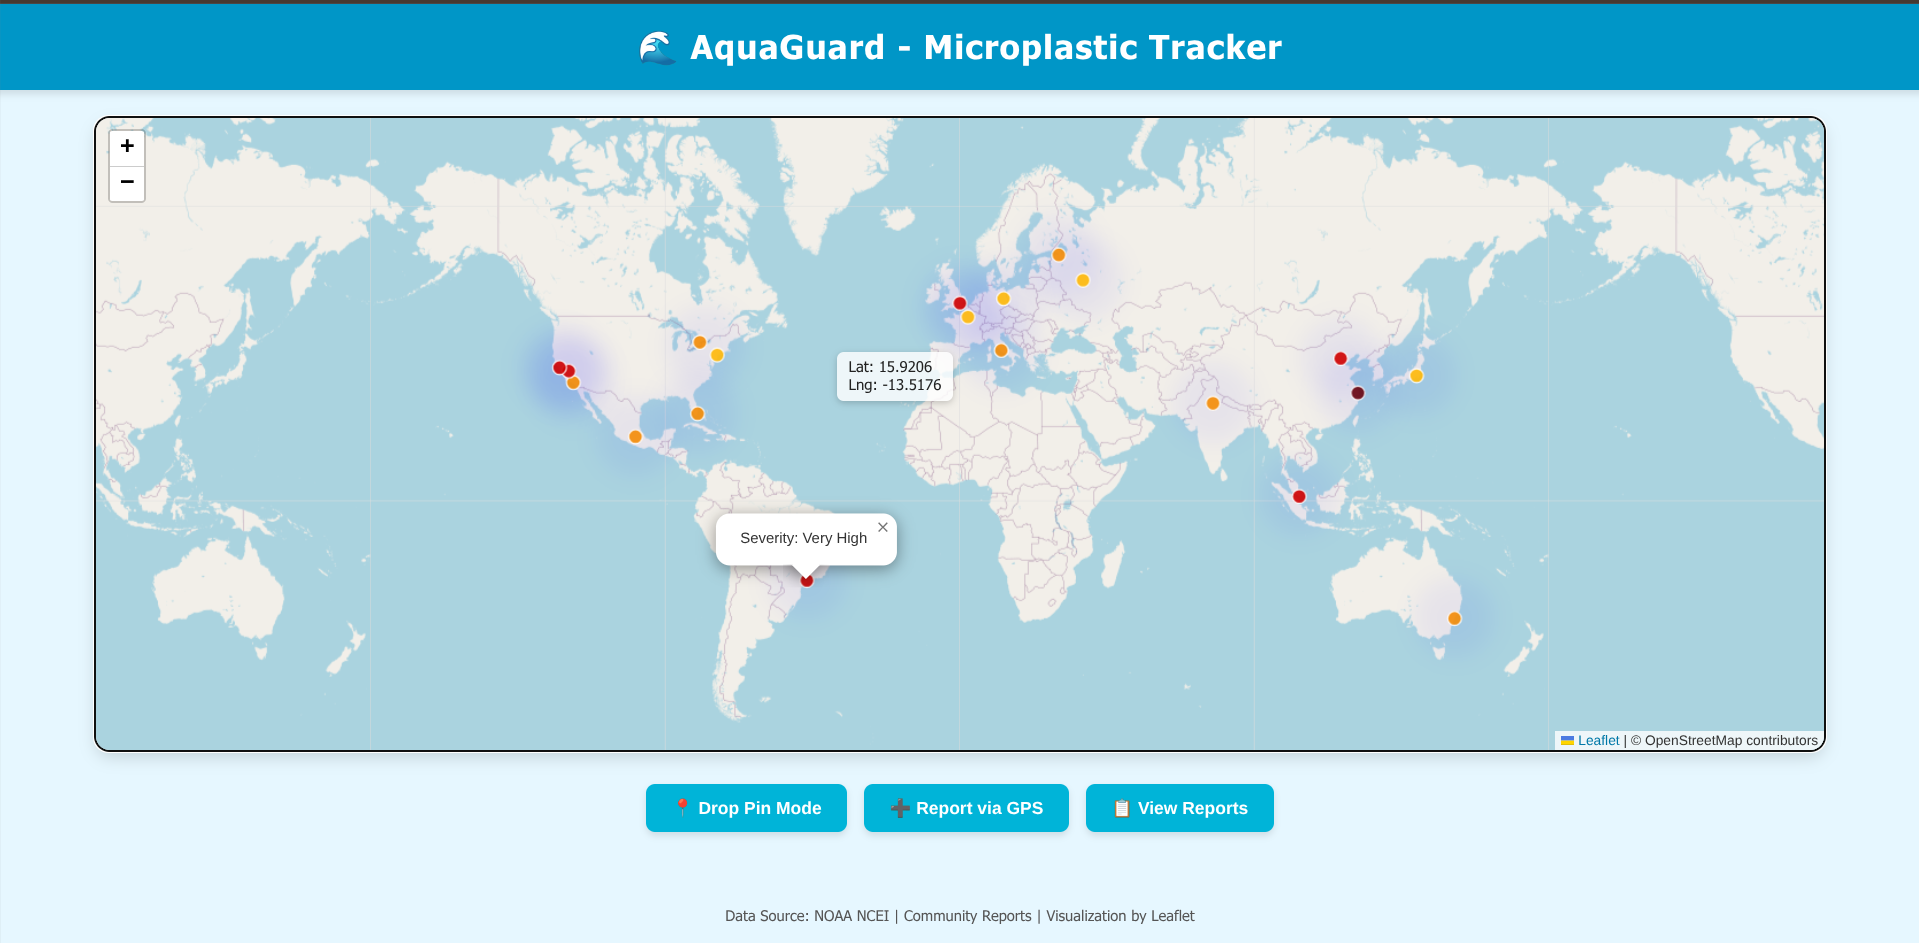
Prototype of the website
Inspiration
Pollution is a huge problem in our world. It contaminates our air and water sources and leads to many health problems. One particular issue is water pollution. I read about the Grassy Narrows reserve in Canada a few years ago, where a company in the 1970s spilled mercury into their lake. This killed many plants and animals and caused birth defects and other health problems for the local population. Water is a critical resource for our lives, so I decided to create a website that allows users to report water-related incidents. This facilitates researchers’ work, as they can use a map to locate different water issues. Having a log of polluted areas also makes it easier for communities and governments to organize cleanups and gather the required resources for each different type of incident effectively.
What it does
This website serves as a visual log for potential water issues. Users can scroll through a map to view research data from the NCEI as well as community-reported water incidents. Users can assess nearby water issues when planning activities like camping or fishing. The website is also useful for water cleanup organizations to track local incidents and for researchers seeking access to existing data.
How I built it
The basic webpage was built with HTML, CSS, and React. No database was required because the NCEI data was stored in CSV format and extracted later. The map was implemented using Leaflet.js and Leaflet-heat. The webpage was then ported to Builder.io, where additional features were added via the design interface, such as latitude and longitude detection, marker placement according to data, heatmap visualization, and the ability to report incidents in greater detail.
Challenges I ran into
Because I entered this hackathon solo, I had to do all of the coding work myself. Furthermore the time limit was only 24 hours so I was only able to produce a simple webpage with HTML, CSS and React. However, I was able to find and use the Builder.io website which allowed me to design a user interface based off of my current code, so I used that to quickly create a modern and sleek interface. The initial webpage is in the folder labelled “Prototype_IgnitionHacks2025_Prithvi”. The final website used for submission is in the folder labelled “Final_IgnitionHacks2025_Prithvi”
Accomplishments that I’m proud of
I’m proud of creating a functional mapping website using HTML, CSS, and JavaScript that updates in real time, hosts a Leaflet map, and allows adding and deleting reports. I’m also proud of designing a smoother UI with Builder.io, which was a new tool for me, improving the overall usability and aesthetic of the project.
What I learned
I learned how to incorporate a map into a website using Leaflet.js and Leaflet-heat. I also learned how to use Builder.io to create a modern, sleek user interface. Beyond technical skills, I developed better time management and planning strategies for solo hackathon projects.
What's next for AquaGuard
The next step is to purchase a domain, set up a cloud server, and host the website. The plan includes multiple login types: one for the general community, one for businesses or organizations involved in water cleanup/research, and one for the admin team. These logins will manage access to add or update data, with admins maintaining and moderating the website as needed.
Built With
- builderio
- figma
- html
- json
- leaflet-heat
- leaflet.js
- ncei
- node.js
- react
- tailwindcss
- typescript
- vite


Log in or sign up for Devpost to join the conversation.