-
-
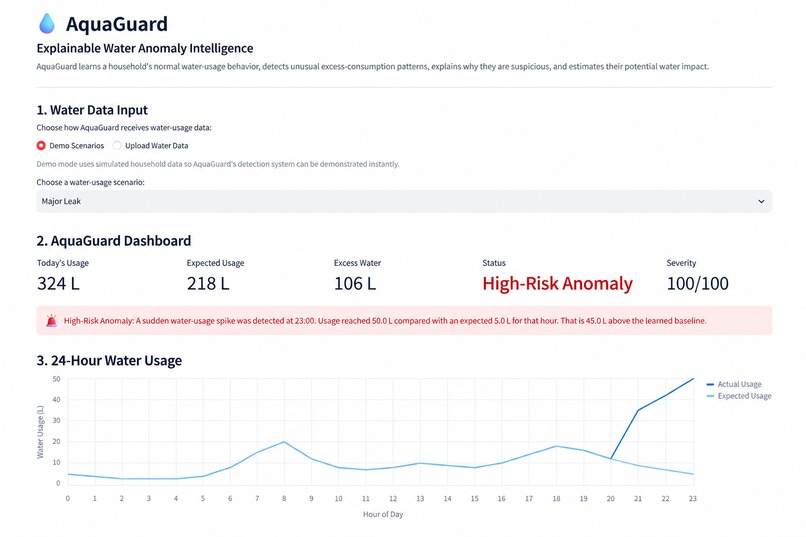
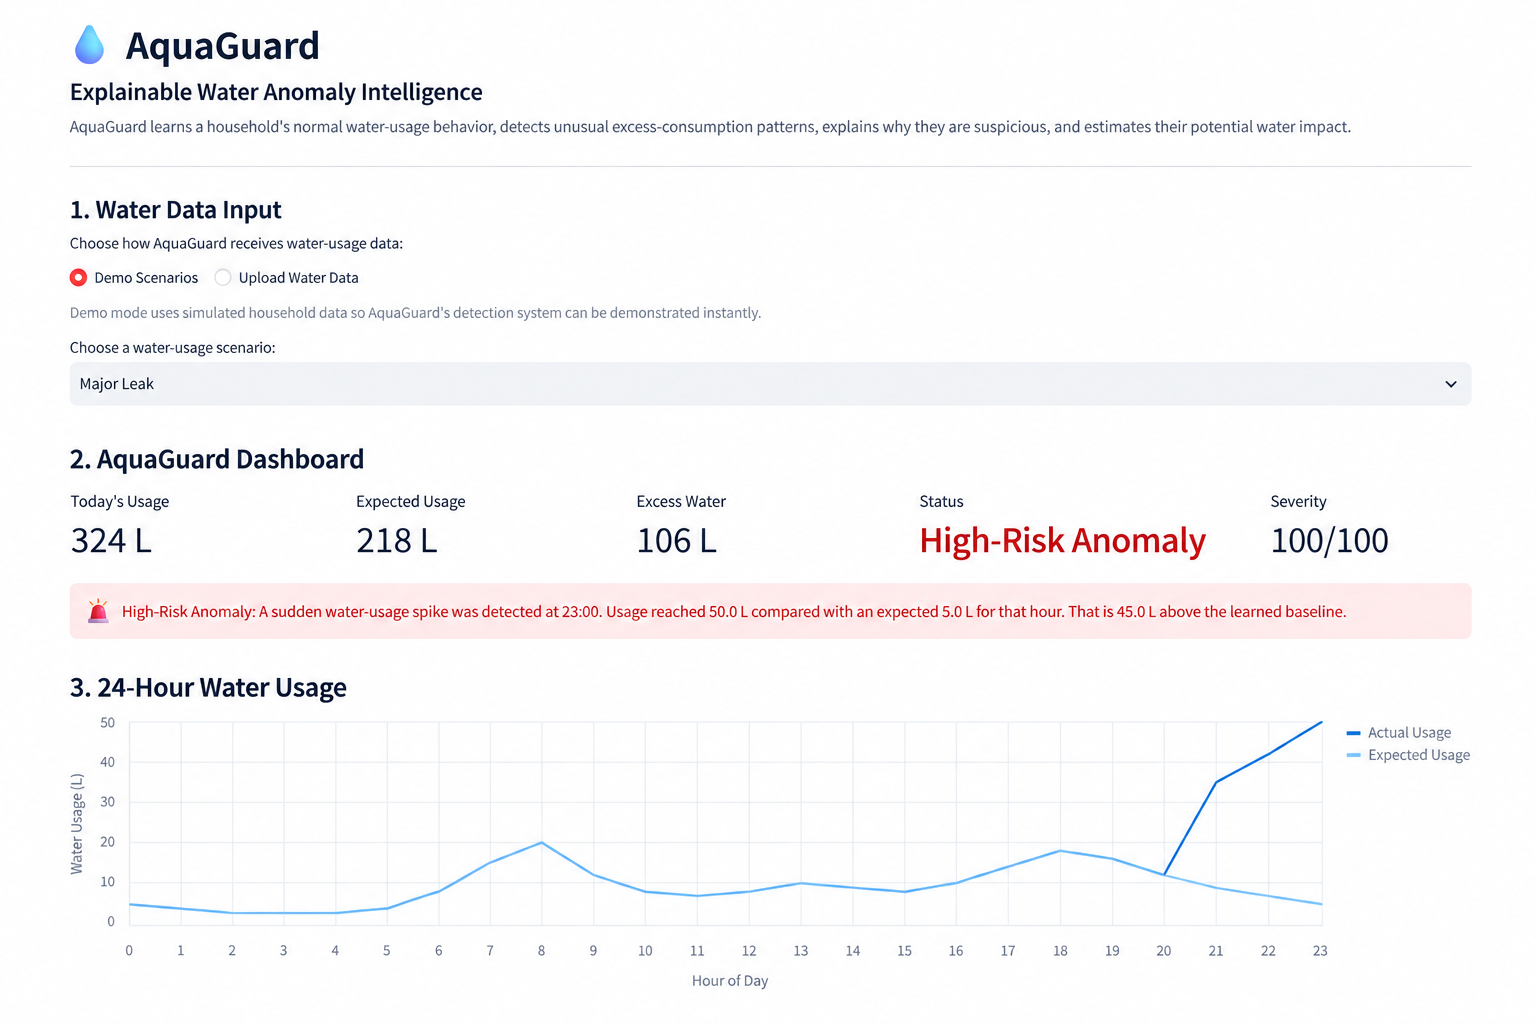
AquaGuard catches a high-risk water anomaly by comparing real-time usage with learned household behavior.
-
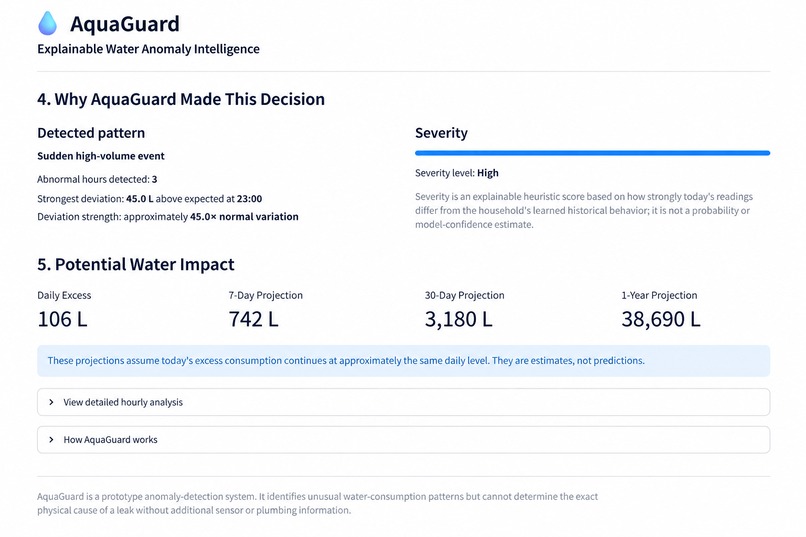
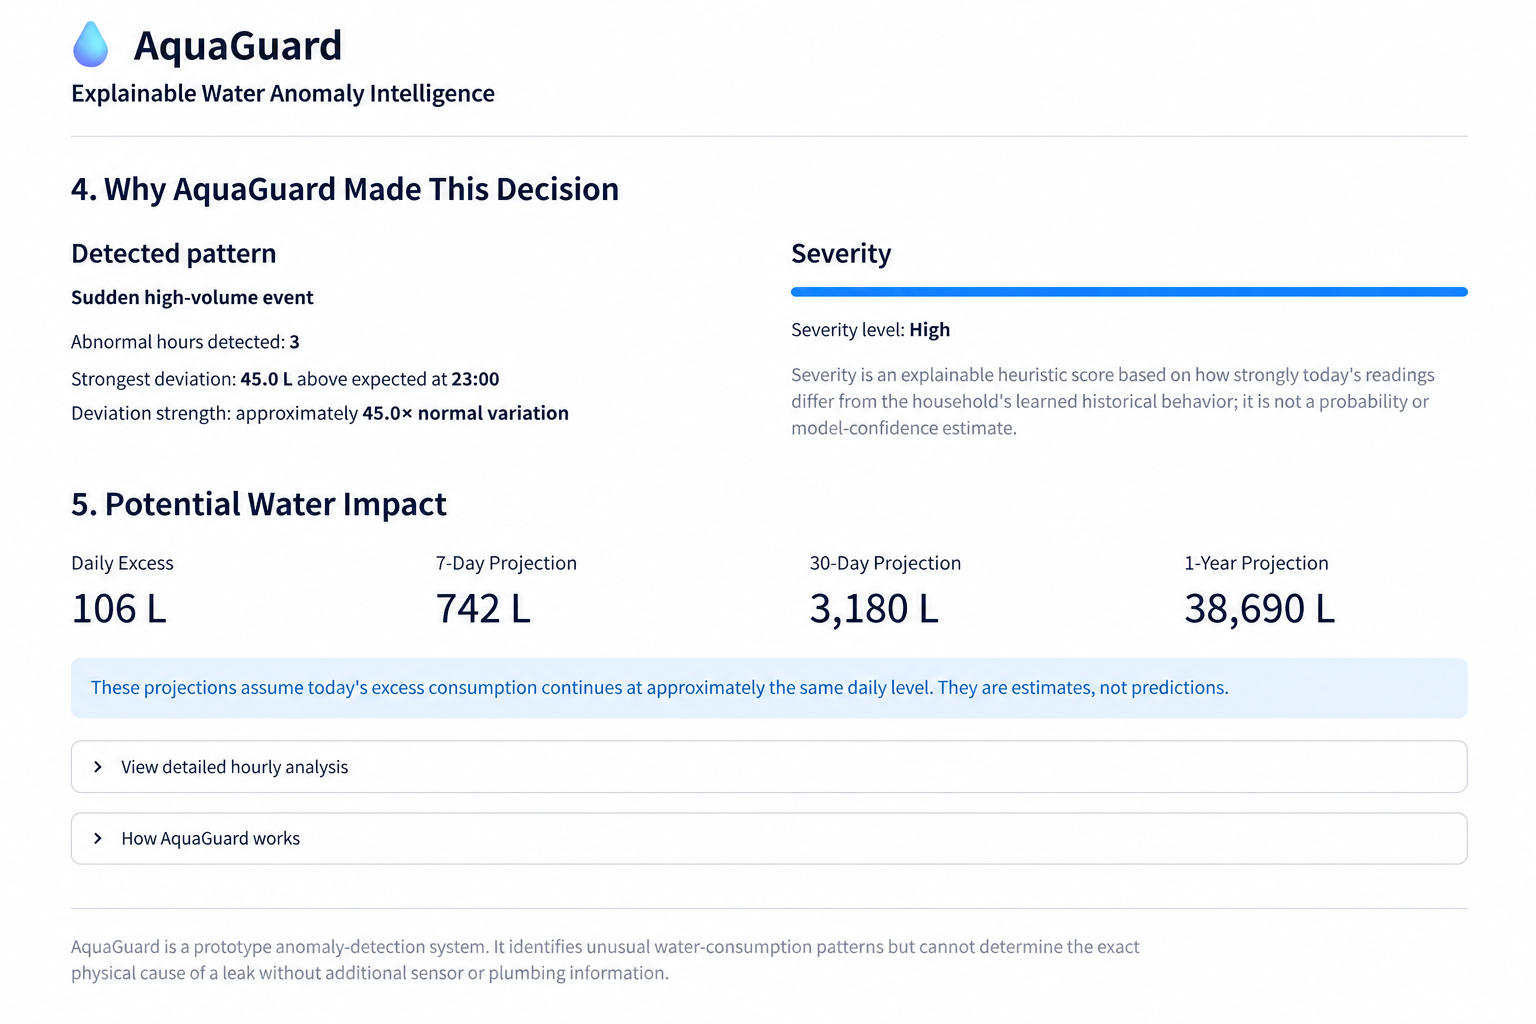
From detection to impact: AquaGuard explains why usage was flagged and reveals the potential water waste.
-
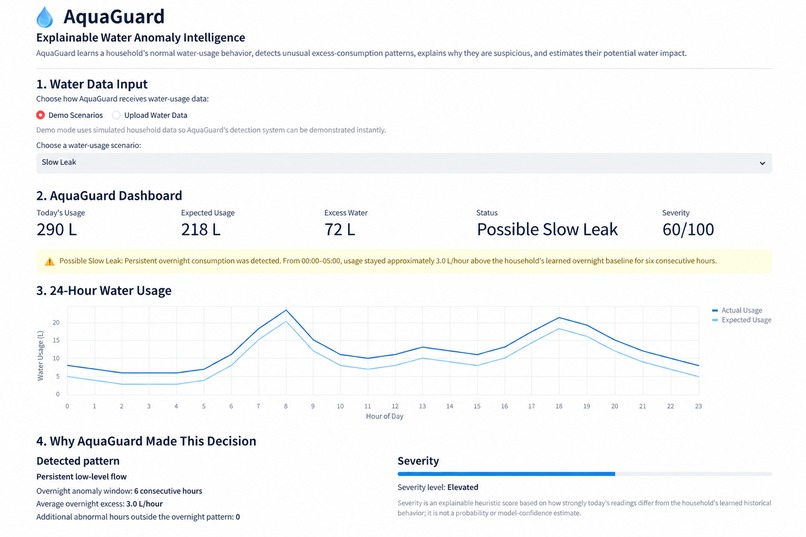
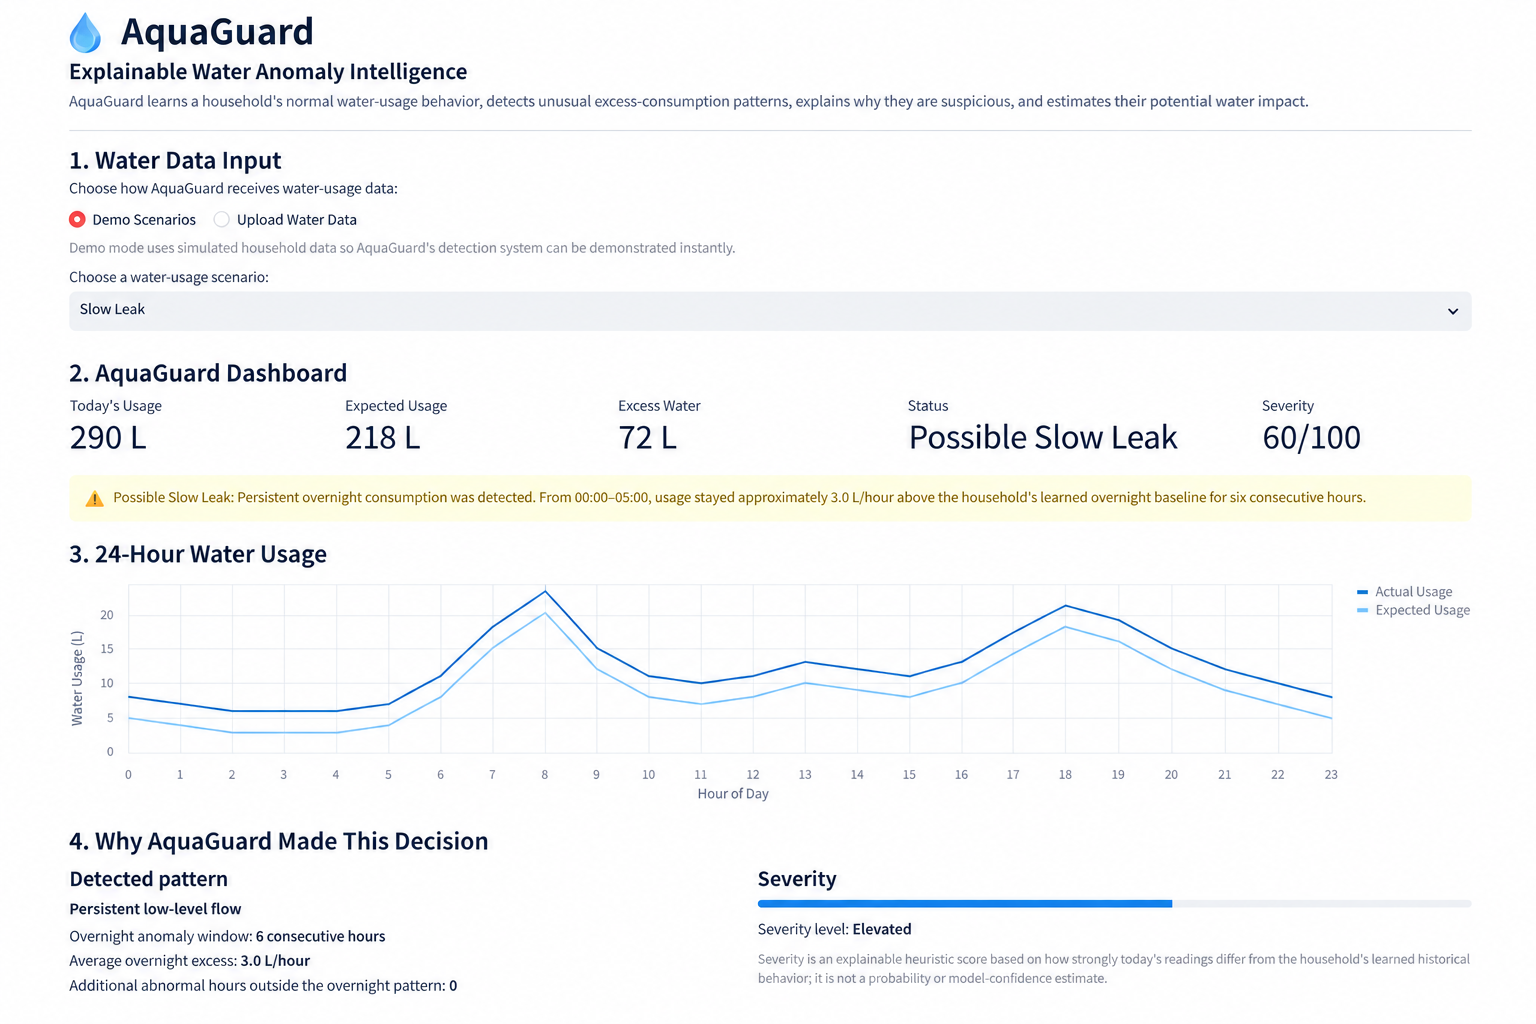
Even subtle waste matters: AquaGuard identifies persistent overnight usage that may signal a slow leak.
-
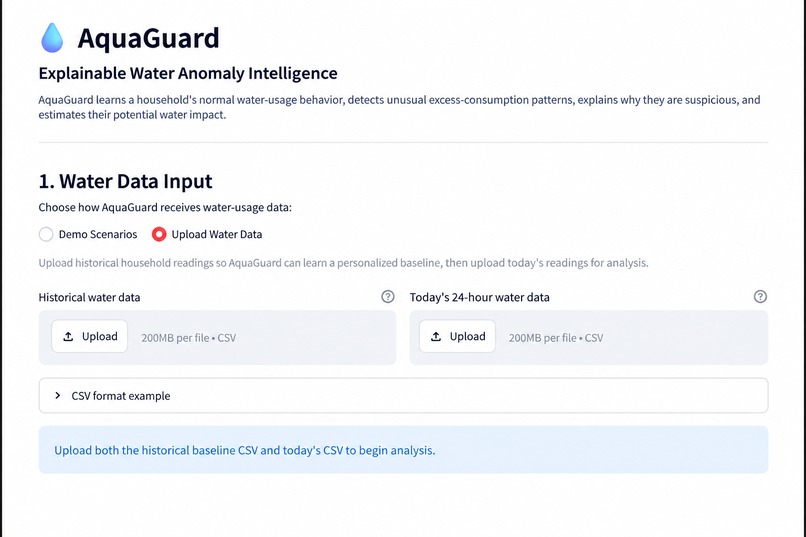
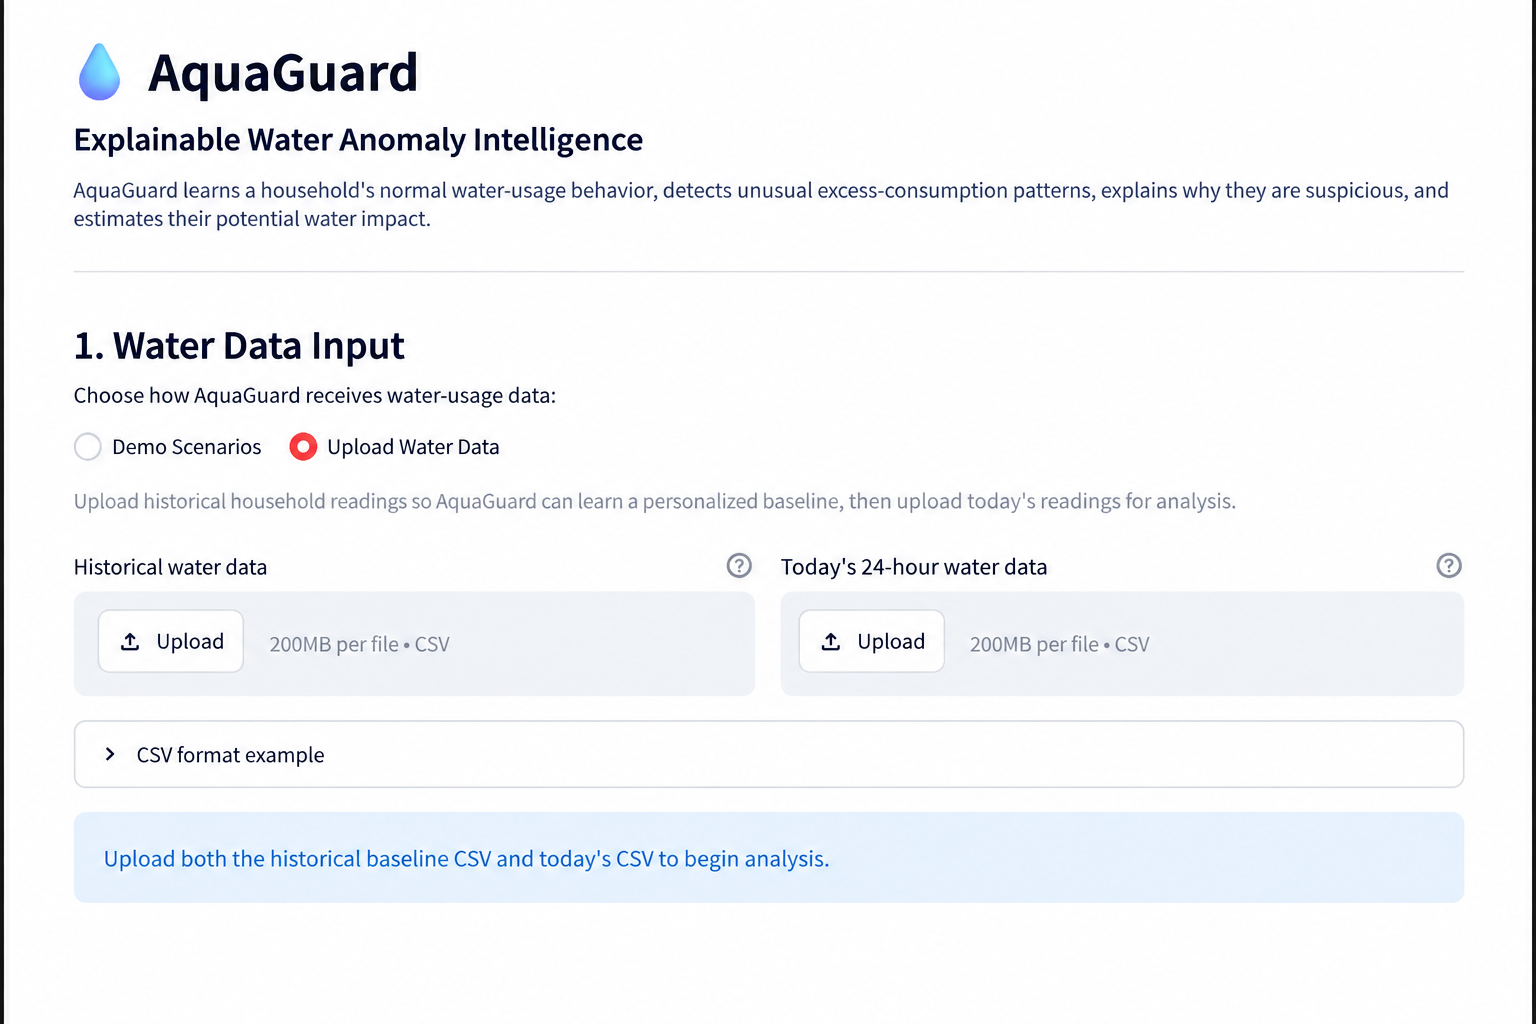
Beyond demos, AquaGuard learns from uploaded household data to build a personalized water-use baseline.
Inspiration
I first became interested in water conservation in 8th grade during a social studies class. My teacher was explaining how everyday water use can add up over time, including something as easy to overlook as a dripping tap. The idea that a small, seemingly insignificant loss could become a substantial amount of wasted water stayed with me.
Years later, when I saw that this hackathon followed the Earth Forward theme, I immediately thought about that lesson. I wanted to turn that old idea into something technical rather than simply telling people to use less water.
That led me to AquaGuard.
Instead of relying on people to notice waste themselves, AquaGuard analyzes household water-use behavior and looks for changes that might otherwise go unnoticed. It learns what normal usage looks like for a household, detects unusual consumption, explains why it was flagged, and translates potential excess usage into an understandable amount of water.
The goal was simple: make hidden water waste visible enough that people can recognize it and act on it.
What AquaGuard Does
AquaGuard is an explainable water anomaly-detection system for household water usage.
It learns a household-specific hourly baseline from historical data and compares a new 24-hour period against that learned behavior.
It looks for three major patterns:
- Persistent overnight excess — sustained usage during normally low-consumption hours that may indicate a slow leak
- Sudden high-volume spikes — unusually large deviations treated as high-risk anomalies
- Repeated abnormal consumption — unusual usage occurring across multiple hours
AquaGuard does not stop at simply saying that something is wrong.
When an anomaly is detected, the dashboard explains the evidence behind the decision. It identifies abnormal hours, compares actual usage with expected usage, highlights the strongest deviation, and provides a 0–100 heuristic severity score.
It also estimates how much additional water could be consumed over 1 day, 7 days, 30 days, and 1 year if the observed daily excess continued. These figures are estimates, not predictions.
How I Built It
I developed and iterated on AquaGuard using AI-assisted coding, with Python, Streamlit, pandas, NumPy, and Altair.
I directed the product design and detection approach, tested different scenarios, refined the classification logic and edge cases, worked through validation issues, and deployed the final prototype.
The core detection system learns two things for each hour of the day from historical usage:
- the expected amount of water used
- the normal variability around that amount
AquaGuard then compares today's readings with those learned values.
Instead of using one fixed threshold for every hour, the system uses adaptive thresholds based on historical variability. This allows it to distinguish between hours where variation is naturally expected and hours where a relatively small change may be meaningful.
The detection engine then evaluates the resulting deviations for persistent overnight consumption, high-volume spikes, and repeated abnormal usage. A defined classification priority ensures that significant patterns are identified consistently.
I also built strict input validation so that the system does not blindly analyze unreliable data. It checks for missing or duplicate hours, invalid numeric values, negative usage, incomplete historical data, and incorrectly formatted daily readings.
AquaGuard includes built-in Normal, Slow Leak, and Major Leak scenarios for immediate demonstration, as well as an Upload Water Data mode for compatible historical and current-day CSV files.
Challenges
One of the biggest challenges was balancing sensitivity with false alarms.
A fixed threshold can be too sensitive during naturally variable periods and not sensitive enough during periods where consumption is normally stable. AquaGuard's hourly behavioral baseline and variability-based thresholds were designed to make anomaly detection more specific to each household's normal pattern.
Another challenge was explainability.
Detecting an anomaly was only part of the problem. I wanted the user to understand why AquaGuard considered something unusual. This led to an explanation layer that exposes the abnormal hours, expected usage, deviation from baseline, strongest anomaly, severity, and estimated excess water.
I also had to account for imperfect input data. Real datasets can contain missing hours, duplicate readings, invalid values, or insufficient history. AquaGuard validates the data before analysis instead of assuming every dataset is perfect.
During development, I tested the detection behavior across different scenarios, refined edge cases around anomaly boundaries, improved the classification logic, strengthened data validation, and resolved interface compatibility issues before deployment.
What I Learned
Building AquaGuard taught me how to take an environmental problem from an idea to a complete, deployed software prototype.
I learned how to work with time-based data using pandas and NumPy, design behavioral baselines, build adaptive anomaly-detection logic, create interactive visualizations with Altair, develop an application with Streamlit, validate user-provided datasets, manage a project with Git and GitHub, and deploy a working application.
Most importantly, I learned the importance of explainability.
A system that simply produces an alert leaves the user asking, "Why?"
AquaGuard instead tries to show the evidence behind its decision. That makes an anomaly easier to understand and gives the user more useful information about what changed and how significant the excess could become.
Environmental Impact
AquaGuard addresses the Earth Forward theme through water conservation.
Its purpose is to make abnormal household water consumption easier to identify and understand, giving households an opportunity to notice potential waste earlier.
By translating detected daily excess into longer-term estimates, AquaGuard also makes the potential consequence of continued abnormal consumption tangible rather than leaving it as an abstract number.
The prototype is intentionally software-first. It demonstrates how historical and current water-use data could be analyzed without requiring AquaGuard-specific plumbing hardware.
Demo Scenarios
AquaGuard includes three built-in scenarios:
- Normal — demonstrates typical household behavior
- Slow Leak — demonstrates persistent low-level overnight consumption
- Major Leak — demonstrates sudden high-volume anomalies
The application also supports uploaded household data, allowing users to provide their own compatible historical baseline and current-day CSV files instead of being limited to predefined demonstrations.
This makes the project more than a static demonstration: the same detection process can be applied to new datasets that follow the required format.
Limitations
AquaGuard is currently a prototype.
It identifies unusual consumption patterns, but it cannot determine the exact physical source of a leak without additional sensor or plumbing information.
Its severity score is a heuristic indicator, not a probability or machine-learning confidence score.
The long-term water-impact figures are estimates based on the assumption that the observed daily excess continues. They should not be interpreted as predictions.
The current prototype also relies on compatible historical and current-day water-use data rather than a direct connection to household plumbing or a smart-meter service.
What's Next
The next stage would be to validate AquaGuard against larger and more diverse real-world household datasets.
Future development could include direct smart-meter integrations, real-time notifications, longer-term household trend analysis, additional household context, and broader evaluation of detection performance.
With sufficient real-world validation, AquaGuard could evolve from an explainable anomaly-detection prototype into a broader household water-intelligence platform — helping people understand their water use and recognize potential waste sooner.


Log in or sign up for Devpost to join the conversation.