Inspiration
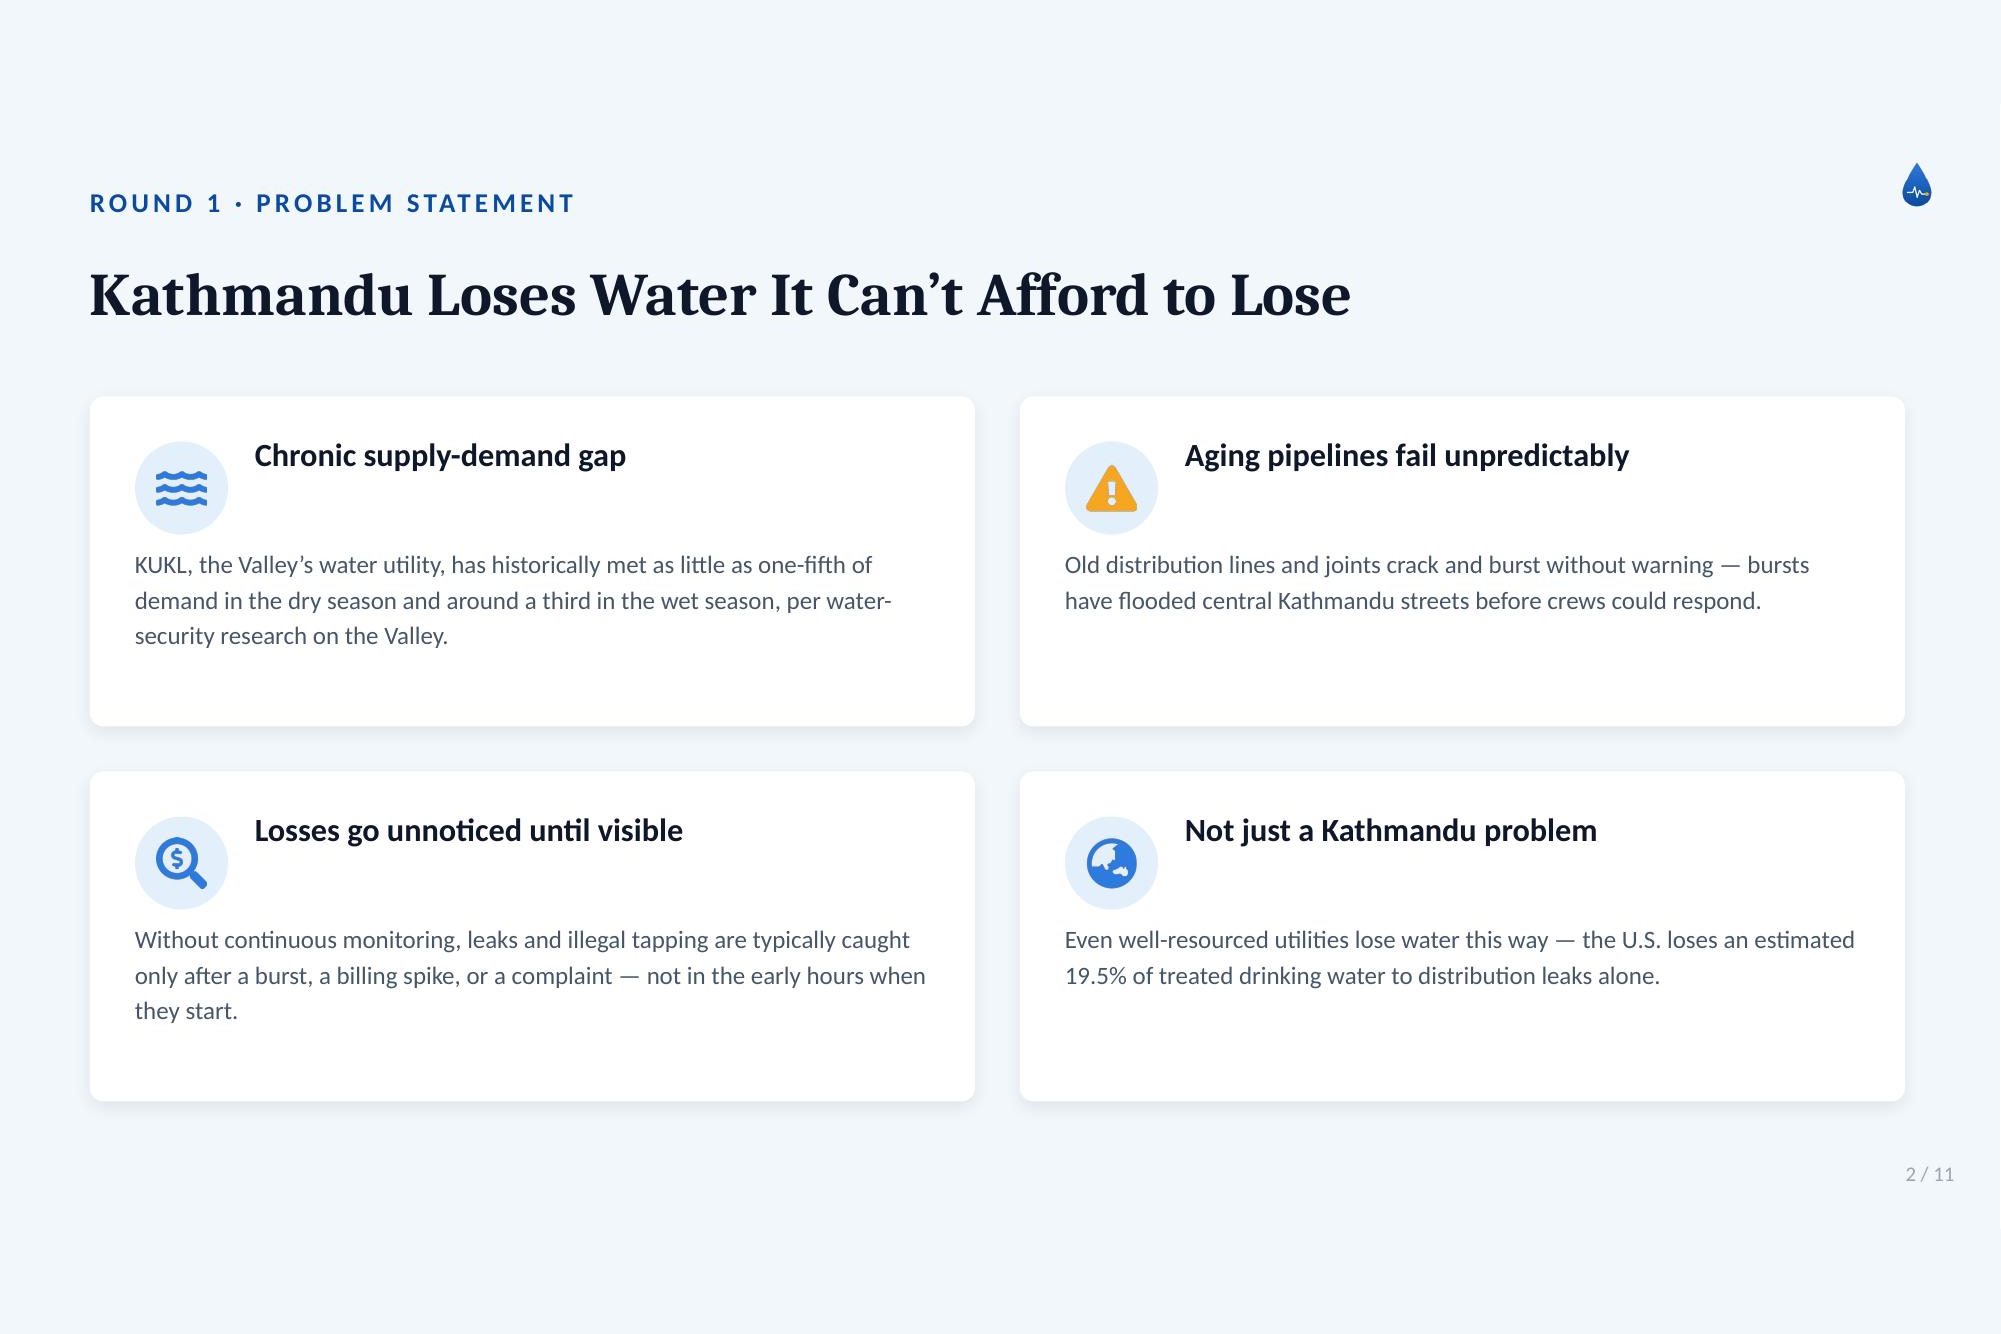
Kathmandu Valley loses a huge share of its treated water before it ever reaches a tap. KUKL, the Valley's water utility, has historically met as little as one-fifth of demand in the dry season, and aging pipelines keep bursting without warning — we've all seen streets flood from a broken line that no one caught in time. At the same time, I already had experience building a YOLOv8-based computer vision project (Sentinel AI), and my first instinct was to reuse that skillset. But rebuilding the same kind of model on a new topic wouldn't have taught me anything new. So instead, I chose to solve a problem I actually see around me, using a completely different branch of AI I'd never touched before: unsupervised anomaly detection.
What it does
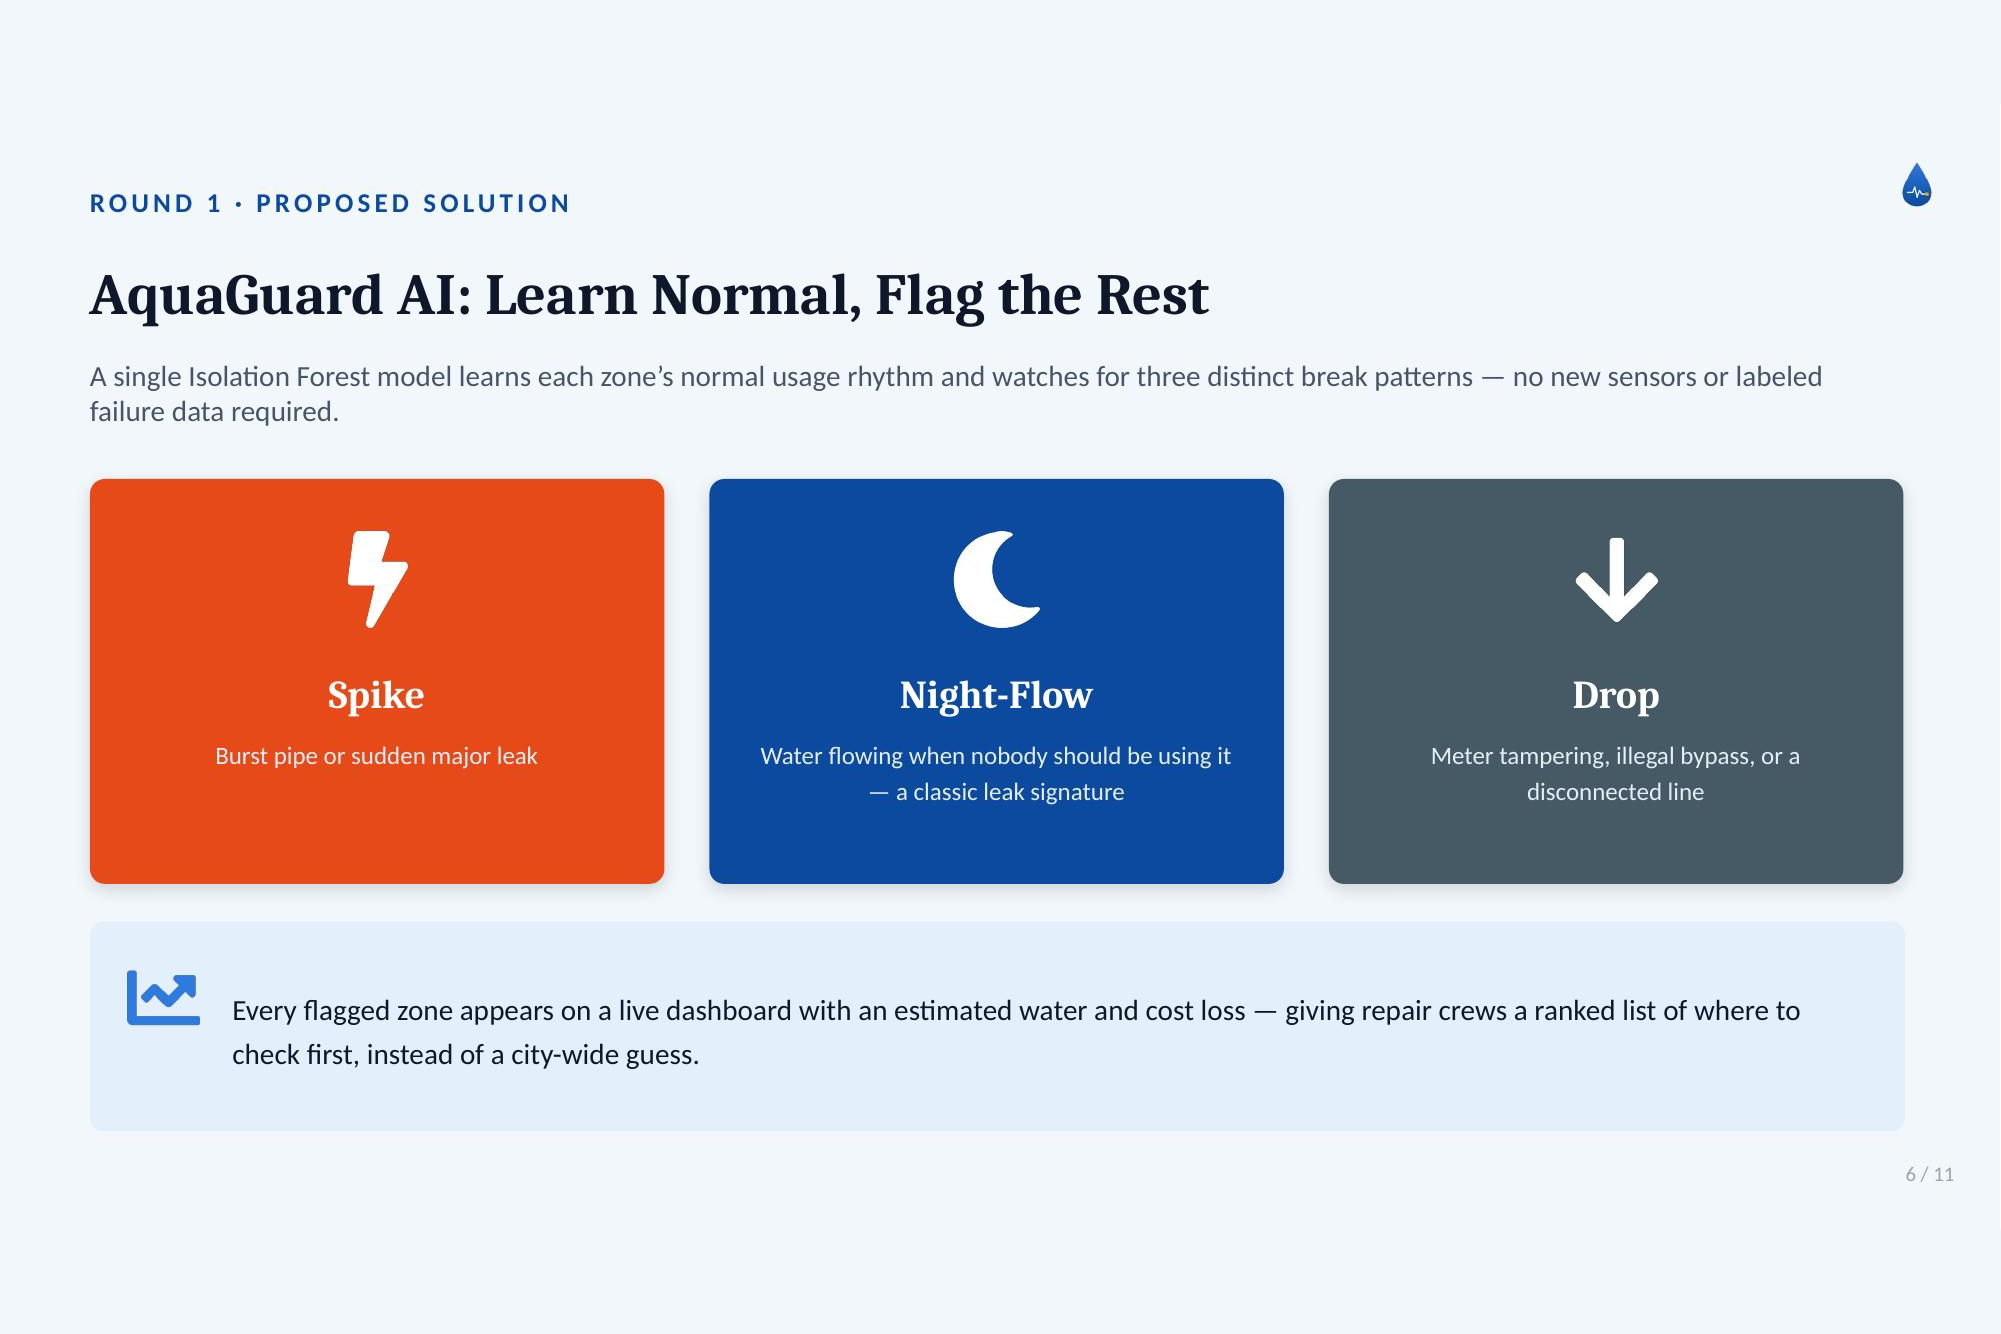
AquaGuard AI watches water-usage data — per household or per city zone — and learns what "normal" consumption looks like over time. When a reading breaks that normal rhythm, it flags it as one of three specific anomaly types instead of a single generic alert:
- Spike — a sudden jump in usage, consistent with a burst pipe
- Night-Flow — unusual water flow during hours when consumption should be near zero, a classic leak signature
- Drop — an unexplained fall in usage, consistent with meter tampering or an illegal bypass
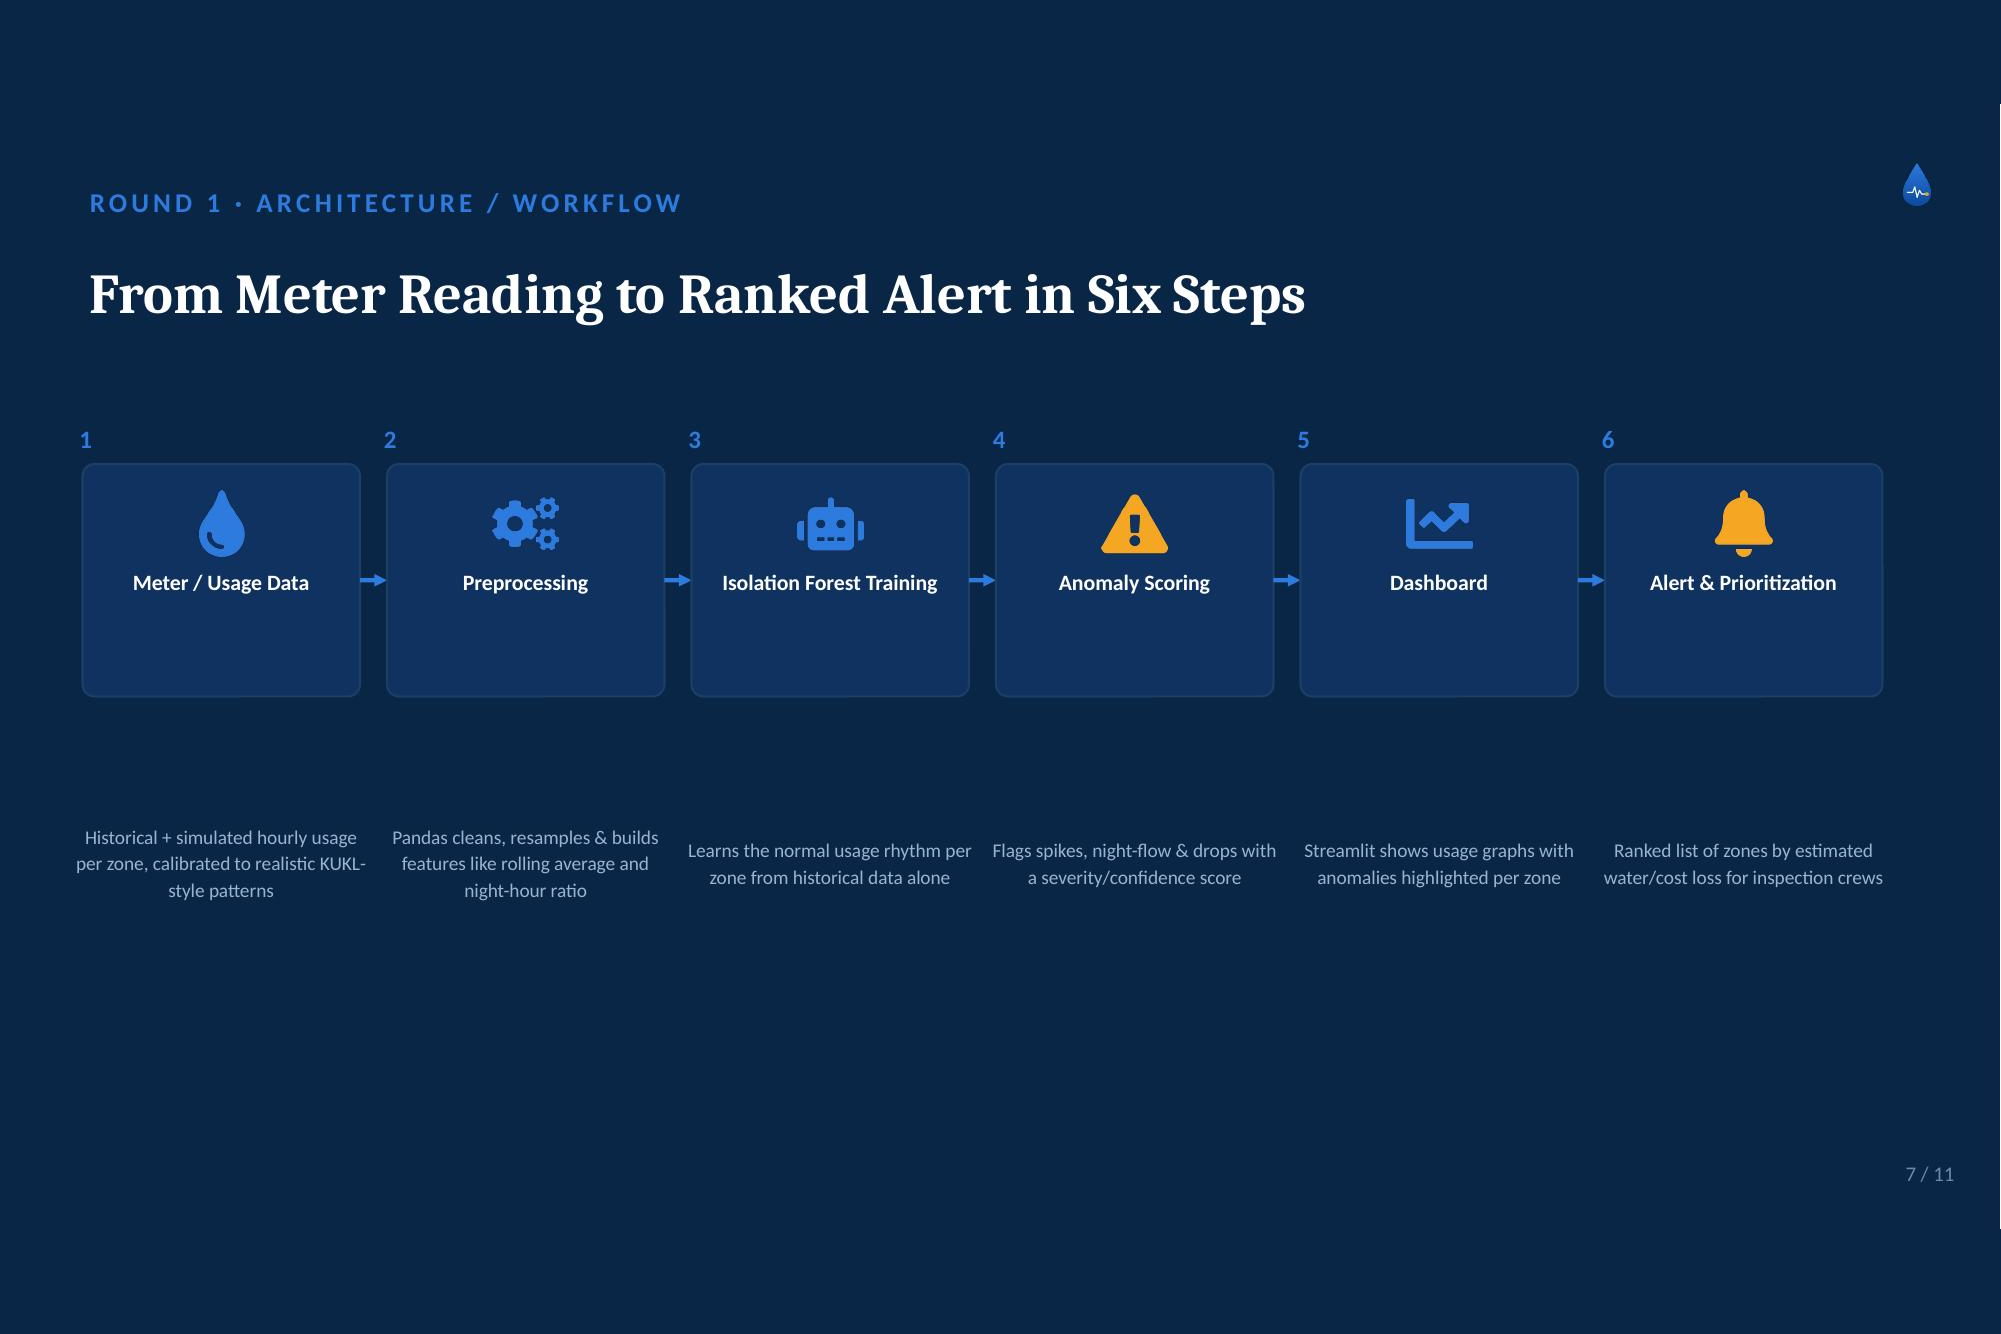
Every flagged zone appears on a live dashboard with an estimated water and cost loss, giving repair crews a ranked list of where to inspect first — instead of waiting for a visible flood or a resident's complaint.
How we built it
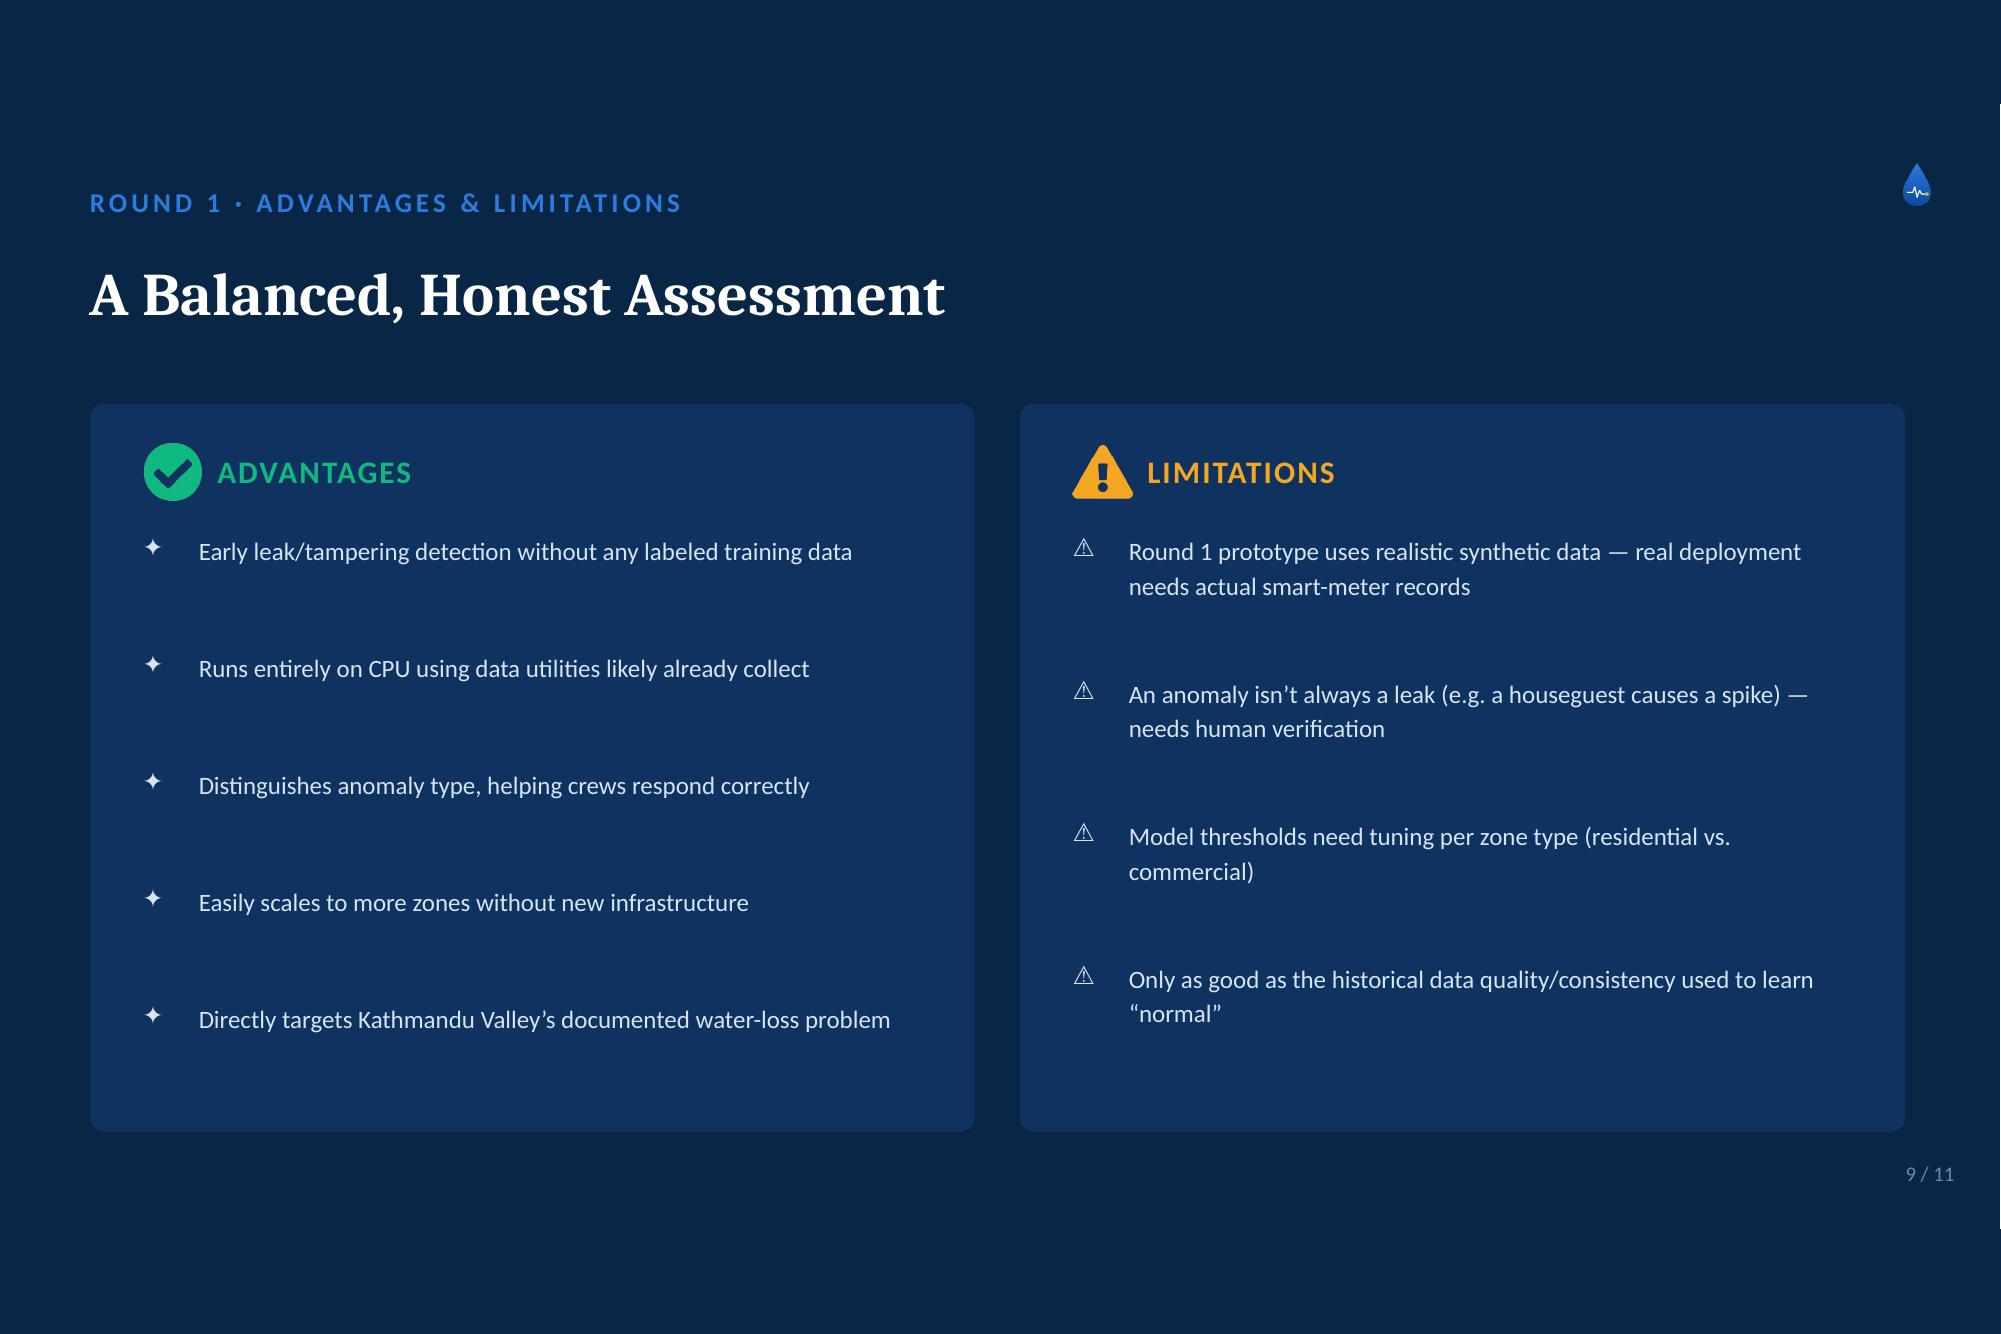
- NumPy to generate realistic synthetic water-usage data, calibrated to documented KUKL consumption and loss patterns, since no public real-time smart-meter dataset exists for Kathmandu
- Pandas for cleaning, resampling, and feature engineering — rolling averages, night-hour usage ratios, and per-zone baselines
- Scikit-learn's Isolation Forest as the core detection model, chosen specifically because it's unsupervised — it learns what's normal and isolates what isn't, without ever needing a labeled "this was a leak" dataset that doesn't exist
- Matplotlib/Plotly to visualize usage patterns with anomalies highlighted
- Streamlit to wrap it all into a live dashboard a utility operator could actually use
Everything runs on CPU — no GPU, no new sensors, no infrastructure beyond data the utility likely already collects.
Challenges we ran into
The biggest challenge was data: there's no public, real-time smart-meter dataset for Kathmandu, so I had to build a synthetic data generator realistic enough to be meaningful — calibrated against actual published research on the Valley's water-security numbers rather than arbitrary values. The second challenge was conceptual: choosing anomaly detection over classification meant learning an entirely new ML paradigm from scratch, since my prior experience was in supervised computer vision (YOLOv8), not unsupervised pattern learning on tabular time-series data. Working solo on an older CPU-only laptop also meant every design decision had to be evaluated against "can this actually run and be demoed with what I have," not just "does this look impressive on paper."
Accomplishments that we're proud of
Moving from a supervised, vision-based skillset into unsupervised anomaly detection on time-series data, as a solo, self-taught builder, in a short timeframe. Grounding the entire concept in real, cited research on Kathmandu Valley's documented water crisis instead of a generic "smart city" idea that could apply to any city in the world. And designing a system with a genuinely practical deployment story — zero new hardware required to pilot it on data a utility already has.
What we learned
I learned the fundamentals of unsupervised anomaly detection and why Isolation Forest works well for exactly this kind of problem — no labels, just deviation from a learned baseline. I also learned a lot about Kathmandu's actual water infrastructure while researching this: KUKL's documented supply-demand gap, how non-revenue water loss is measured, and how leak detection is approached by real utilities and researchers. Just as importantly, I learned how to scope a solo hackathon project realistically — narrowing from five hazard types down to three focused anomaly signatures made the difference between an idea that sounds good and one that's actually buildable in the time available.
What's next for AquaGuard AI
The immediate next step is Round 2: fine-tune the Isolation Forest model on the synthetic dataset, finish the Streamlit dashboard, and demo it by injecting known anomalies and showing the model catch them with an estimated loss summary. Beyond the hackathon, the real goal is a pilot with actual KUKL or ward-level consumption data, mobile push alerts for field crews, and a GIS-based map view showing flagged zones geographically across the Valley — eventually extending the same anomaly-detection approach to other utilities like electricity load monitoring.
Built With
- anomaly-detection
- artificial-intelligence
- data-science
- isolation-forest
- machine-learning
- matplotlib
- numpy
- pandas
- plotly
- python
- scikit-learn
- streamlit
- time-series-analysis
- unsupervised-learning

Log in or sign up for Devpost to join the conversation.