AquaGrid
Inspiration
Northern Virginia is the world’s largest data center hub. As AI drives new construction, water use for cooling is becoming a critical and overlooked issue.
If a new data center is built here, how much strain does it add to local water systems?
What It Does
AquaGrid is a lightweight simulation tool for civic planners.
Users can:
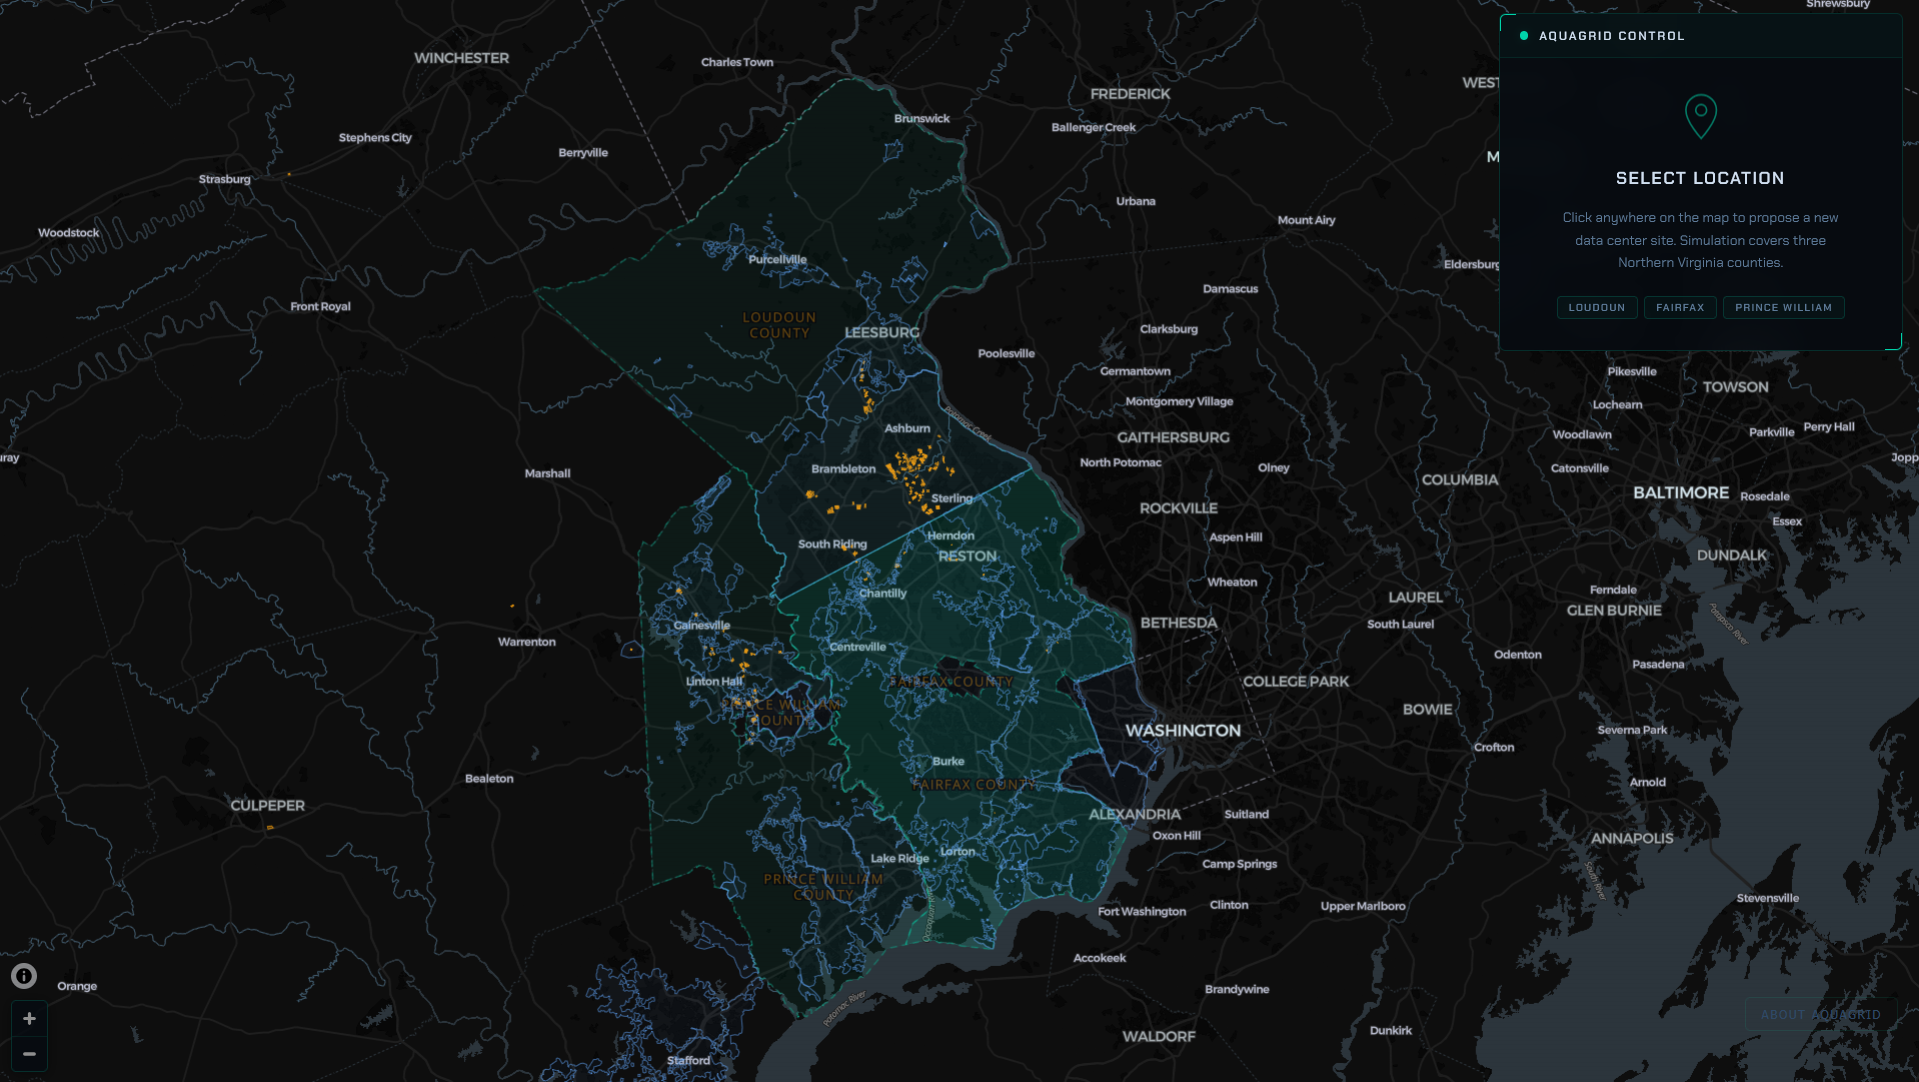
- View county-level water withdrawal
- See existing data centers
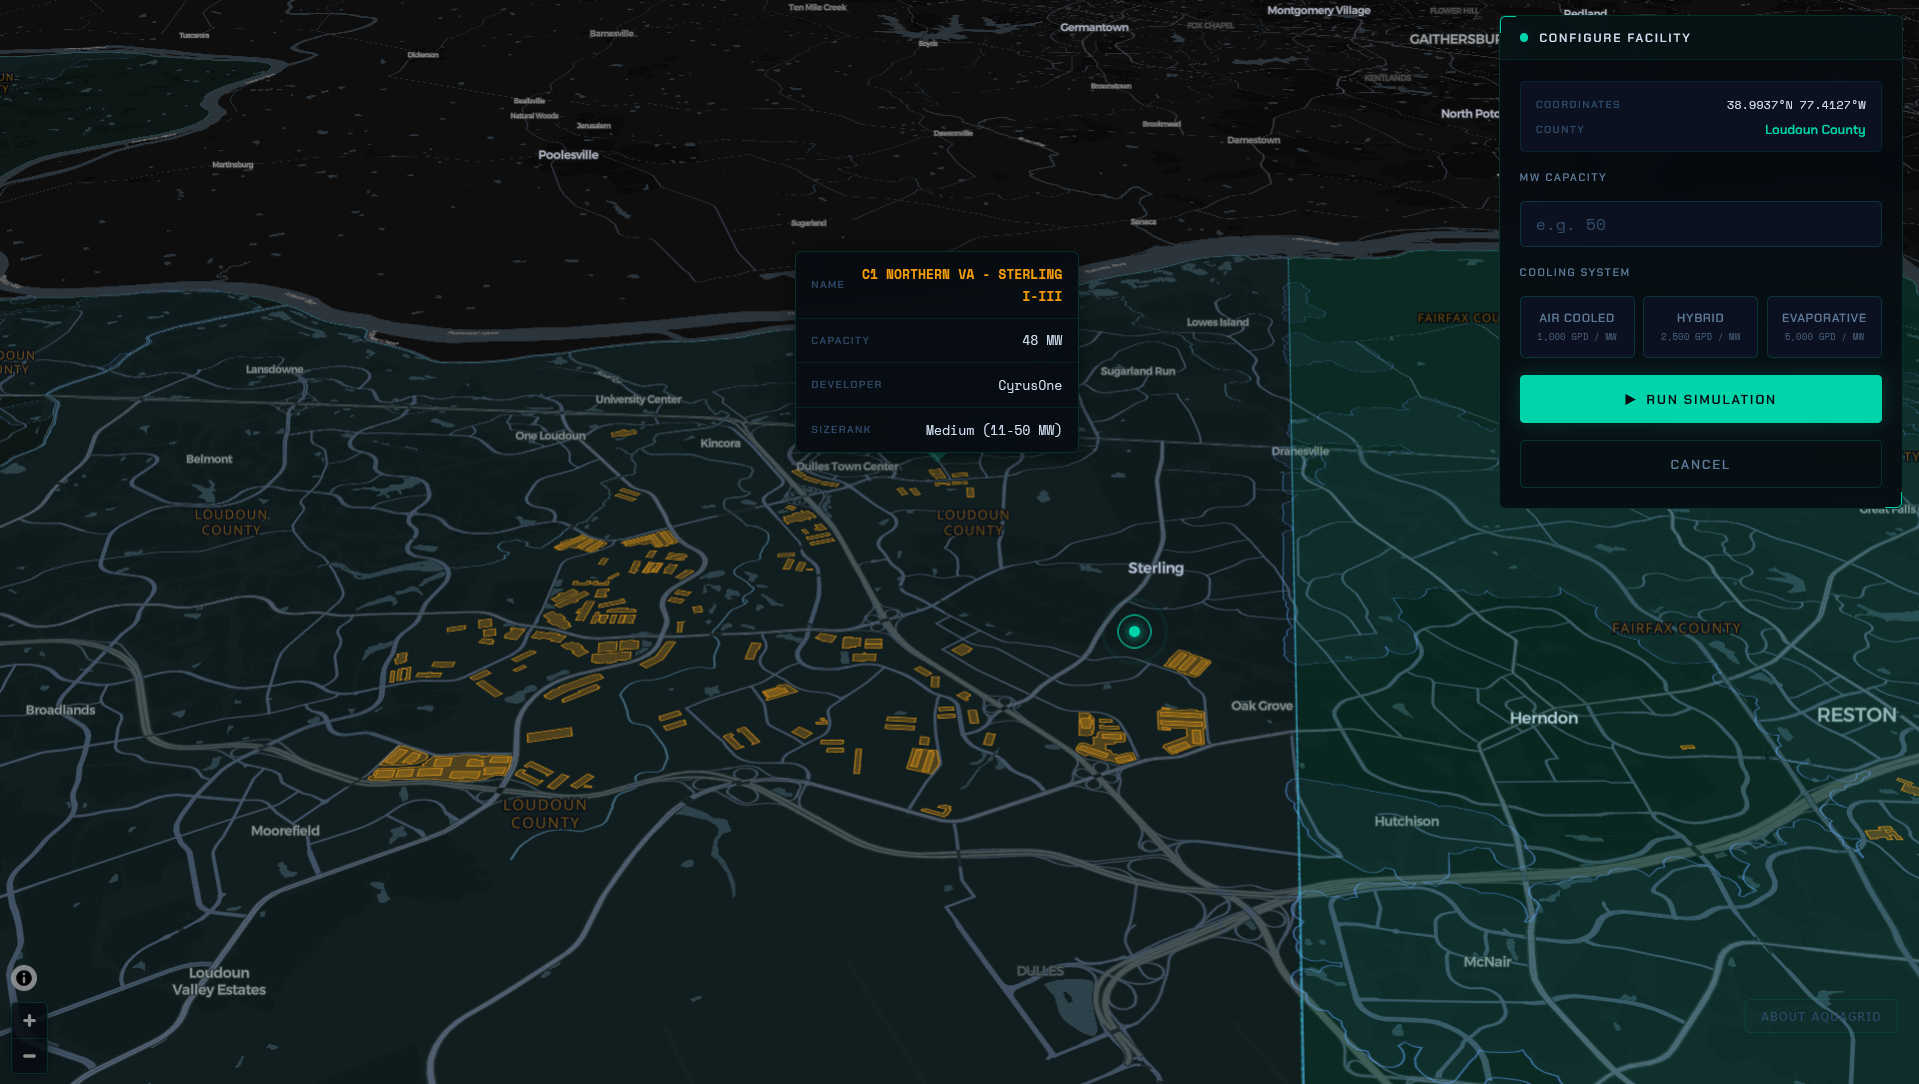
- Click to propose a new facility
- Enter megawatts and cooling type
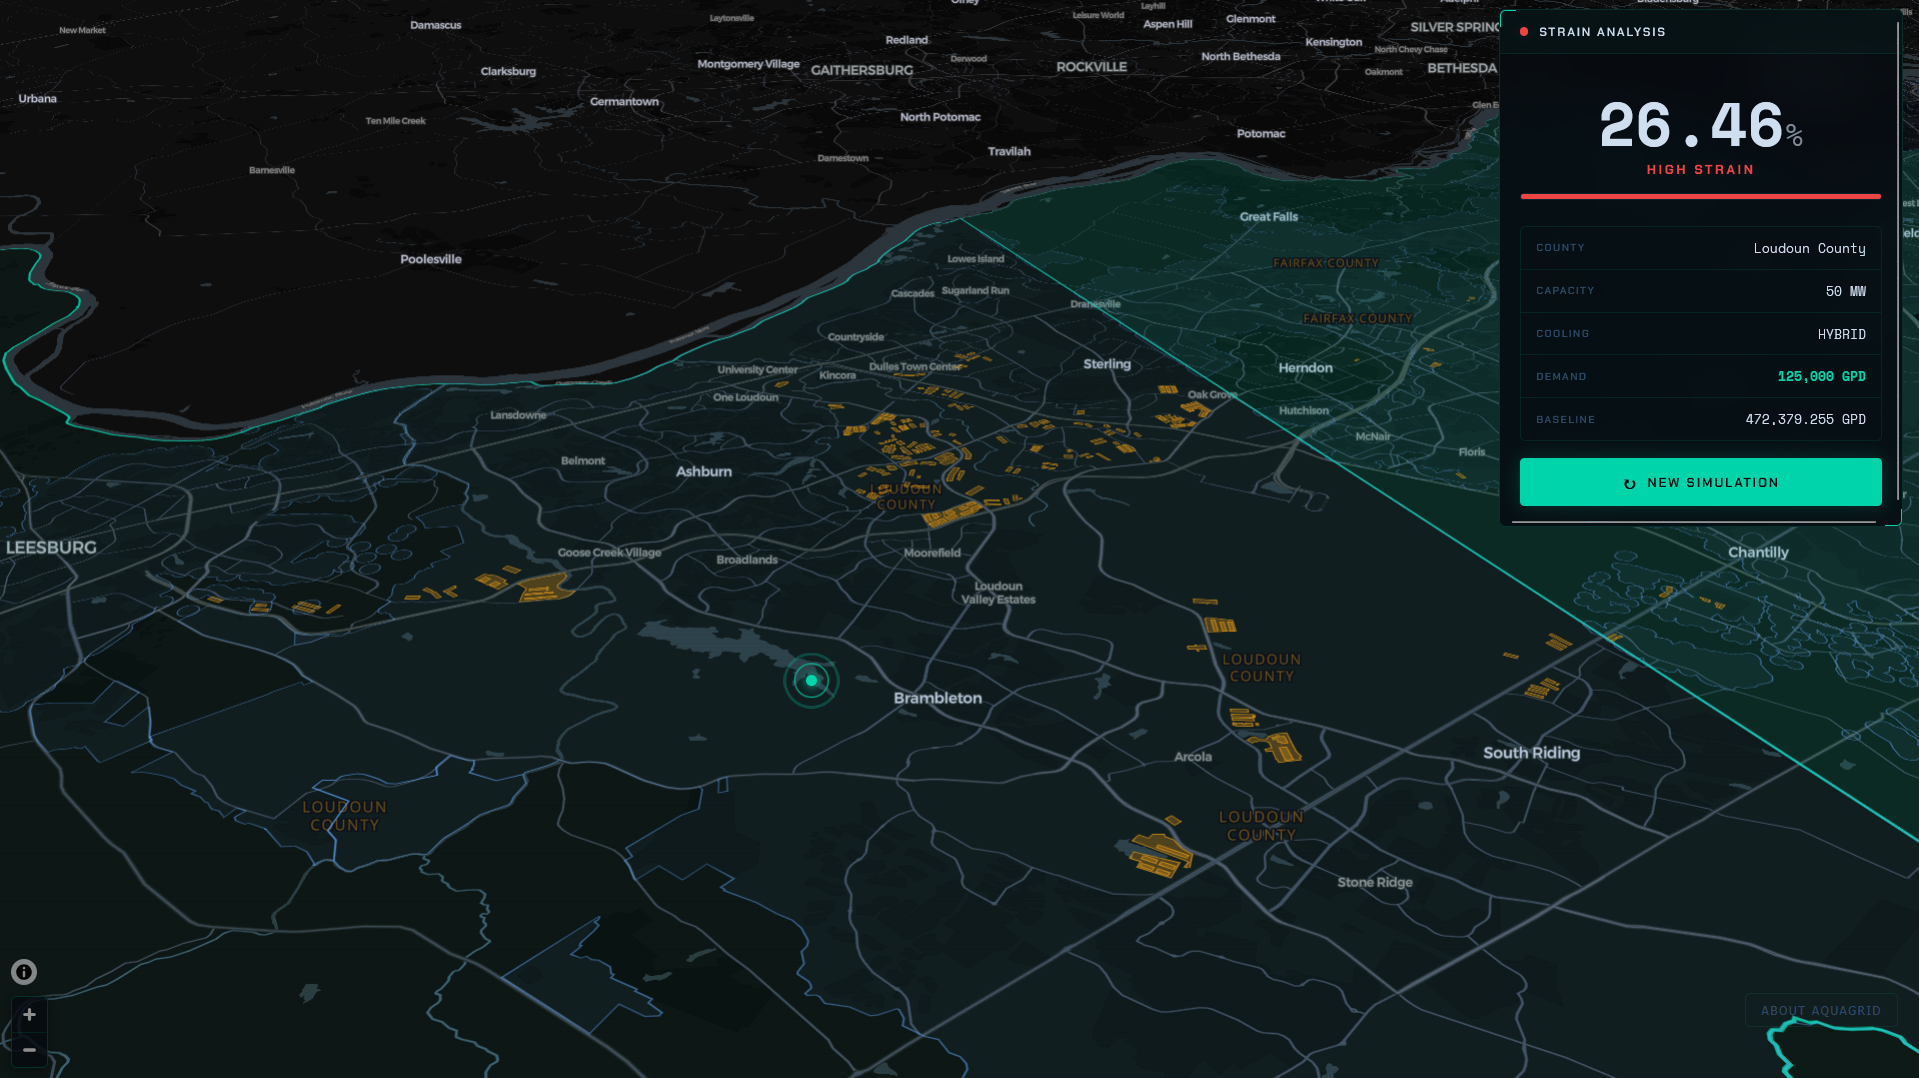
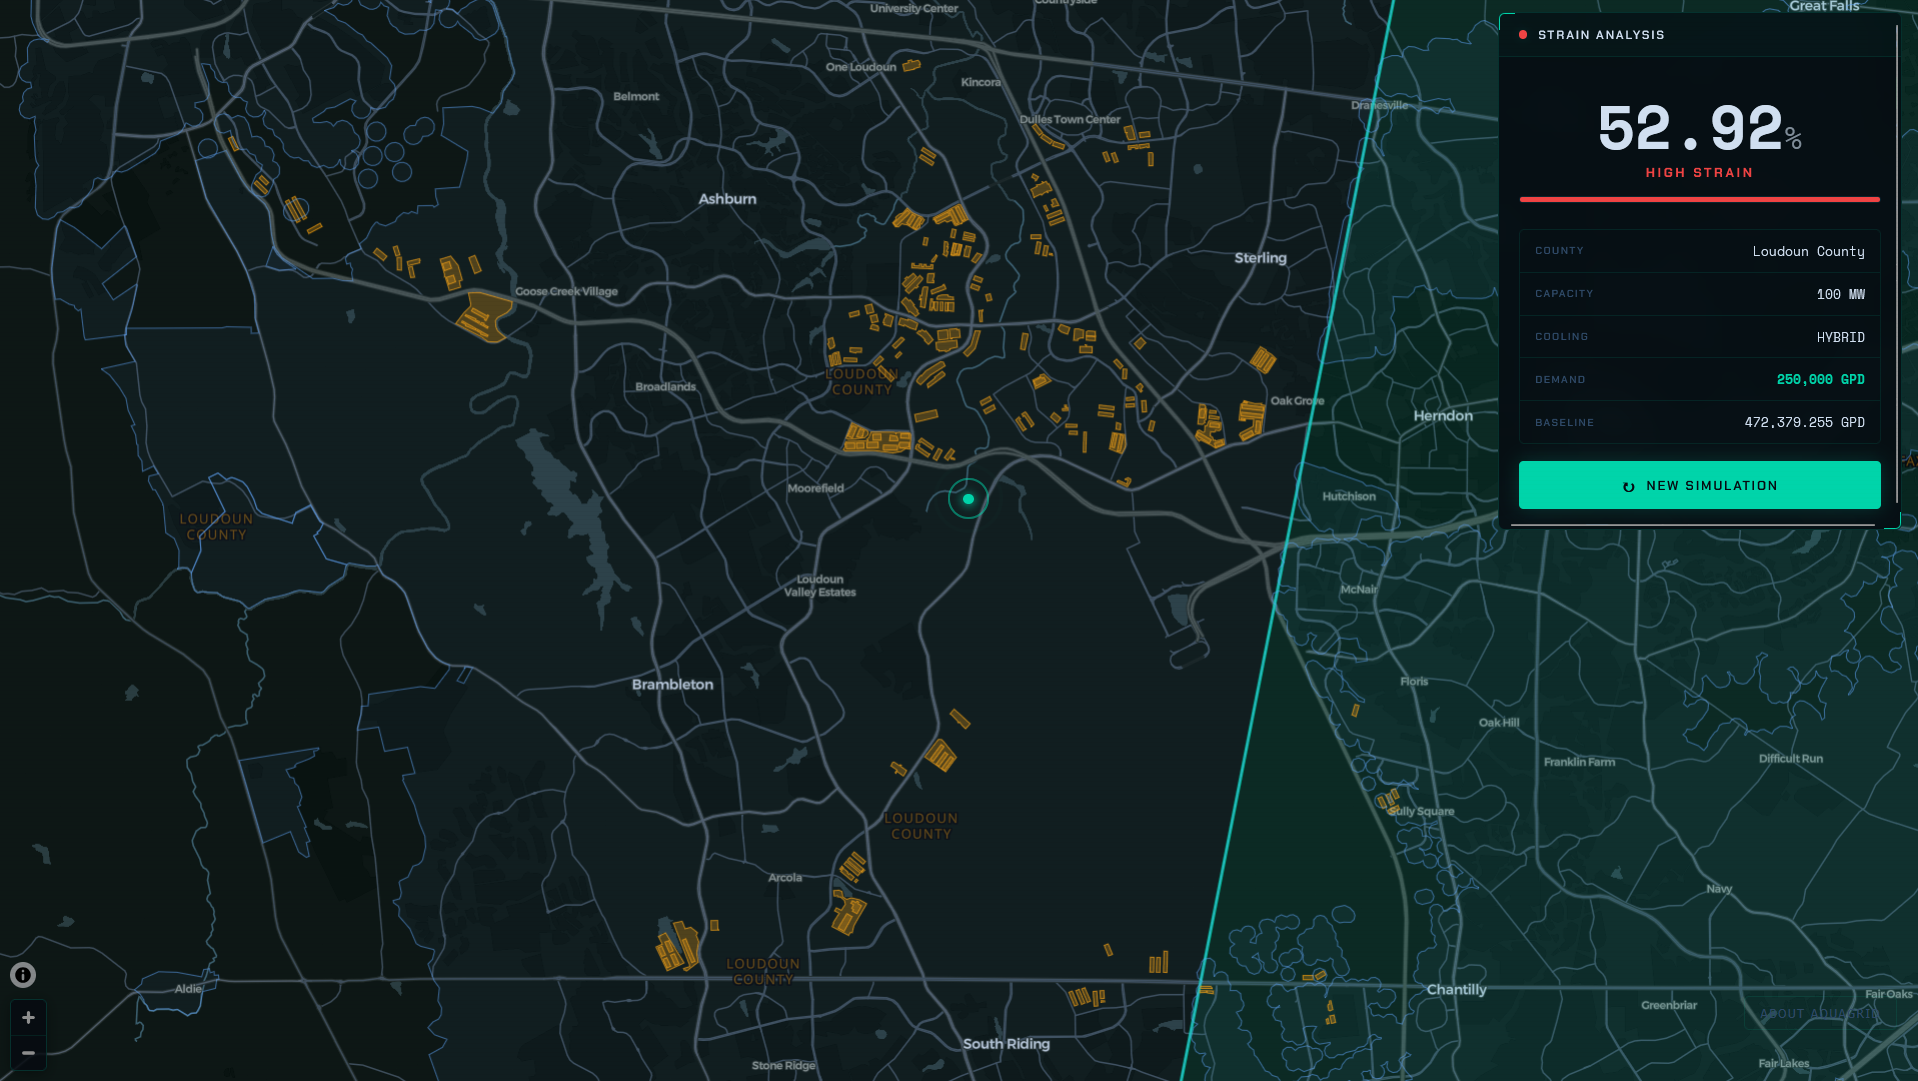
- Instantly calculate % increase in county water use
How We Built It
- React + MapLibre (frontend)
- FastAPI + Shapely (backend)
- OpenStreetMap + static water data
Click → detect county → estimate water demand → calculate strain.
What We Learned
Cooling design dramatically changes water impact. Even small percentage increases can represent massive daily water use.
Why It Matters
As AI infrastructure scales, communities need clearer tools to evaluate tradeoffs. AquaGrid helps makes water impact visible before it happens.
Built With
- fastapi
- javascript
- python
- react
- shapely
- uvicorn
- vite

Log in or sign up for Devpost to join the conversation.