-
-
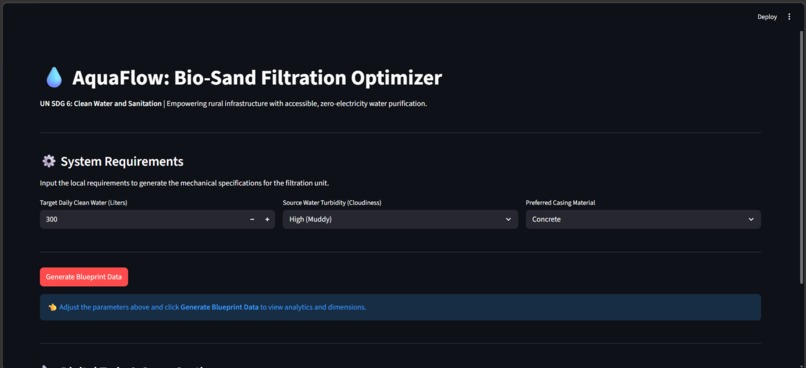
AquaFlow main interface where users input target daily yield, local water turbidity, and available casing materials.
-
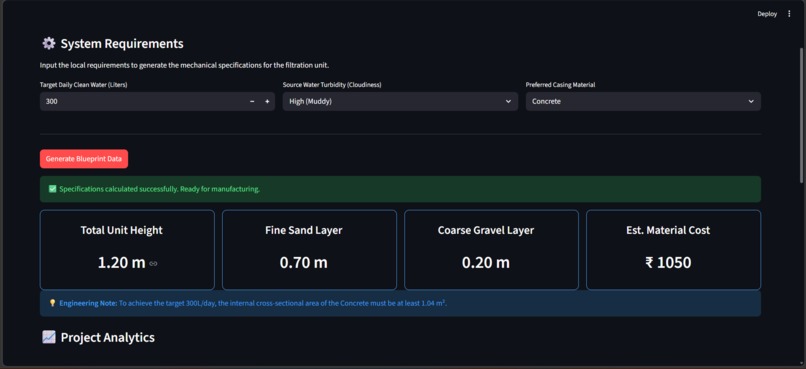
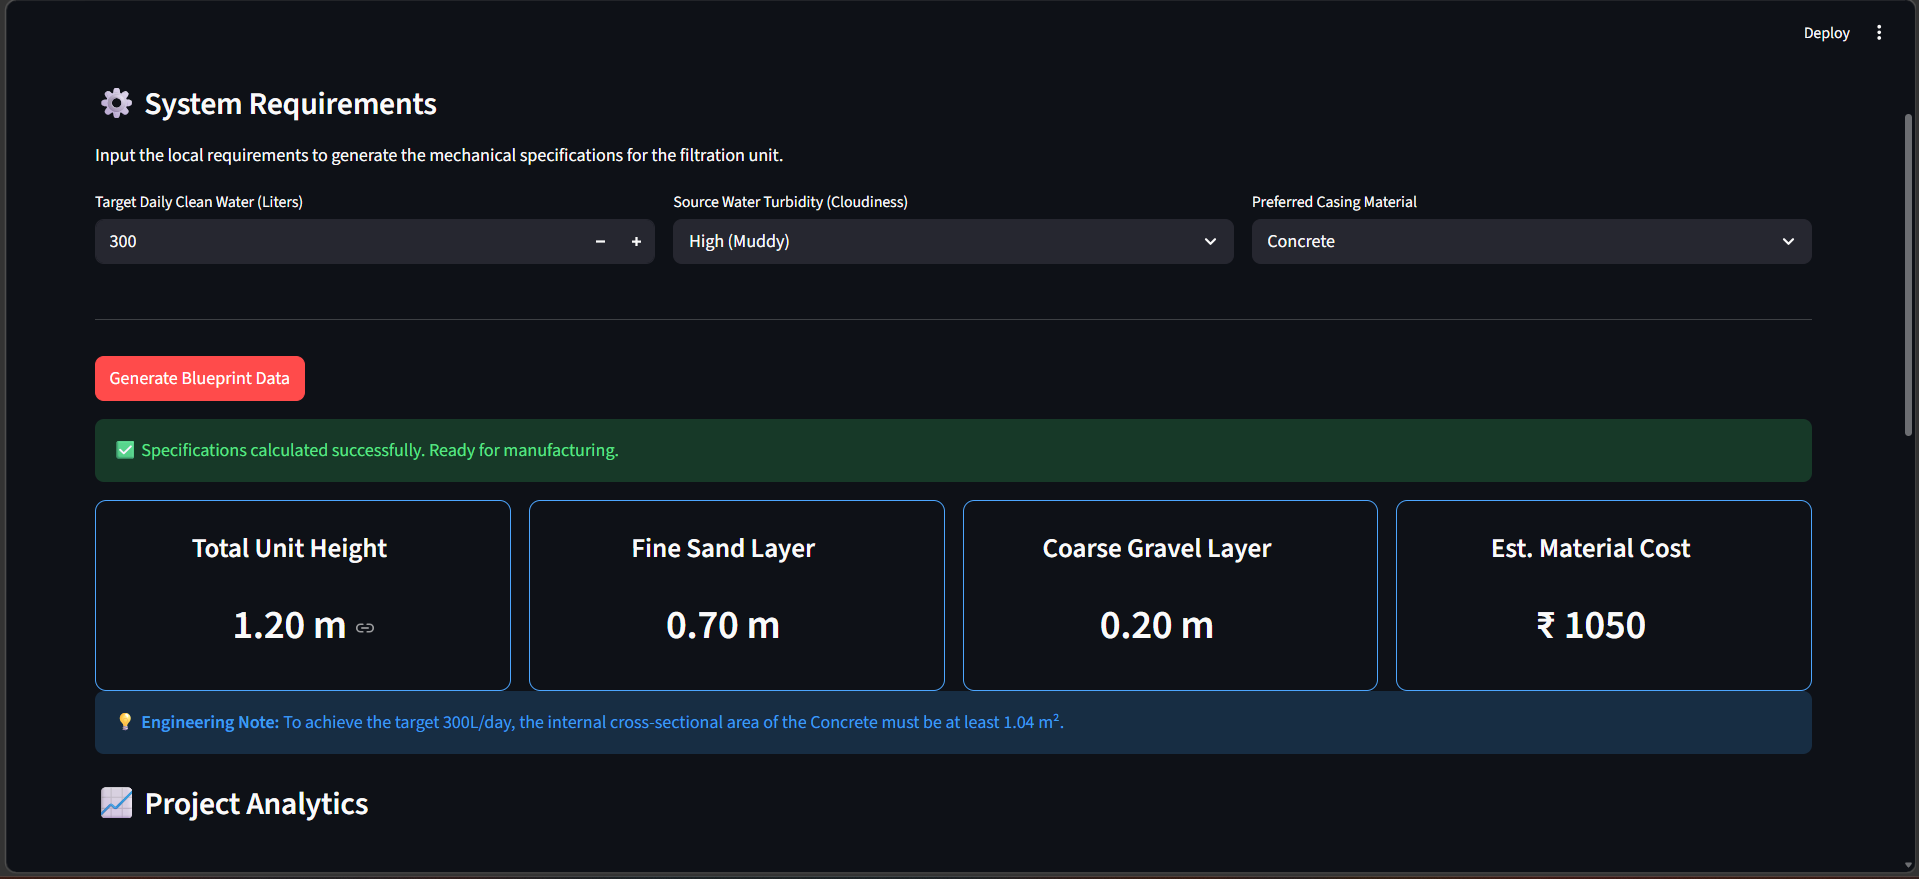
Generated mechanical blueprints displaying total unit height, dynamic layer depths, and estimated material costs.
-
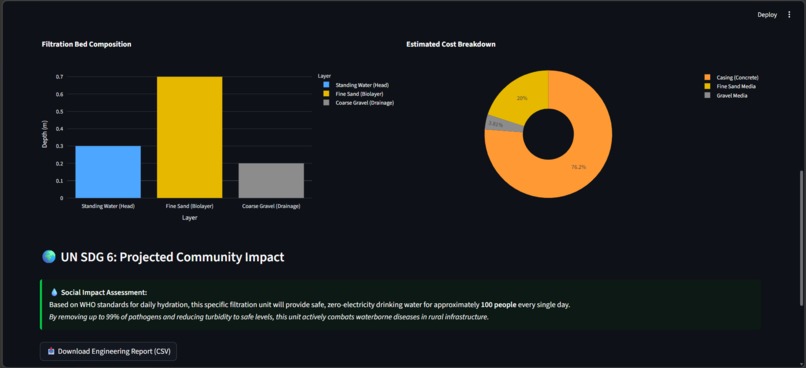
Interactive project analytics and the UN SDG 6 Social Impact Tracker, calculating the exact number of people served daily.


Inspiration
Access to clean drinking water is a fundamental human right. However, in many rural regions, communities are limited by the high cost and electricity dependency of commercial Reverse Osmosis (RO) systems.
Bio-sand filters offer a proven, zero-electricity alternative for high-turbidity groundwater—but their construction often relies on guesswork due to lack of precise design tools.
AquaFlow was created to bridge this gap—combining computational design with mechanical engineering to enable anyone to accurately design and build an efficient water filtration system on-site. What It Does
AquaFlow is a mechanical engineering and computational design dashboard aligned with UN SDG 6 (Clean Water and Sanitation).
Users input:
Target daily water yield Local water turbidity Preferred casing material
The system instantly computes:
Optimal depth of the schmutzdecke (biolayer), sand, and gravel layers Required internal cross-sectional area Estimated material cost based on local parameters Social impact: number of people served per day (based on WHO standards)
This transforms complex engineering calculations into practical, build-ready specifications.
How We Built It
The application is powered by Python as the core computation engine, with Streamlit used to build a responsive, interactive web interface.
Pandas handles structured data processing Plotly generates dynamic visualizations for: Layer composition Cost breakdown
The system is grounded in hydraulic retention time principles, ensuring sufficient filtration time for pathogen removal.
These calculations are fully automated to produce real-world engineering outputs.
Challenges
Managing dynamic state in Streamlit was a key challenge. Since the framework reruns the script on every interaction, maintaining UI stability—especially for Plotly visualizations—required:
Careful session state handling Custom CSS adjustments Stabilizing metric containers to prevent layout shifts
Accomplishments Successfully translated mechanical and fluid dynamics principles into a working software system Built a tool that generates actionable construction blueprints, not just visual data Created a solution with direct real-world impact potential, addressing water accessibility
What I Learned Deep integration of data visualization (Plotly) with web frameworks Designing software with physical-world applicability, not just digital outputs Structuring engineering logic into scalable computational workflows
What’s Next Integration of IoT sensors (Arduino-based turbidity sensors) for real-time data input Dynamic adjustment of filtration recommendations based on live conditions Addition of structural analysis modules to ensure casing durability under hydrostatic pressure

Log in or sign up for Devpost to join the conversation.