-
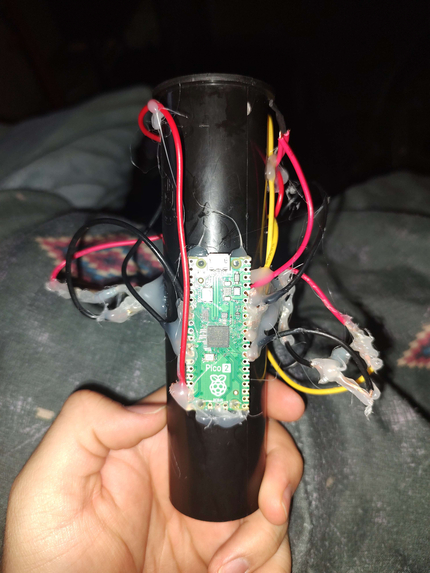
it's not a pipe bomb guys trust
-
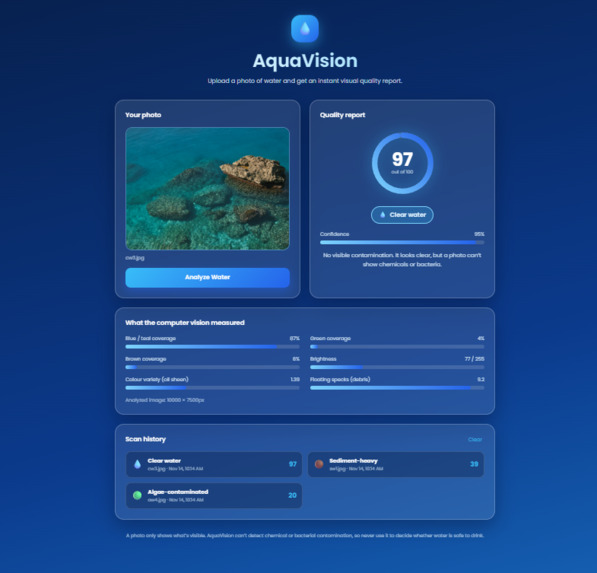
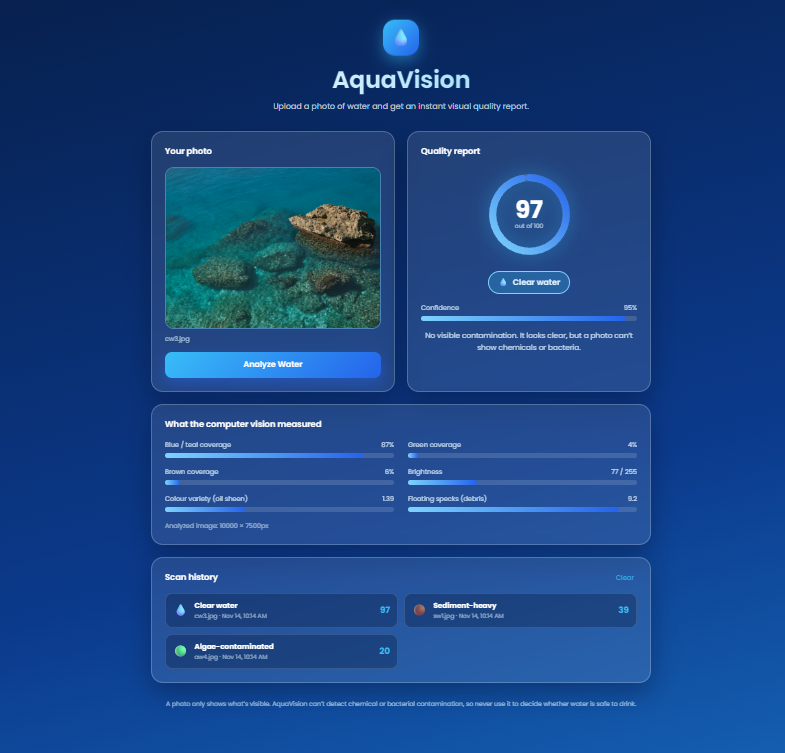
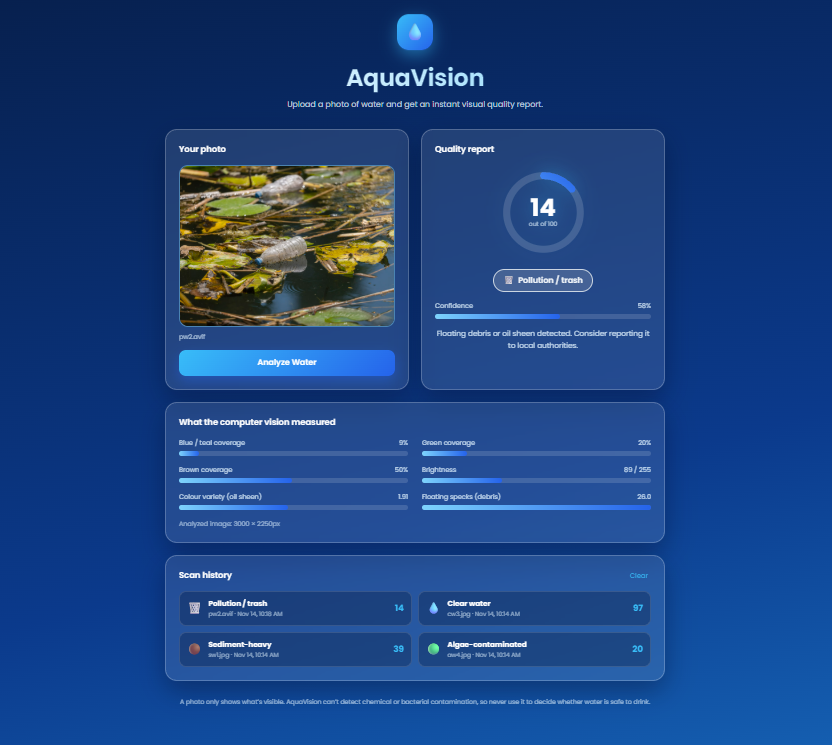
Upload a photo, get an instant report: score, label, confidence, and the measurements behind them.
-
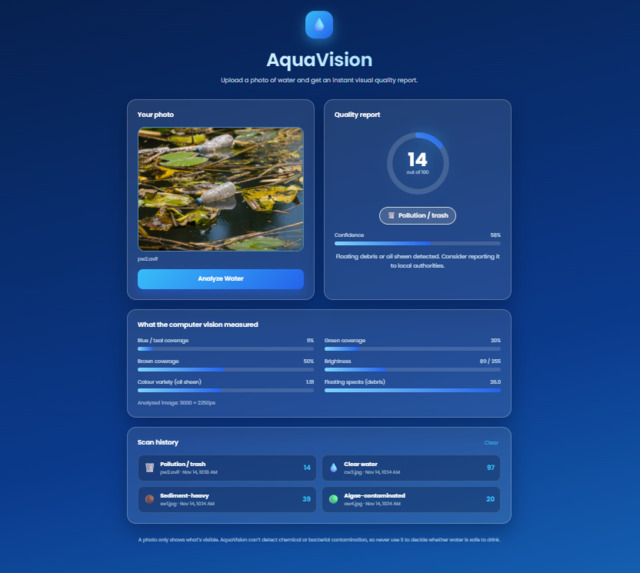
Floating bottles and debris detected: pollution, score 14/100
Inspiration
Checking water quality normally means lab tests or expensive sensors, and most people who spot a murky creek or a green pond have no way to tell how bad it is. We wanted something anyone could use with the phone already in their pocket: take a photo and see what’s in the water.
What it does
AquaVision analyzes a photo of water and returns a quality report:
- a score out of 100
- a classification: clear water, sediment-heavy, algae-contaminated, or pollution (floating trash or oil sheen)
- a confidence level and a plain-language recommendation
- a panel showing the measurements behind the result, such as green, blue and brown colour coverage, - colour variety and debris
- a history of recent scans
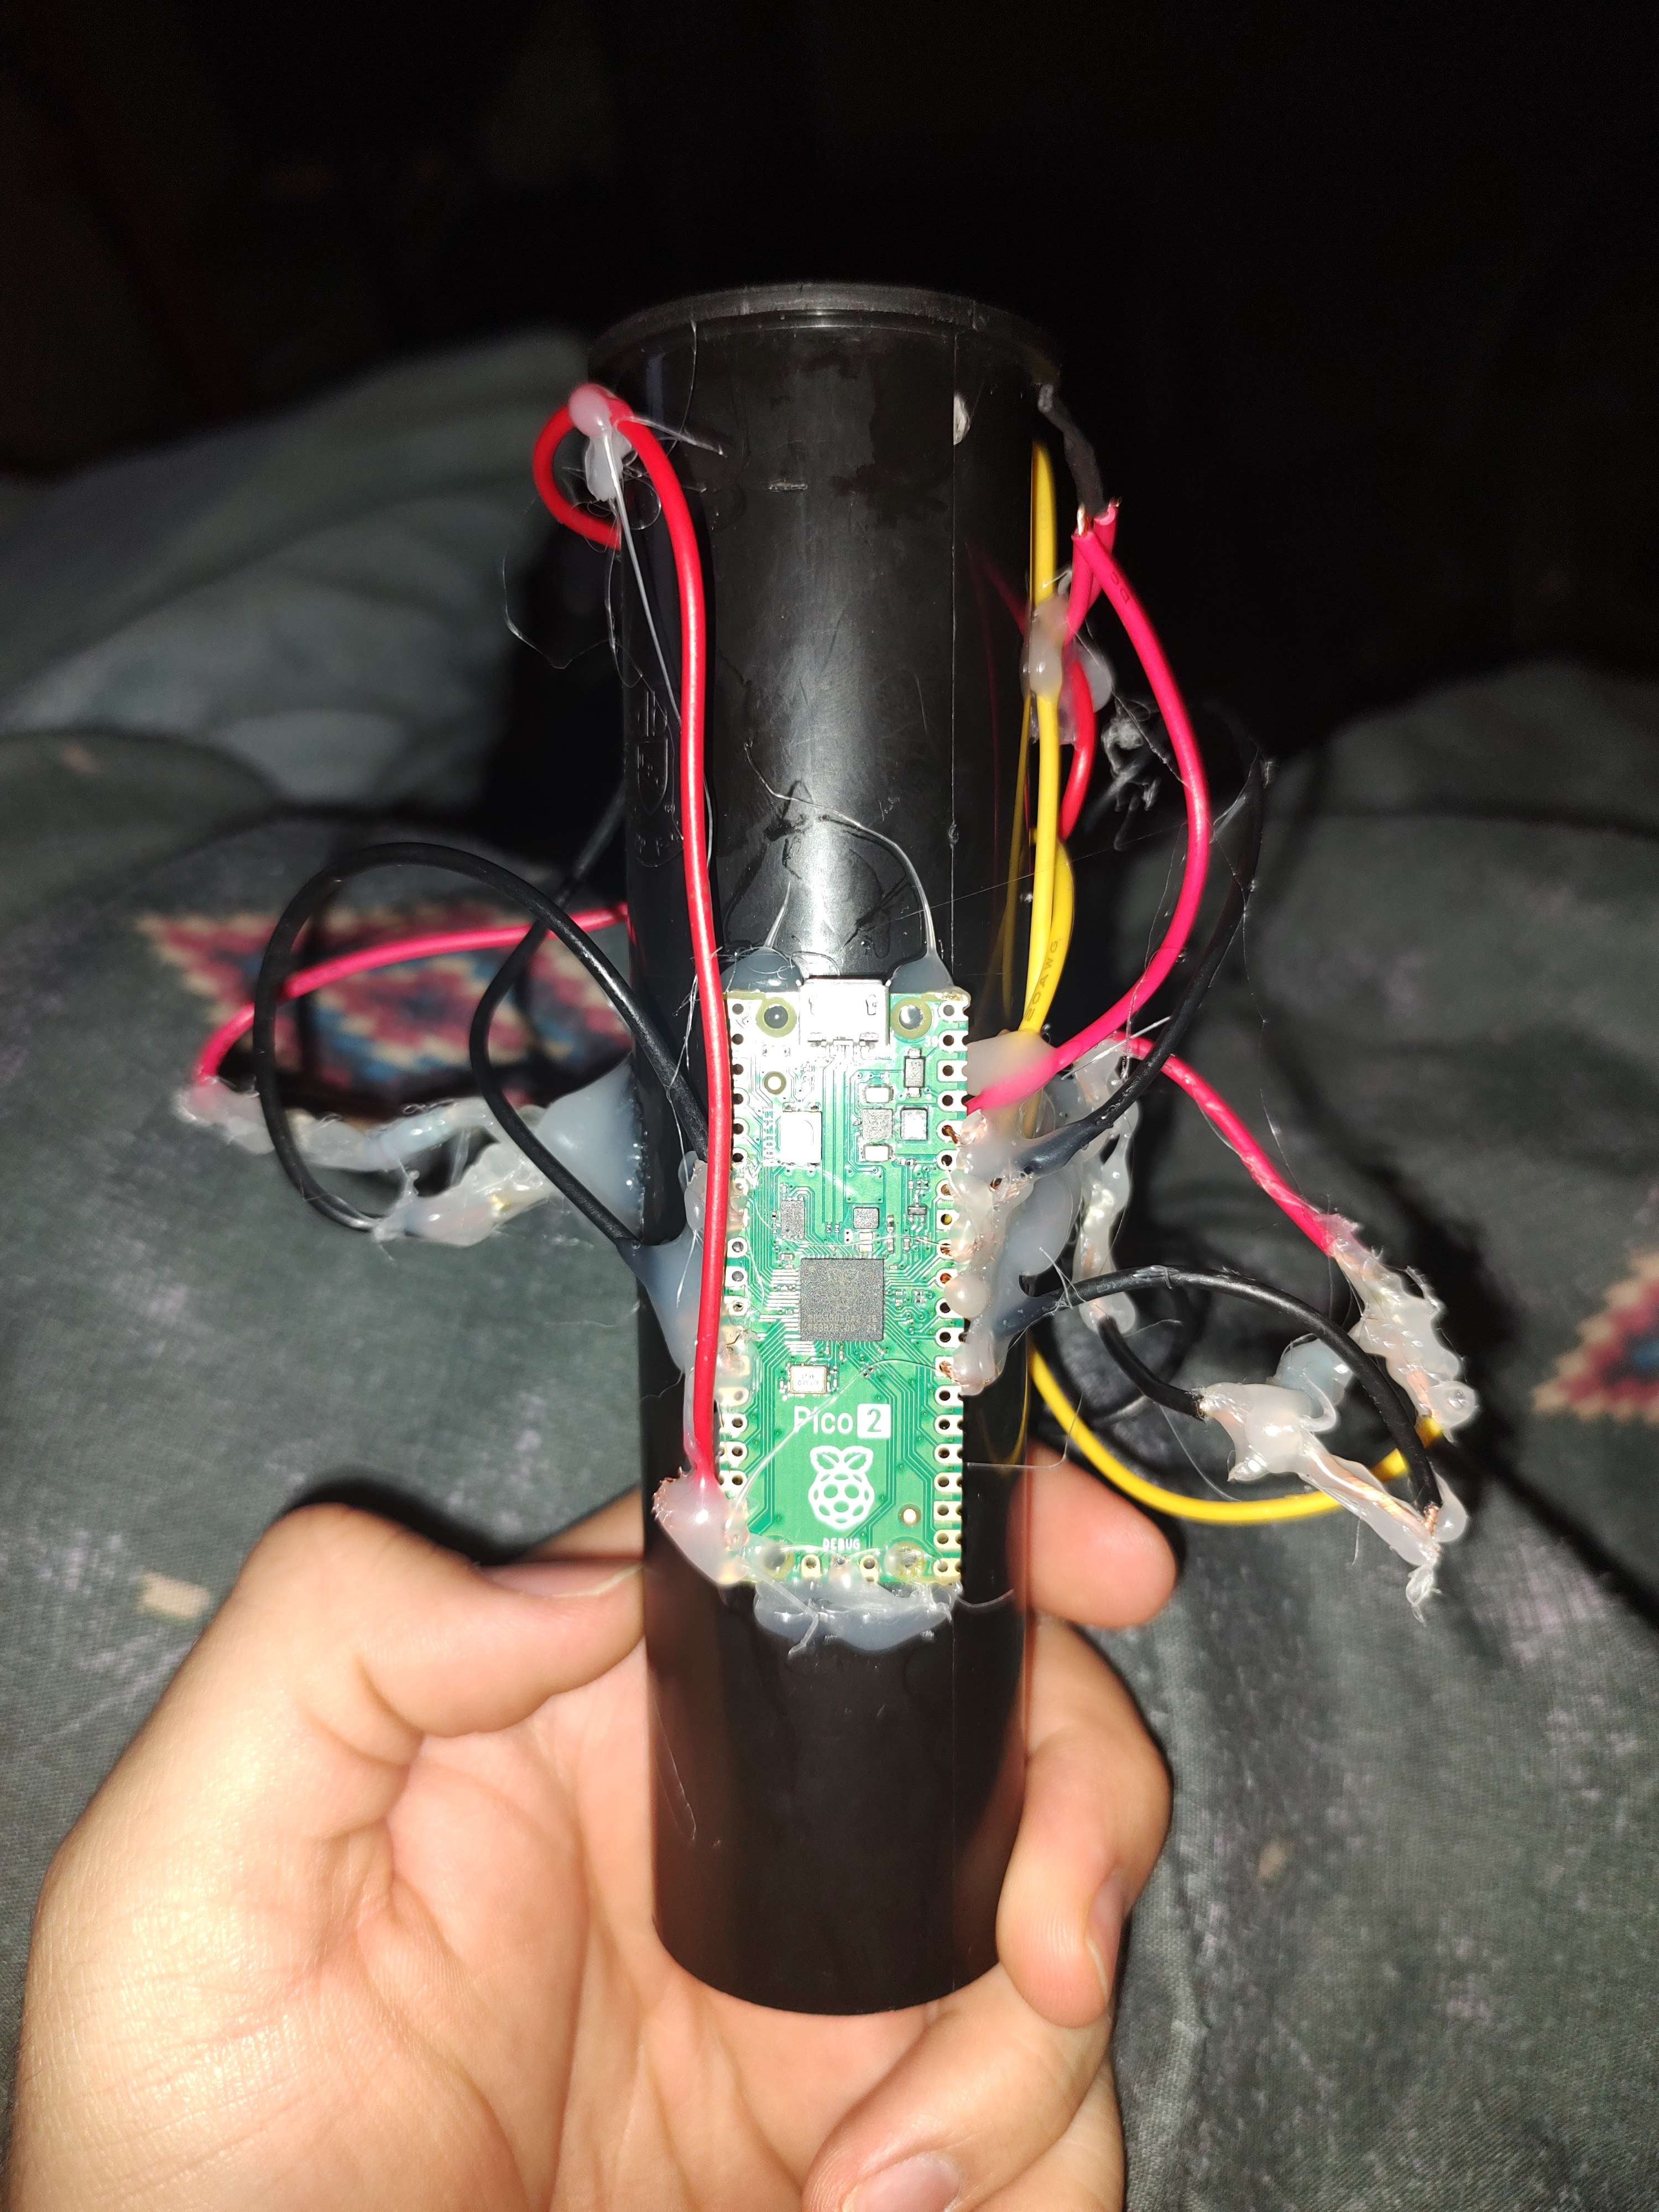
- Hardware: a turbidity sensor sends a cloudiness reading to the app. The photo tells us what is in the water, and the sensor tells us how cloudy it is
A photo only shows what’s visible, so AquaVision can’t detect chemicals or bacteria, and it’s not a replacement for lab testing.
How we built it
Frontend: React and Vite, with a drag-and-drop uploader, an animated score gauge and the scan history.
Backend: Flask receives the photo and passes it to OpenCV.
Computer vision: we convert each image to HSV colour space and measure the share of green, blue and brown pixels, how many different colours appear (rainbow oil sheen stands out), and small high-contrast specks that suggest floating debris.
Classifier and scoring: rules over those features choose the category, and each category has its own score band, so the score and label always agree.
Robustness: safe upload filenames, a fallback decoder for formats like AVIF, and clean errors for unreadable files.
Challenges we ran into
Average colour isn’t enough. Rocks, trees, sky and even hands in the photo drowned out the signal from the water, so we moved to measuring coverage of specific colours instead.
Our first score contradicted our own label. A clear-water photo could score lower than an algae photo. We fixed it by giving each class its own score band.
A tiny dataset. We started with 12 images, and our thresholds fit them better than they’d fit new photos. We’re upfront about that rather than quoting an inflated accuracy.
Accomplishments that we're proud of
- A complete, working product from upload to report, rather than a notebook.
- A UI that makes the result easy to read at a glance.
- An honest evaluation: we report the baseline’s limits and plan to test on photos the model has never seen.
What we learned
Computer vision on real-world photos is mostly about the data: lighting, angle and background matter as much as the algorithm. We also learned how much of a demo’s credibility comes from showing failures honestly.
What's next for Aqua Vision
- Grow the dataset and replace the rules with a trained machine learning classifier (pretrained image features plus a small model), keeping the rules as a fallback
- Live turbidity sensor integration
- A map of scans so communities can track local water bodies over time
- A mobile-friendly camera capture
