-
-
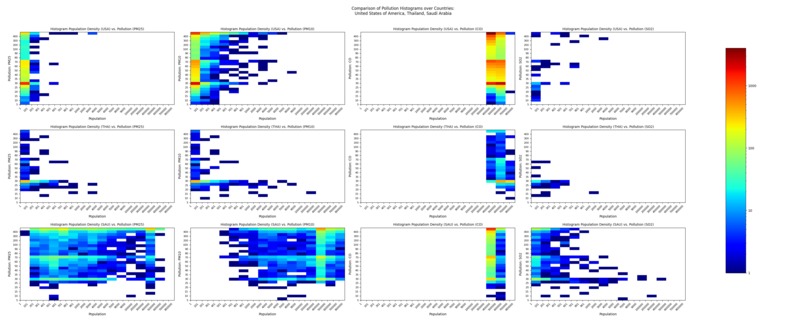
A side-by-side comparison of population density and pollution concentration across three countries and three pollutants.
-
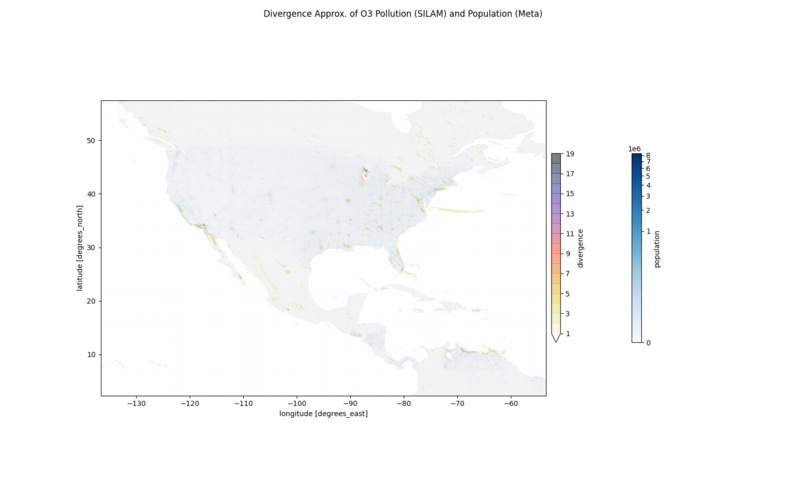
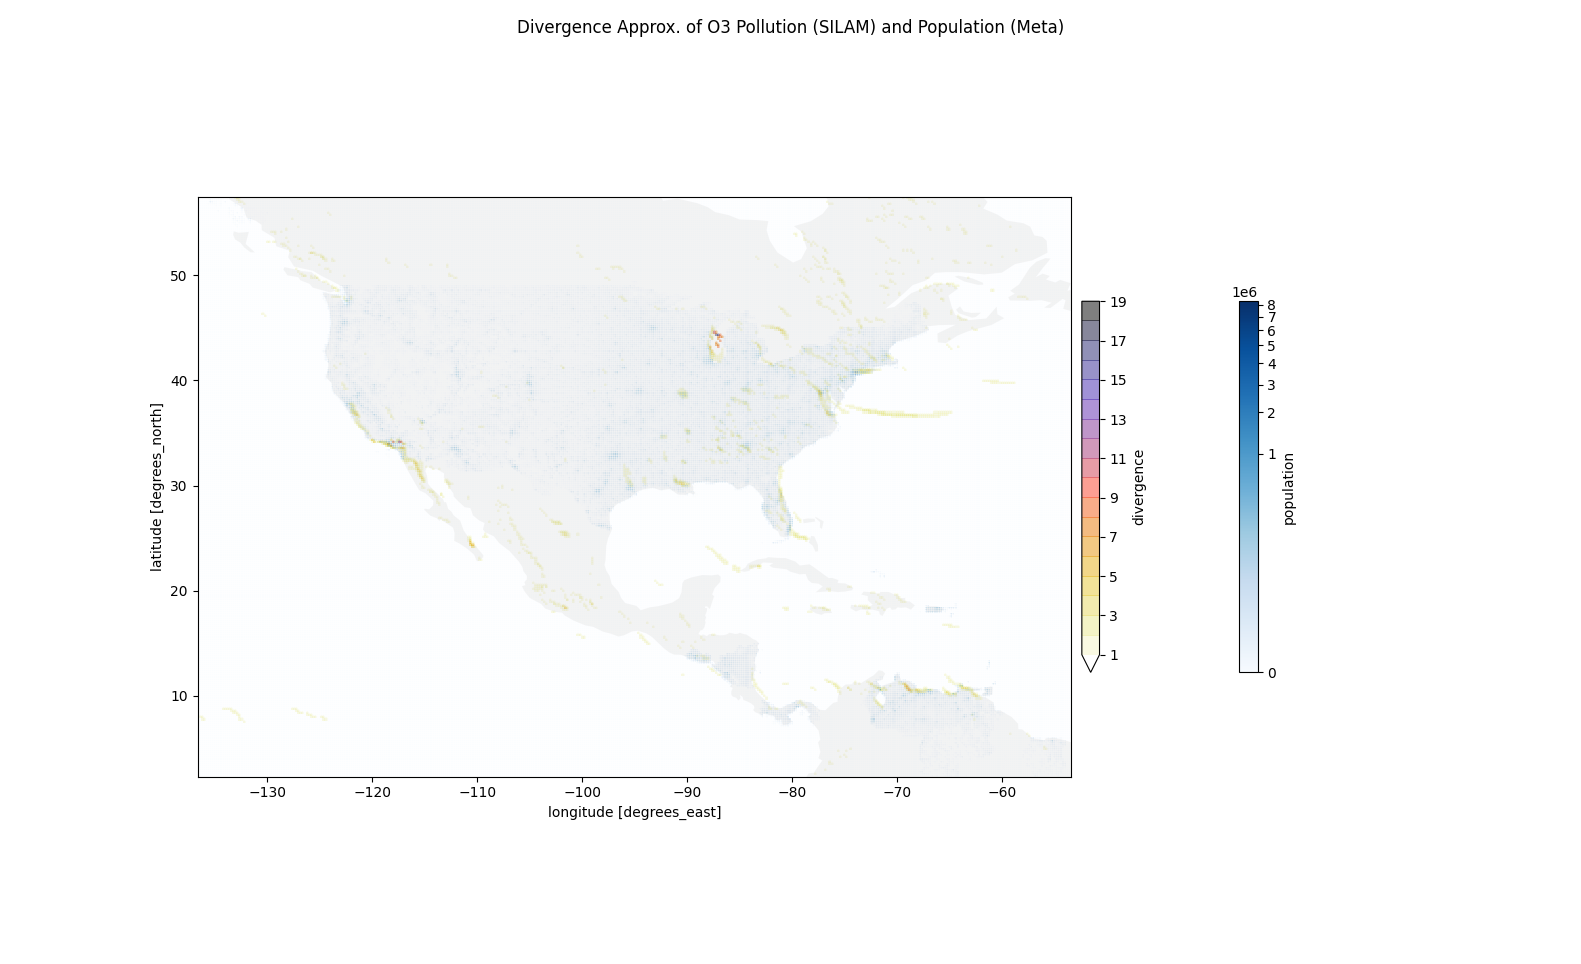
An estimate of O3 pollution sources in North/Central America
-
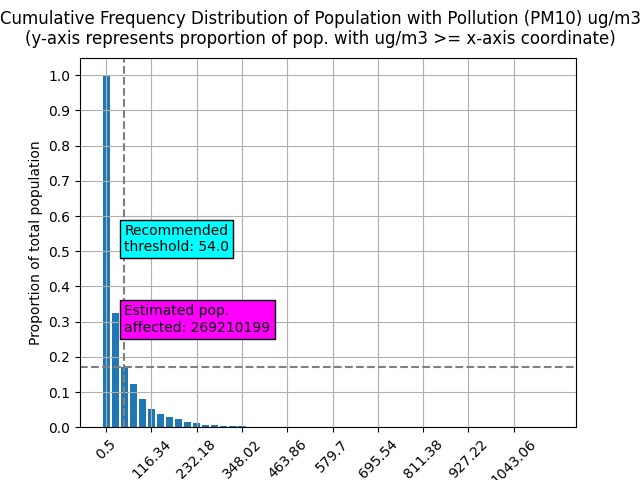
A cumulative frequency distribution of the est. population that lives with equal or greater than a given concentration of PM10 pollution


Inspiration
This project was inspired by the UN Sustainable Development Goals:
- Good Health and Well-being
- Sustainable Cities and Communities
Air pollution is known to take a huge toll on quality of life in different ways all over the world. This project is a research tool for analyzing pollution concentration over population density. It supports analysis towards the following questions:
- How many people are estimated to be affected by an unhealthy level of pollution, for any given pollutant?
- Where are the sources of pollution? Do they correlate generally with population density?
- For a given set of countries, how does pollution correlate with population density? Do high-pollution areas tend to exist outside of population centers?
This tool can provide support for researchers looking to understand the causes, effects, and potential areas of improvement in the domain of air quality.
What it does
This project downloads and merges two datasets, the SILAM Air Quality dataset provided by the Finnish Meteorological Institute and the Population Density Map provided by CIESIN and Meta. After merging these two datasets into a single coordinate system, the user can run scripts to estimate the number of people affected by unhealthy levels of pollution, build histograms to display the distribution of pollution concentration across population density, and generate maps that show the estimated pollution sources overlayed with population.
How we built it
This is a simple python repository with functionality for interfacing with Amazon S3, conducting numerical analysis with NumPy, and plotting with Matplotlib.
Challenges we ran into
There is little open-source data on health outcomes and energy production methods. If these were known, there may be a good analytical case to make around the causal relationships between energy production, population density, and health outcomes.
Accomplishments that we're proud of
Hopefully, this provides a useful starting point for researchers interested in investigating the effect pollution has on human health with these datasets.
What we learned
Research would benefit from more open-source data around energy production methods, and health outcomes.
What's next for AQ View
- Integrate information from specific energy sources like traffic pollution, wood-burning stoves, oil refineries, and landfills into an analysis of air pollution. Integrate information like health surveys to analyze the effect air pollution has on quality of life.
- Propose hypothetical outcomes given some trade-off between energy production methods. For example, if majority coal producing countries shifted 10% of their total energy mix to nuclear, how much aggregate SO2 and NO pollution would decrease?
Built With
- python
- s3

Log in or sign up for Devpost to join the conversation.