Inspiration
I’m a Tableau developer and I’ve worked on real funnel / acquisition dashboards where GA4-style data is huge, messy, and hard to explain fast. When conversion drops, the team usually ends up in Slack trying to figure out “what changed” and “who owns it,” and the dashboard becomes just a report instead of a tool that helps people act. I wanted to rebuild that same kind of project in Tableau Next to show what’s possible when you combine a strong semantic layer with agentic Q&A and workflow actions. This hackathon was a perfect excuse to turn a dashboard into something a marketing or product team could actually run day-to-day.
What it does
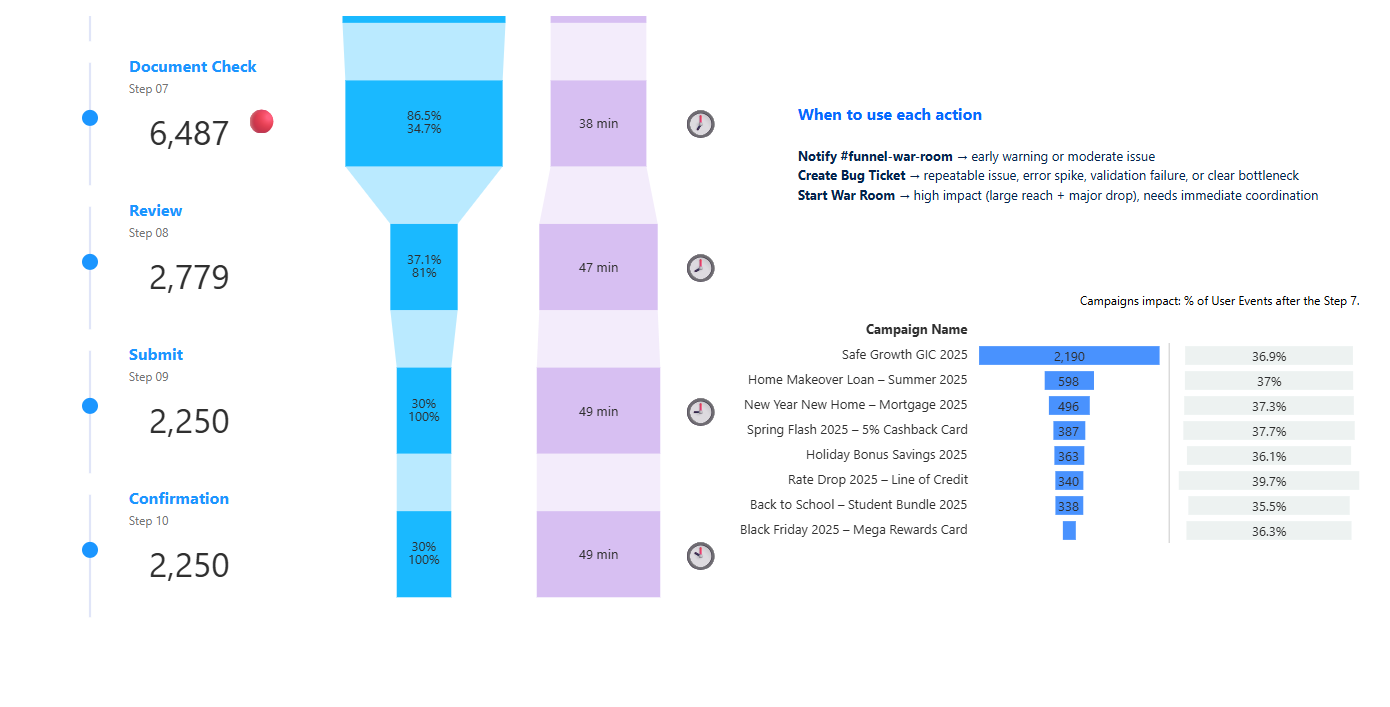
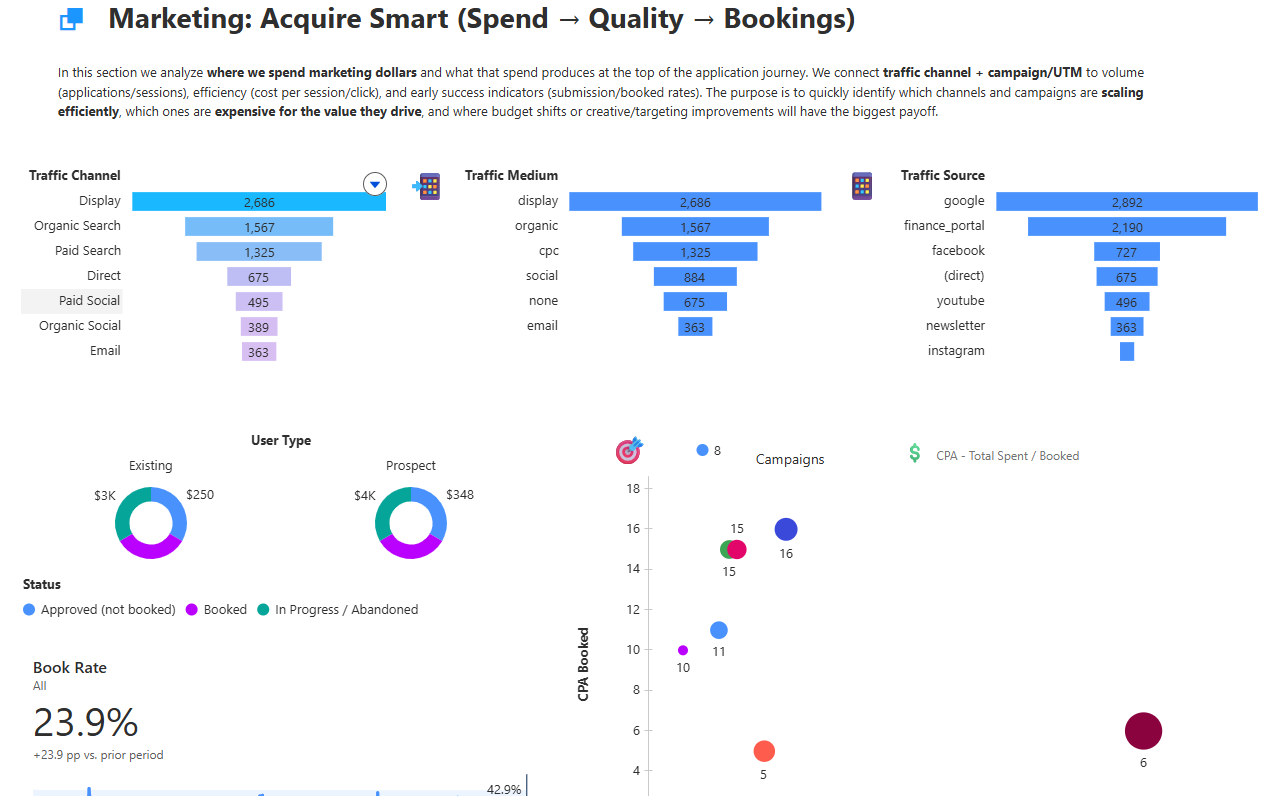
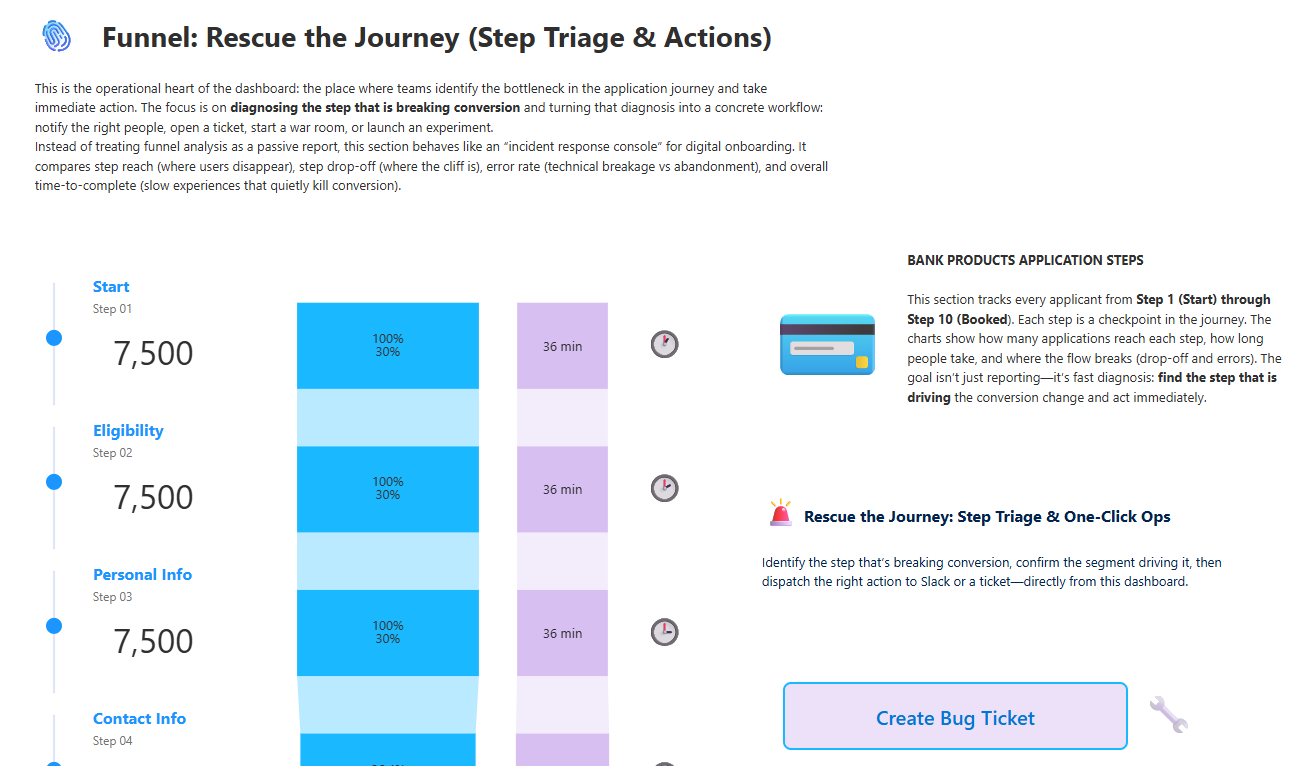
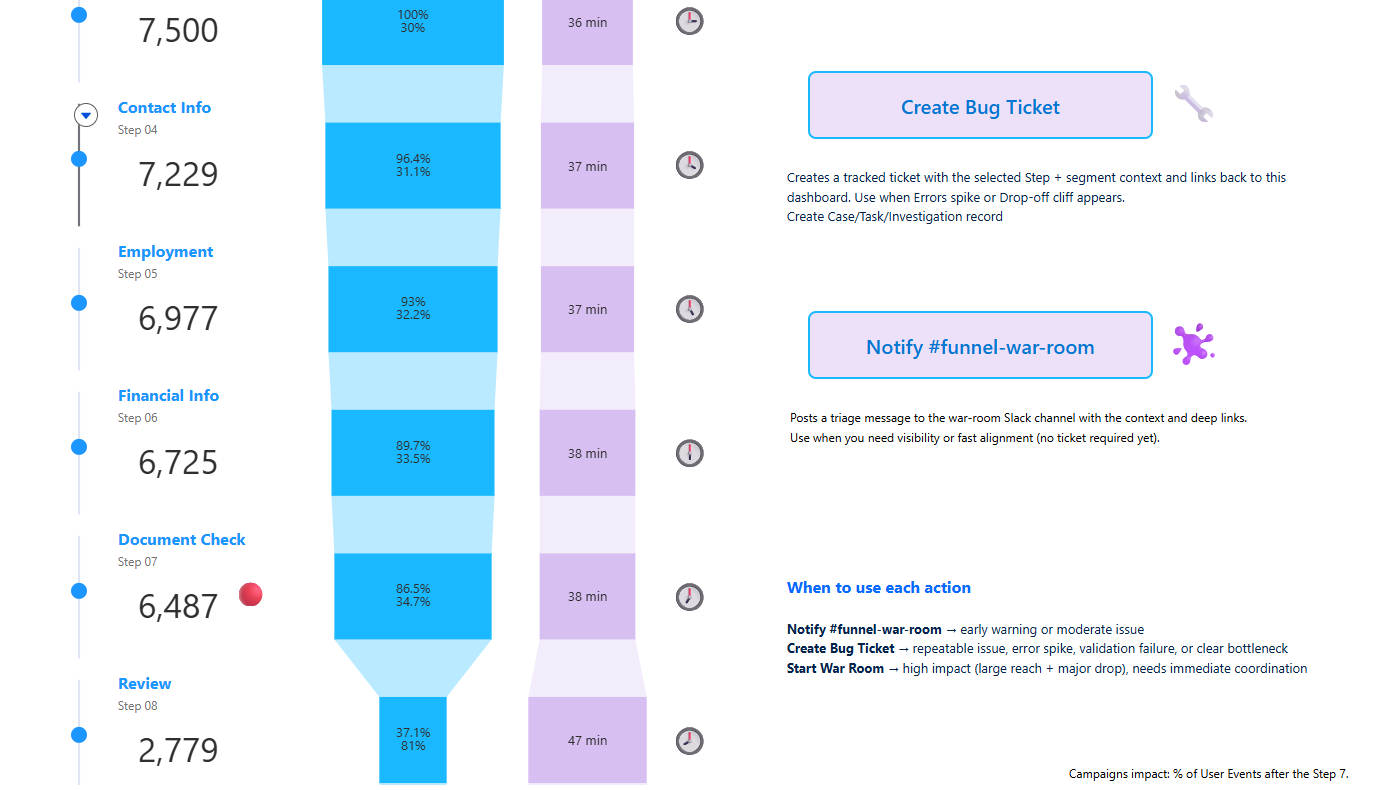
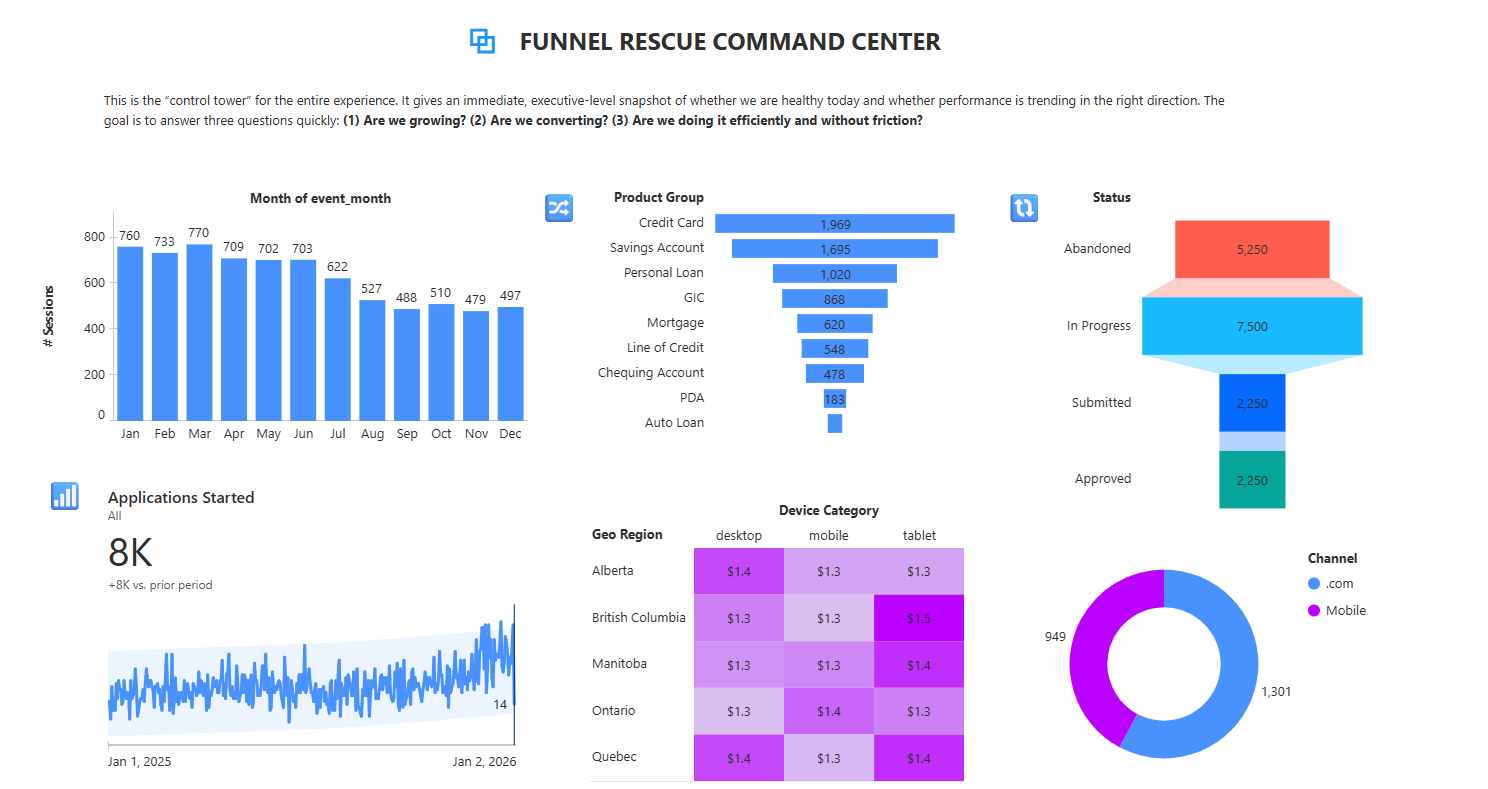
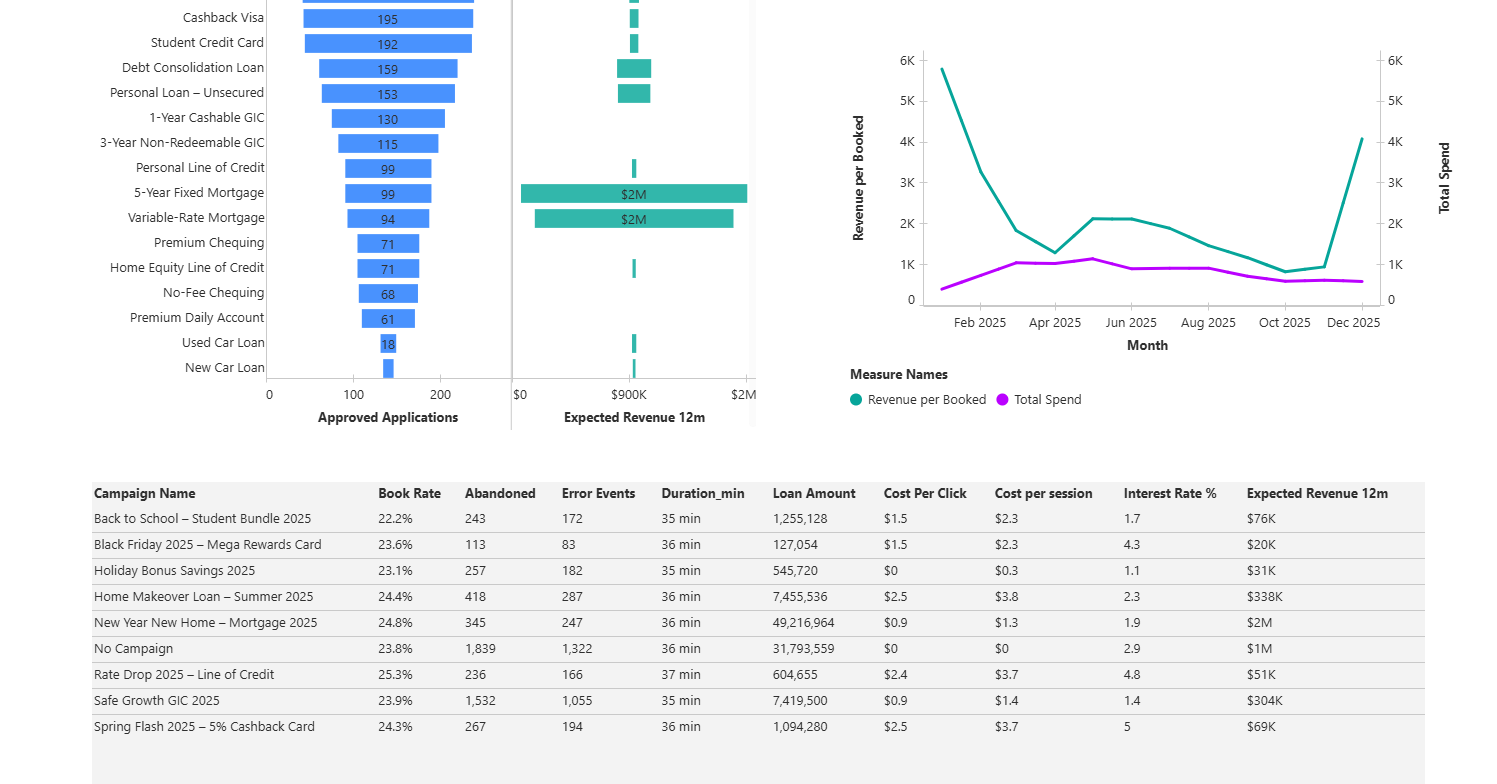
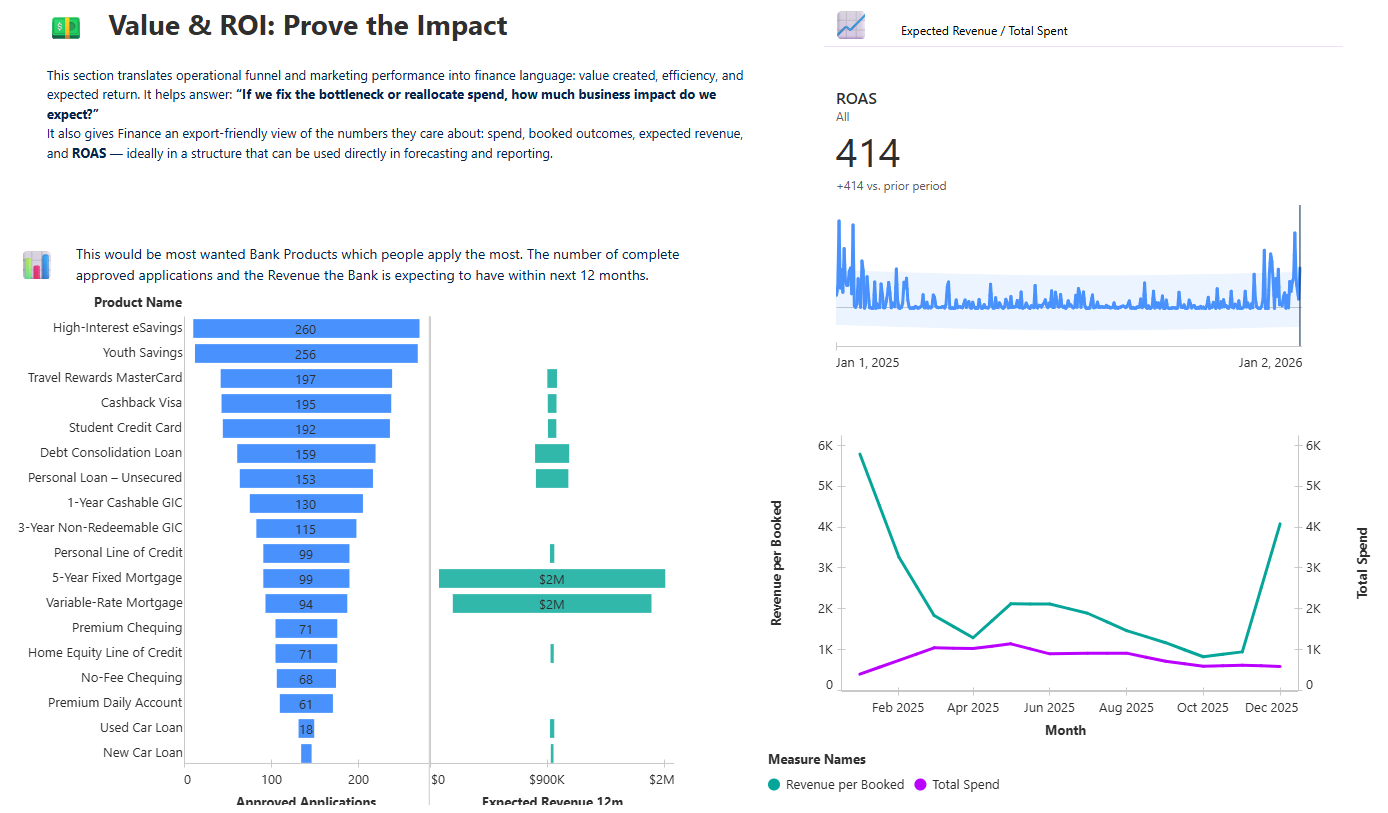
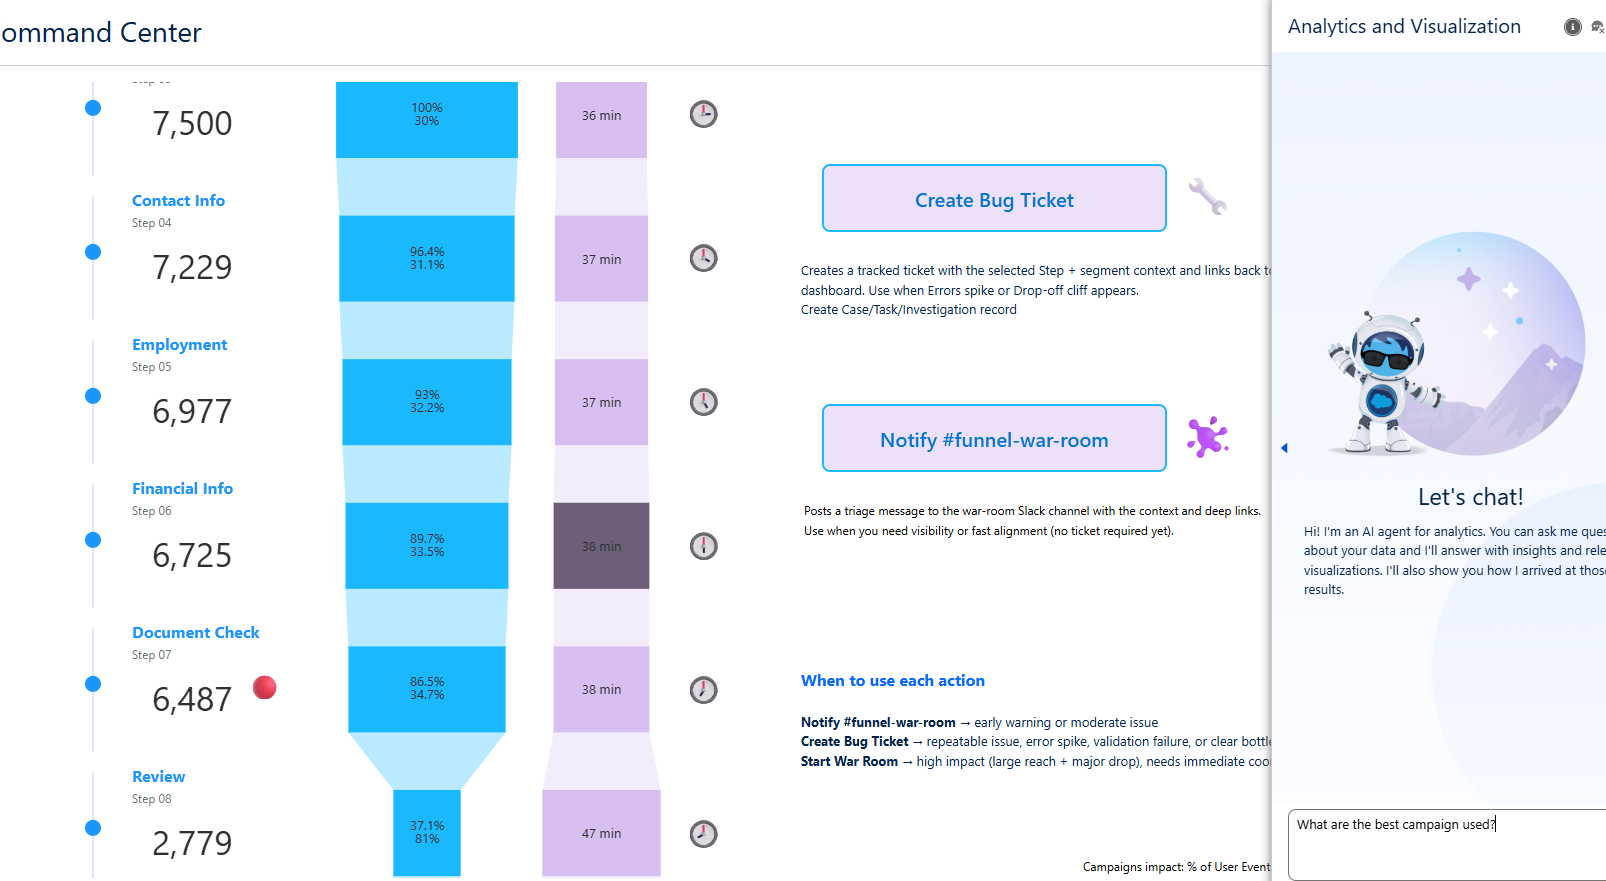
Apply_IQ is a one‑page, tall Tableau Next command center for acquisition → funnel steps → ROI. Shows the key KPIs (Started, Booked, Book Rate, Error Rate, CPA, ROAS) with trends and a simple outlook. Breaks performance into Marketing, Funnel Steps, and Value/ROI so it’s easy to triage. Lets a user ask questions in plain language (agentic chat) using consistent business definitions from the semantic layer. Adds “dispatch” actions in the Funnel section: Create Bug Ticket, Notify #funnel-war-room, Start War Room (Slack + ticketing).
How I built it
I started with GA4-style event data and cleaned it so the core metrics don’t double count. I built a curated semantic model: certified metrics, clean naming, and field descriptions. I added Business Preferences so the agent answers using the same definitions (ex: “conversion” = Book Rate). I designed a single tall dashboard with clear sections: Pulse → Marketing → Funnel Ops → ROI. I wired action buttons to Salesforce Flow so the dashboard can trigger Slack/ticket workflows using the current filter context (step, channel, device, region, date).
Challenges I ran into
Tableau Next chart + calculation features are more limited than Desktop, so I had to keep visuals simple and push complex logic into the data prep/model. GA4 event-level data can easily inflate spend/revenue if you don’t model grain properly. Agentic Q&A is only as good as the semantic model, so I spent time on definitions and guardrails instead of fancy visuals. Making actions “demo-proof” (always working the same way) meant relying on filters + clean Flow inputs.
Accomplishments that I’m proud of
I turned a funnel dashboard into an ops console: not just insights, but actions. The semantic model is clean enough that a non-analyst can ask questions and get consistent answers. The Funnel section has a real workflow feel: detect the bad step → confirm the segment → dispatch Slack/ticket actions. The whole thing is packaged like an accelerator that other teams could reuse.
What I learned
The semantic layer matters more than fancy charts—especially when you want AI answers to be trusted. “Simple visuals + strong workflow” beats complex visuals that don’t lead to action. If you want AI to be useful in analytics, you need defaults, vocabulary, and a consistent answer format. Building for reuse (templates, playbooks, message formats) makes the project feel like a product.
What’s next for Apply_IQ Funnel Rescue Command Center
Connect to a real GA4 pipeline (not just sample files) and refresh metrics automatically. Add an Action Log so I can show “ticket created → fix shipped → conversion recovered.” Expand the playbooks (step issues vs campaign issues) and auto-route ownership. Add a Tableau Cloud deep-dive view (for export-heavy finance workflows) and keep Next as the command center.
Package it as a reusable accelerator (semantic model blueprint + dashboard template + Flow templates + Slack message templates).
Built With
- action
- agentic
- salesforce
- slack
- tableau


Log in or sign up for Devpost to join the conversation.