-
-
Slack + Telegram
-
Apollo github issue, MCP
-
Architecture
-
Agent
-

Apollo

Inspiration
Modern engineering teams drown in alerts. When something breaks at 3 AM, the on-call engineer spends 30-90 minutes doing what is essentially pattern matching: dig through logs, cross-reference deployments, search for similar past incidents, find the runbook. Most of this data already exists in Elasticsearch.
The key insight: most incident response tools stop at detection. They page you, then you do the work. Apollo is an AI agent that autonoumously investigate, diagnose, and respond. It creates the incident record, alerts the team on Telegram and Slack, and recommends the exact rollback command. The engineer wakes up to a solved problem, not a mystery.
What it does
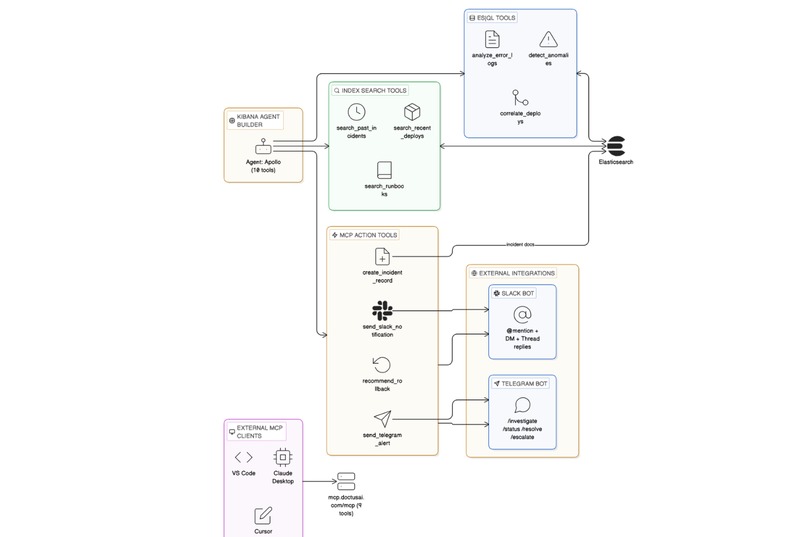
Apollo is a multi-tool AI agent built on Elastic Agent Builder that follows a structured 6-step SRE investigation protocol and then autonomously takes action:
Investigation (6 steps):
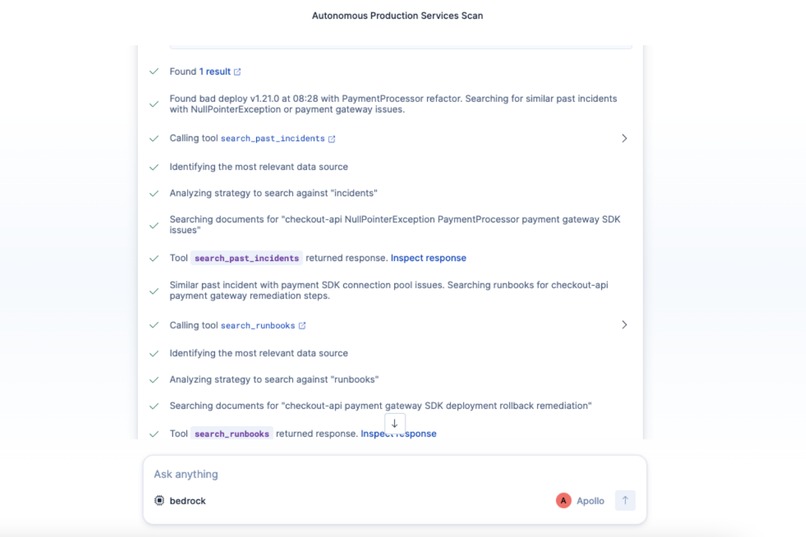
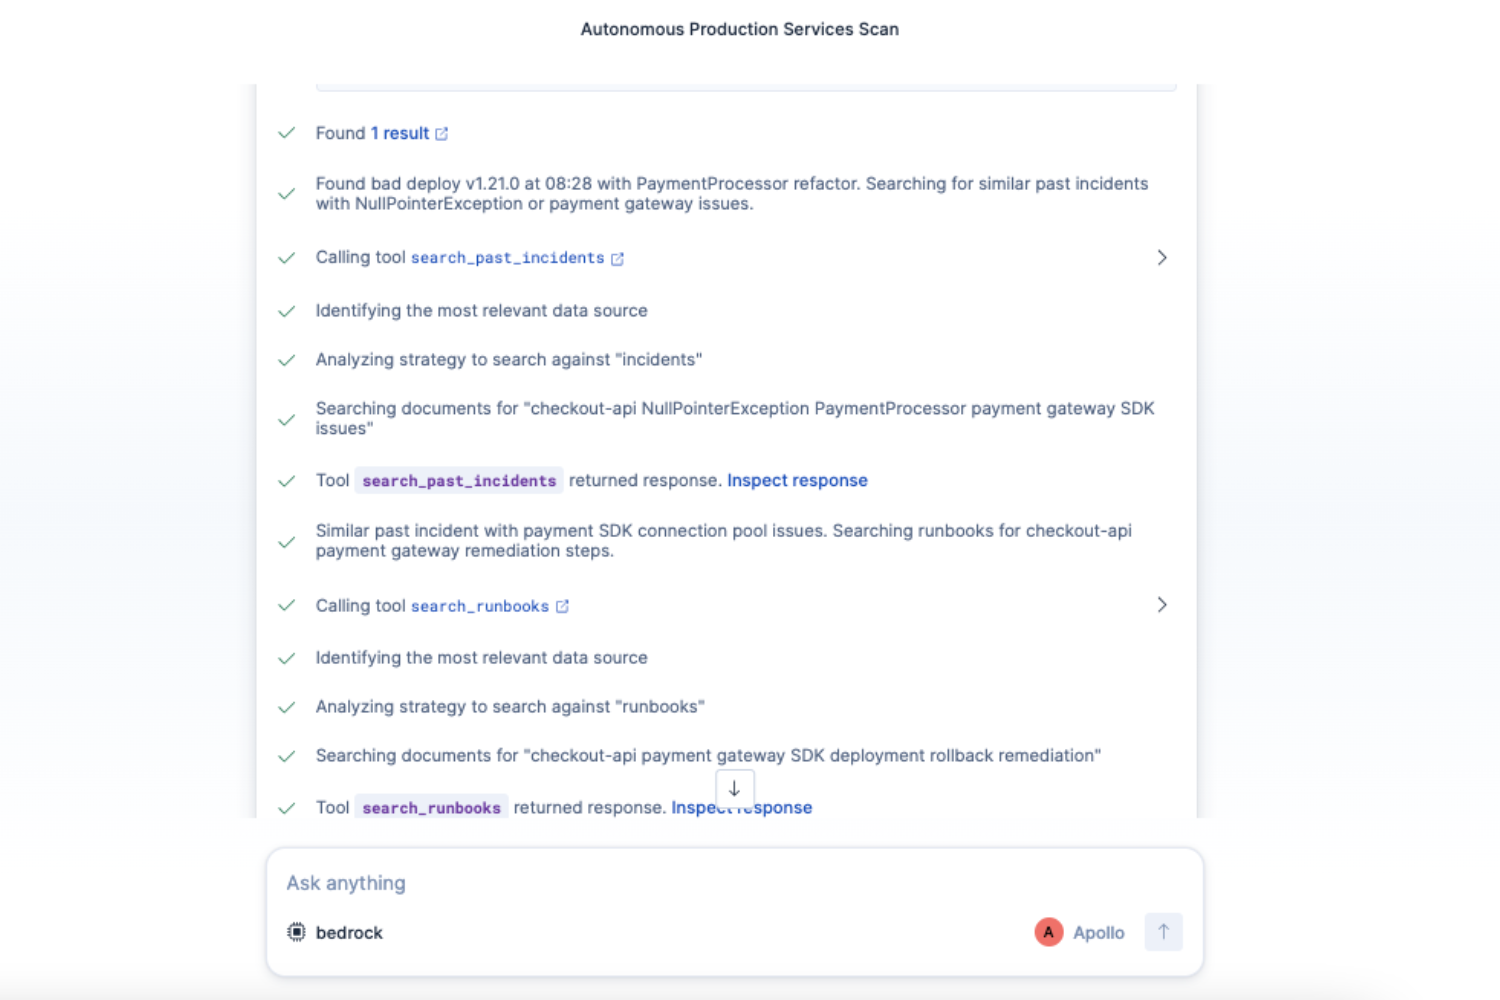
- Detect: Scans application metrics for error rate spikes, latency regressions, and connection pool saturation using ES|QL time-series aggregation
- Analyze: Examines error logs to identify specific failure patterns (NullPointerException, connection timeouts, circuit breaker trips)
- Correlate: Searches deployment history and correlates anomaly timing with recent deploys - identified a payment SDK v3 migration that changed 847 lines across 12 files
- Pattern Match: Searches historical incidents and finds a nearly identical past incident with the same root cause
- Consult: Retrieves the relevant operational runbook with step-by-step remediation
- Validate: Uses parameterized ES|QL queries to verify findings against real data. Apollo pushes back on incorrect human assumptions, when told "the error rate is dropping," it checked the data and responded "I cannot do that, the error rate is not dropping"
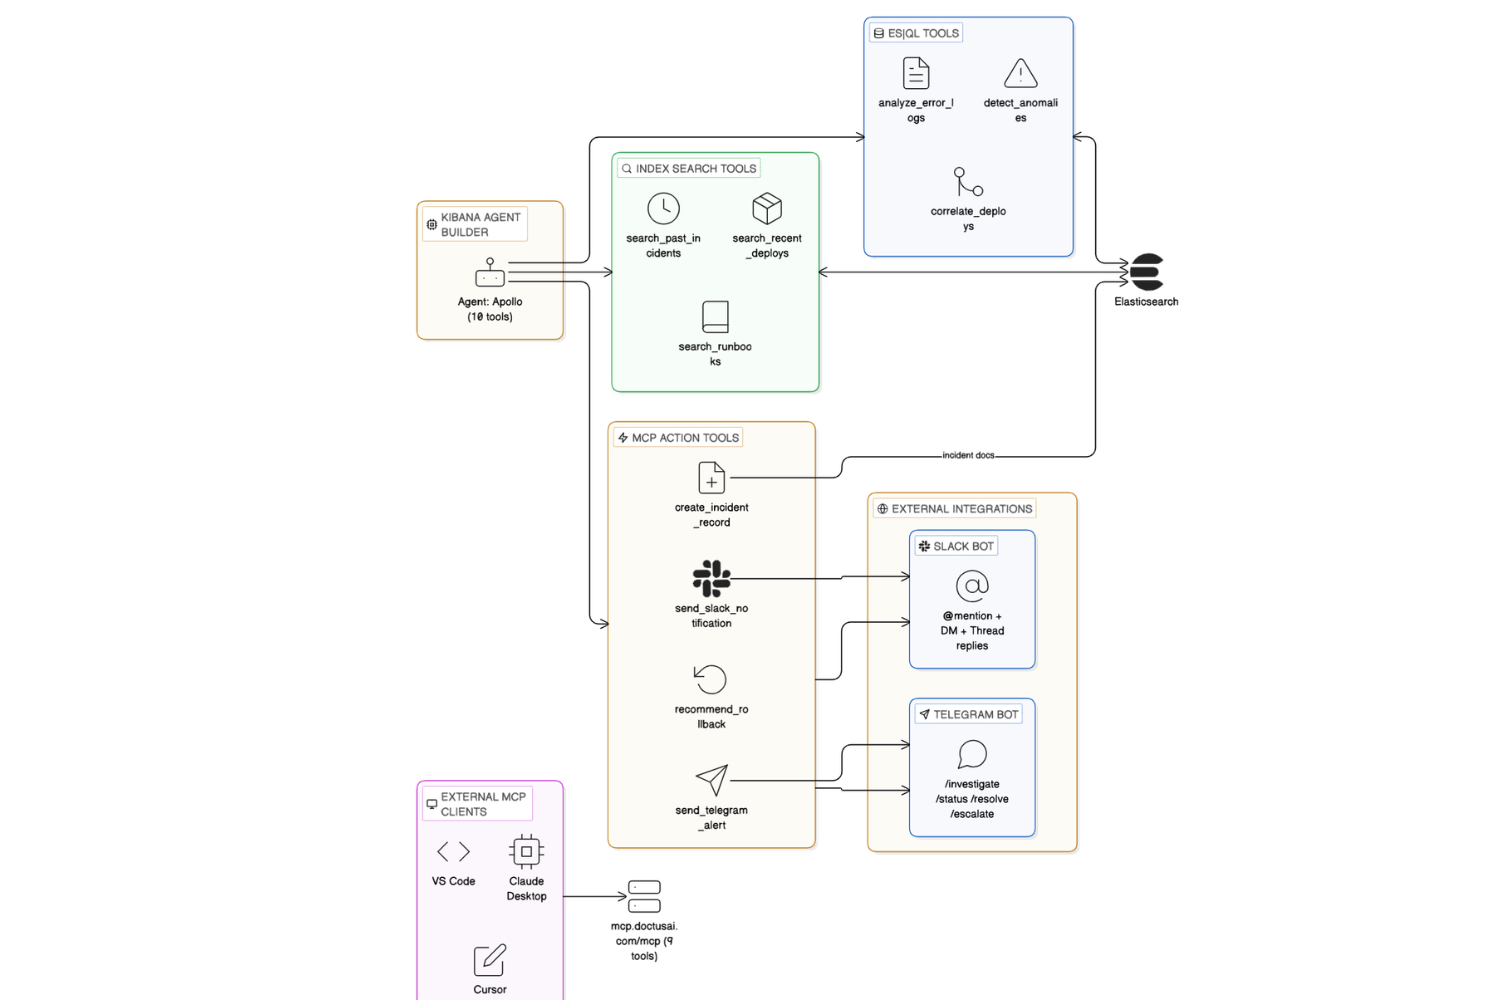
Autonomous Actions (10 tools via MCP) - Apollo closes the loop:
- Creates incident record in Elasticsearch with a clickable Kibana Discover link
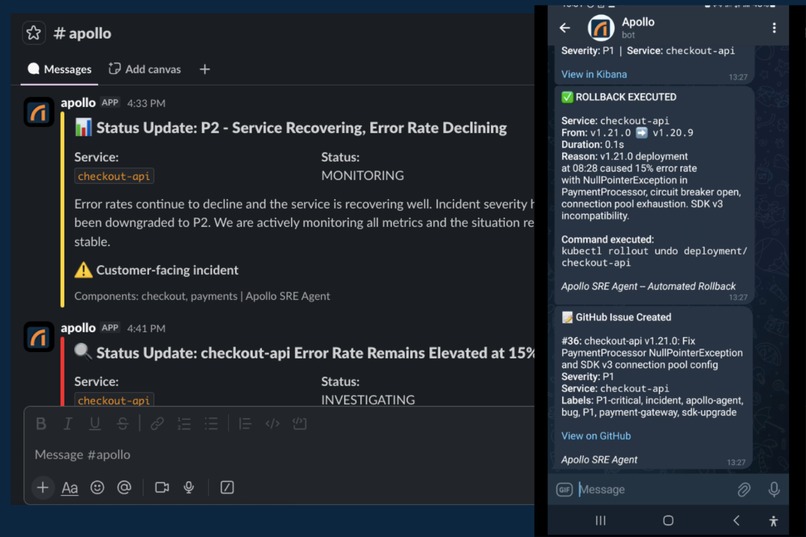
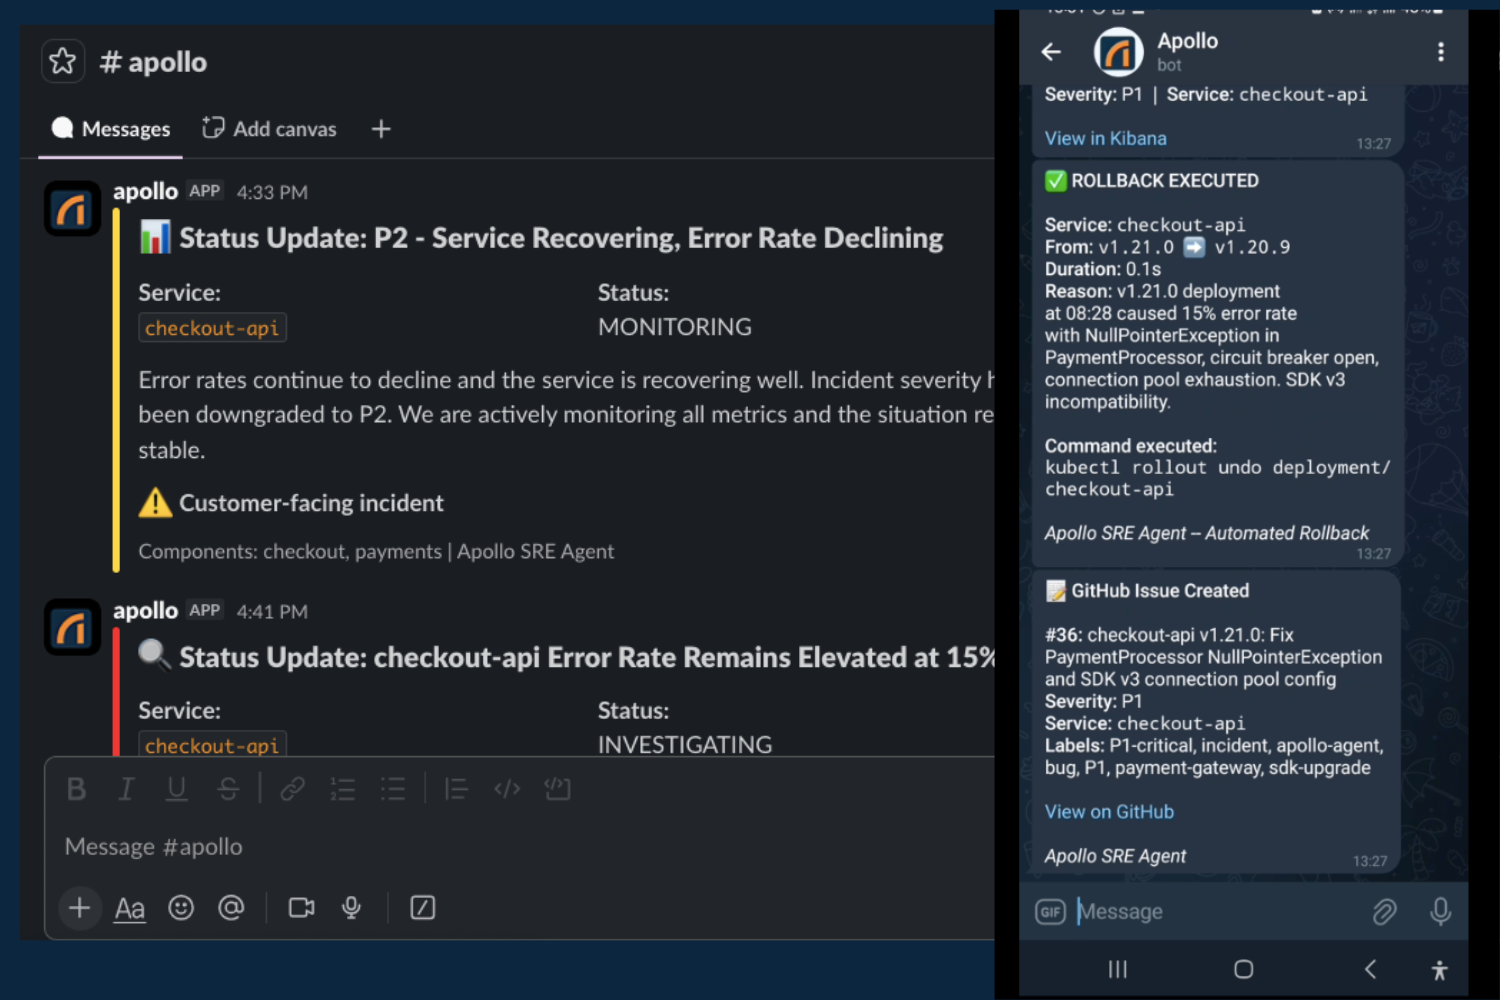
- Sends Telegram alert to the on-call team with severity, root cause, and remediation steps
- Sends Slack notification to #apollo with rich formatting and a "View in Kibana" button
- Executes rollback via the CI/CD pipeline - records the deployment in Elasticsearch, notifies all channels with before/after versions
- Runs post-fix health check - queries real-time error rates post-rollback and compares to baseline to verify the fix worked
- Creates Jira ticket(simulated) with auto-filled root cause, severity-based priority, remediation steps, and assignee
- Creates PagerDuty incident(simulated) - pages the on-call engineer with severity, escalation policy, and recommended actions
- Generates postmortem - creates a structured postmortem document (timeline, root cause, impact, remediation, preventive measures, lessons learned) and indexes it in Elasticsearch
- Updates status page - keeps stakeholders and customers informed with real-time incident status updates
- Recommends rollback with specific versions and the exact kubectl command (when full execution isn't needed)
Multi-Channel Interface - Apollo lives where engineers already work:
- Kibana Agent Builder - Full investigation UI with tool call visibility
- Telegram Bot (@Apolloelasticbot) - Two-way chat with persistent conversation threads, command shortcuts (/investigate, /status, /resolve, /escalate)
- Slack Bot - @mention Apollo in any channel or DM. Responds in threads with formatted output
- MCP Protocol - Connect from VS Code, Claude Desktop, Cursor, or any MCP client via mcp.doctusai.com. 15 tools available for read and write operations
- Autonomous Scheduled Scans - Runs every 3 hours automatically. Only alerts if issues found
In our live demo, Apollo diagnosed a production incident (checkout-api failure caused by a payment SDK migration exhausting the database connection pool) in 92 seconds, created an incident record with a Kibana link, sent alerts to both Telegram and Slack, and recommended a rollback to v1.20.9 - all without human intervention.
How we built it
Agent Builder Configuration
- 22 tools across 3 types: ES|QL (3), Index Search (3), MCP (10 action + 5 read via the same connector)
- System prompt: 6-step SRE investigation protocol with rules like "cite specific numbers from query results" and "NEVER end an investigation without taking at least one action"
- LLM: Amazon Bedrock (Claude Sonnet) via Kibana connector
ES|QL Tools (3)
detect_anomalies- BUCKET + STATS aggregation over 5-minute windows. Detects error rate spikes, latency regressions, and throughput dropsanalyze_error_logs- Groups error patterns by service, message, and status code with COUNT and AVG aggregationscorrelate_anomaly_with_deploys- Service-specific metric correlation with deployment timing windows
Index Search Tools (3)
search_recent_deploys- Natural language search across deployment historysearch_past_incidents- Semantic matching against historical incident reportssearch_runbooks- Retrieval of step-by-step remediation procedures
MCP Action Server (15 tools)
Custom Node.js/Express MCP server deployed at mcp.doctusai.com with nginx + Let's Encrypt SSL:
- Action tools (10):
send_telegram_alert,send_slack_notification,create_incident_record,recommend_rollback,execute_rollback,run_health_check,create_jira_ticket,create_pagerduty_incident,generate_postmortem,update_status_page - Read tools (5):
get_service_health,get_recent_incidents,get_recent_deployments,search_error_logs,ask_apollo
Elastic Workflow
- Multi-step workflow: creates incident document in Elasticsearch index, then sends Slack webhook notification with Block Kit formatting
Two-Way Chat Bots
- Telegram: Polling-based bot with persistent conversation threads per chat. Commands: /investigate, /status, /resolve, /escalate, /newthread. Markdown-to-HTML converter for Telegram's parser
- Slack: @slack/bolt v4.6 in Socket Mode. Handles @mentions (responds in-thread) and DMs. Auto-splits long responses
Data Layer
- 5 Elasticsearch indices: app-logs, app-metrics, deployments, incidents, runbooks
- 9,470+ documents of realistic synthetic observability data
- Seed script generates 24-hour healthy baseline + incident scenario with realistic error patterns
Features we used
- Elastic Agent Builder (agent configuration, system prompts, tool assignment)
- ES|QL Tools (parameterized queries with typed parameters)
- Index Search Tools (semantic + keyword search)
- Elastic Workflows (multi-step: index document + webhook notification)
- Kibana Converse API (/api/agent_builder/converse)
- Kibana Tools API (programmatic tool creation)
- MCP Connector (connect Agent Builder to external MCP server)
- Elasticsearch Serverless (data storage and querying)
Challenges we ran into
- ES|QL BUCKET column aliasing:
BUCKET(@timestamp, 5 minutes)renames the output column, breaking subsequent SORT/WHERE. Solved with explicit alias syntax - ES|QL parameter type constraints: Parameters require Elasticsearch types (
keyword,integer). Duration strings can't be parameterized - we hardcoded time windows while keeping service names dynamic - MCP connector caching: Kibana caches tool lists from MCP connectors. Adding new tools required deleting and recreating the connector to force re-discovery
- Telegram HTML parsing: Apollo's markdown output (headers, bold, code blocks) is rejected by Telegram's HTML parser. Built a full
mdToTelegramHtml()converter with graceful fallback to plain text - Conversation persistence: Each message created a new conversation, losing context. Implemented a
conversationMapper chat that storesconversation_idfor multi-turn conversations
Accomplishments we're proud of
- Apollo pushes back on incorrect instructions: When told to downgrade severity because "error rate is dropping," it checked the data and said "I cannot do that" - citing the actual numbers. This is autonomous reasoning, not just prompt completion
- Full closed-loop incident response: Detect -> Diagnose -> Fix -> Verify -> Document -> Notify. Apollo doesn't just find problems - it executes rollbacks, verifies the fix, creates Jira tickets, pages PagerDuty, generates postmortems, and updates the status page
- 92-second full investigation including detection, diagnosis, correlation, historical matching, and autonomous remediation actions
- 15 MCP tools (10 action + 5 read) - Apollo integrates with Elasticsearch, Slack, Telegram, Jira, PagerDuty, and status pages through a single MCP server
- 5 channels: Kibana + Slack + Telegram + MCP + Autonomous scans - Apollo lives where engineers already work
- True two-way chat with persistent conversation threads - not just notifications, but interactive investigation
Measurable Impact
Apollo replaces 8-12 manual steps per incident that currently require a human SRE:
| Manual Step | Time (Human) | Time (Apollo) | Annual Savings (at 15 incidents/month) |
|---|---|---|---|
| Wake up, open laptop, VPN in | 5-10 min | 0 (always on) | 15-25 hrs/yr |
| Check dashboards and logs | 10-20 min | 15 sec (ES\ | QL) |
| Cross-reference deployments | 5-10 min | 8 sec (Index Search) | 15-25 hrs/yr |
| Search past incidents | 5-10 min | 5 sec (Index Search) | 15-25 hrs/yr |
| Find runbook | 3-5 min | 3 sec (Index Search) | 8-12 hrs/yr |
| Execute rollback | 5-15 min | 12 sec (MCP) | 15-37 hrs/yr |
| Verify fix (health check) | 5-10 min | 10 sec (ES\ | QL) |
| Create Jira ticket | 5-10 min | 3 sec (MCP) | 15-25 hrs/yr |
| Page on-call / PagerDuty | 2-5 min | 2 sec (MCP) | 5-12 hrs/yr |
| Update status page | 3-5 min | 2 sec (MCP) | 8-12 hrs/yr |
| Notify team on Slack | 2-3 min | 1 sec (MCP) | 5-8 hrs/yr |
| Write postmortem | 30-60 min | 5 sec (MCP) | 75-150 hrs/yr |
| Total | 80-163 min | ~92 sec | ~216-406 hrs/yr |
For a team handling 15 incidents/month:
- Time saved: 216-406 engineering hours per year
- Cost saved: $43,000-$81,000/yr (at $200/hr fully-loaded SRE cost)
- MTTR reduction: From 80-163 minutes to under 2 minutes (98% reduction)
- After-hours callouts eliminated: Apollo handles the full cycle autonomously, reducing 3 AM wake-ups from 15/month to near zero for known patterns
- Postmortem backlog eliminated: Every incident gets an auto-generated postmortem immediately - no more "we'll write it later" (which means never)
What we learned
- ES|QL's
STATS ... BY BUCKET(@timestamp, 5 minutes)is powerful for time-series anomaly detection at scale - Good system prompts matter more than tool quantity. Our 6-step protocol with "cite specific numbers" and "NEVER end without taking action" made Apollo consistently autonomous
- The Index Search tool is surprisingly capable - given a natural language query, it generates its own ES|QL internally
- MCP is the glue that connects everything - one protocol, any client, read and write operations
- Agent-to-agent collaboration through shared protocols (MCP + GitHub Issues) is more powerful than monolithic multi-agent systems
Agent-to-Agent Collaboration (the full loop)
This is what makes Apollo different from every other incident response tool:
Production breaks
→ Apollo detects anomaly via ES|QL (Elastic Agent Builder)
→ Apollo diagnoses root cause (correlates deploy, searches history)
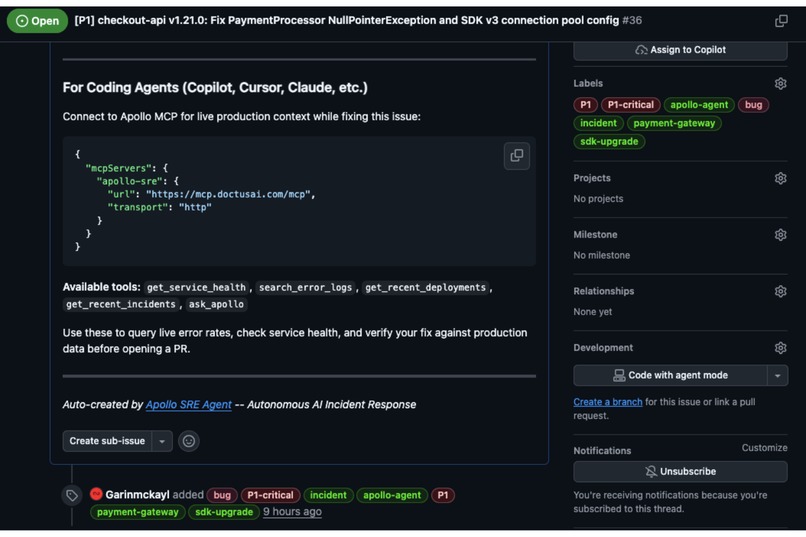
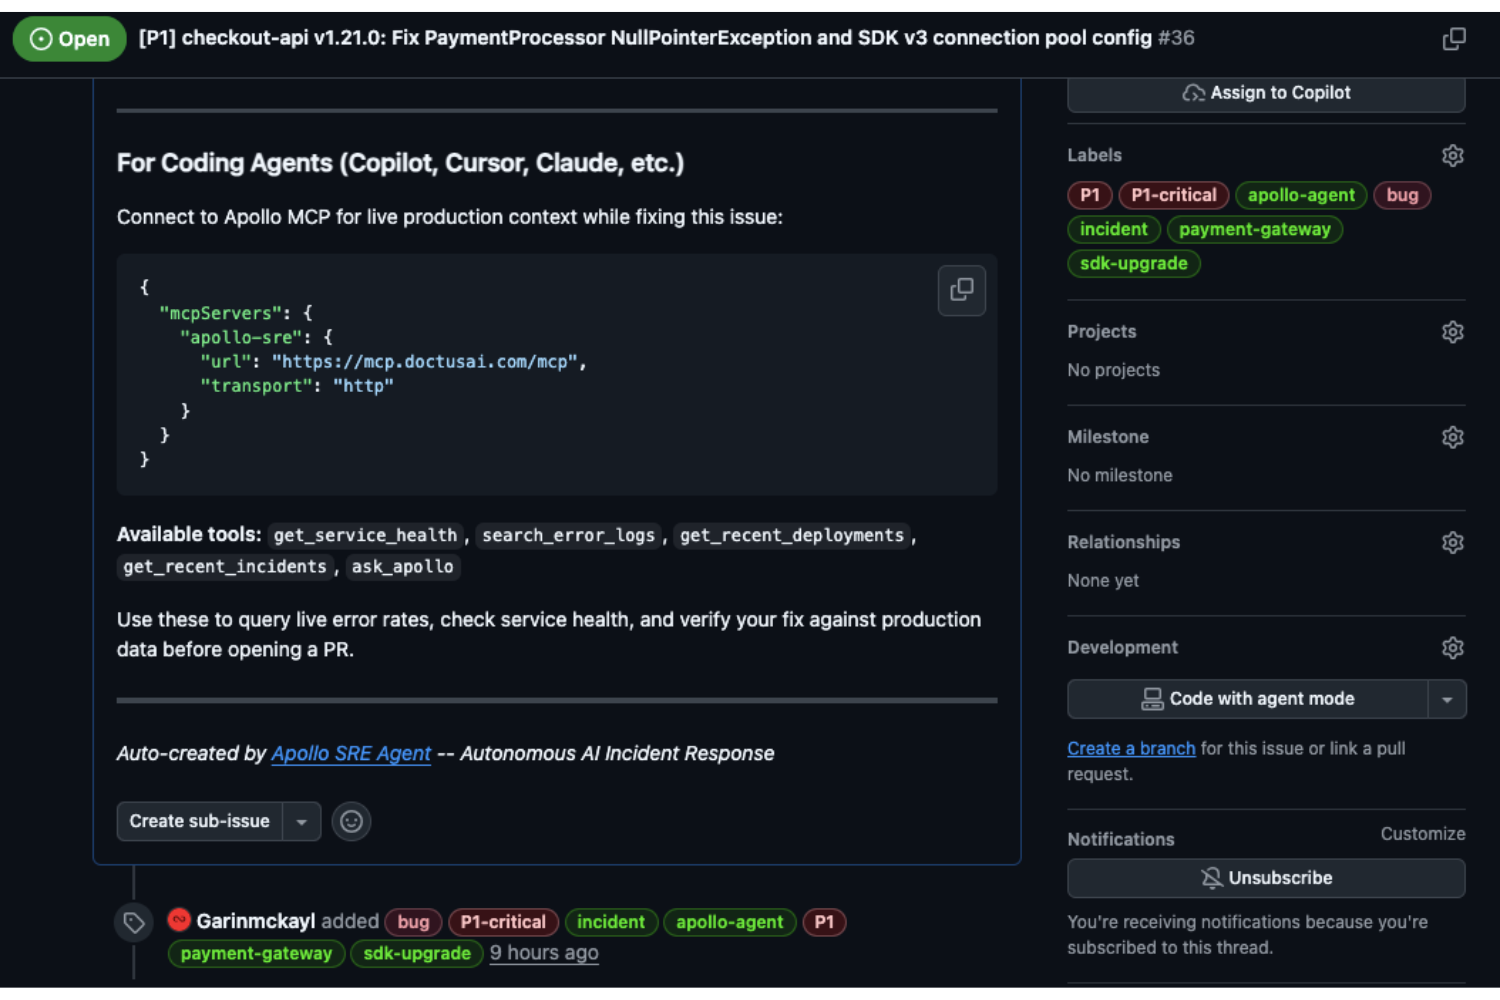
→ Apollo creates REAL GitHub issue with root cause + fix instructions
→ Apollo embeds MCP connection config in the GitHub issue
→ Coding agent (Copilot/Cursor/Claude) picks up the issue
→ Coding agent connects to Apollo MCP server for live production context
→ Coding agent calls get_service_health, search_error_logs to understand the failure
→ Coding agent writes the fix, opens a PR
→ Apollo verifies via run_health_check after deployment
Two completely different AI agents - one for SRE (Apollo in Elastic), one for code (Copilot/Cursor/Claude) - collaborating through:
- GitHub Issues as the handoff artifact (real, clickable, with full context)
- MCP protocol as the communication channel (live production data access)
The GitHub issue body includes the MCP server URL and available tools, so any coding agent that opens the issue knows exactly how to connect to Apollo for real-time production context while writing the fix.
Config files included in the repo:
.vscode/mcp.json- VS Code / GitHub Copilot.cursor/mcp.json- Cursorclaude_desktop_config.json- Claude Desktop
What's next
- Real APM data integration - Connect to live Elastic APM instead of synthetic data
- Alert rule triggers - Apollo activates automatically when Elastic alert rules fire, not just on scheduled scans
- Automated PR verification - Apollo watches for PRs that reference incident issues and auto-runs health checks post-deploy
- Learning loop - Apollo indexes its own investigations, so future diagnoses improve over time
- A2A protocol - Use Elastic's new Agent-to-Agent server for direct agent communication
Built With
elasticsearch, esql, elastic-agent-builder, elastic-workflows, kibana-api, mcp, amazon-bedrock, claude, node.js, express, telegram-bot-api, slack-bolt, github-api, jira-api, pagerduty-api, nginx, letsencrypt
Try it out
- GitHub: https://github.com/Garinmckayl/apollo
- Demo Video: https://youtu.be/fACwGxRrrPg?si=GF4-2Yz7tdPUpSjR
- MCP Server: https://mcp.doctusai.com/health
- Connect your coding agent: Add
{"mcpServers":{"apollo-sre":{"url":"https://mcp.doctusai.com/mcp","transport":"http"}}}to your MCP config
Built With
- amazon-bedrock
- claude
- elastic-agent-builder
- elastic-workflows
- elasticsearch
- esql
- jira
- kibana-api
- nginx
- node.js
- slack

Log in or sign up for Devpost to join the conversation.