Inspiration
The idea for this project came from the struggles I faced while debugging APIs. Often, tracking requests, responses, and errors felt tedious and confusing, especially when multiple endpoints and payloads were involved. I wanted to create a tool that would visualize API activity clearly, making debugging faster and more intuitive for developers. This inspired me to build an interactive visualizer that shows API requests, responses, and errors in real time, so developers can see the flow of data instead of hunting through logs.
What it does
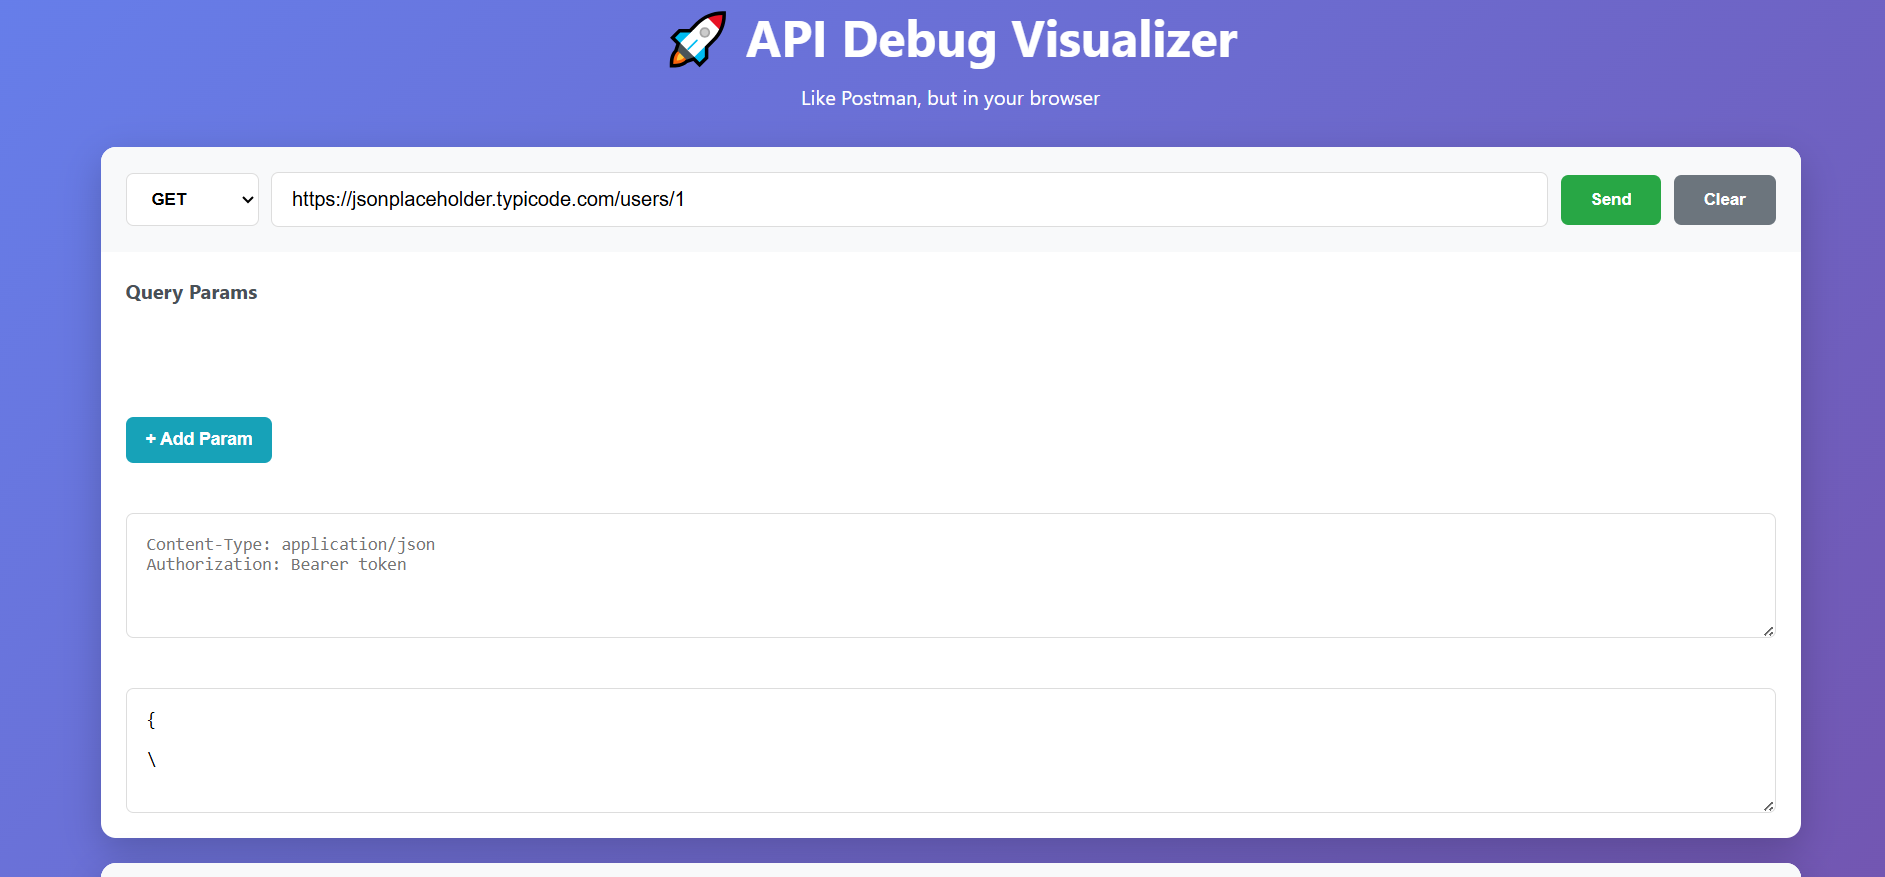
The API Debug Visualizer captures and displays API requests and responses in real time. It shows:
Request payloads and endpoints Response data and status codes Response times and error rates
This makes debugging APIs faster and easier by visualizing the flow of data, instead of scrolling through raw logs.
How we built it
I approached this project in structured steps:
Planning I outlined the main modules: Interceptor: Captures all API calls and errors. Visualizer: Displays requests and responses in an interactive UI. Logger: Aggregates data for analysis, like response time and status codes. Development Frontend: Developed a UI that visualizes API flows and errors. Each API call is displayed with its payload, response, and status.
Testing & Deployment Tested with multiple APIs to ensure accurate logging. Fixed issues with nested JSON parsing and real-time UI updates. Deployed using [platform, e.g., Vercel].
Challenges we ran into
Handling asynchronous API data and keeping the UI updated in real time. Parsing deeply nested JSON responses for clear visualization. Optimizing performance for large volumes of API requests.
Accomplishments that we're proud of
Built a real-time visualizer that clearly shows API requests, responses, and errors. Successfully handled complex, nested JSON and asynchronous data streams. Optimized performance to manage large volumes of API traffic without lag. Created a tool that significantly speeds up debugging for developers.
What we learned
How to capture and process API requests and responses in real time. Techniques for visualizing complex, nested JSON data clearly. Managing asynchronous data streams and keeping the UI responsive. Optimizing performance for high-volume API traffic. Problem-solving and debugging strategies for building developer tools.
What's next for API DEBUG VISUALIZER
Add filtering and search by endpoint, status code, or error type. Implement performance trend charts to track API response times over time. Introduce automated error detection and alerts for failed requests. Make it collaborative, so teams can share and review API flows in real time.

Log in or sign up for Devpost to join the conversation.