


Inspiration
Sports analytics has a visibility problem. The tools that actually matter — the ones that prevent injuries, grade decisions on logic instead of luck, and test whether momentum is real or myth — exist only inside the walls of professional franchises with eight-figure analytics budgets.
We watched athletic trainers manage player workloads on spreadsheets. We watched coaches get criticized for decisions that were statistically correct but unlucky. We watched commentators say "they've got all the momentum" without anyone ever asking whether that statement is actually true.
That gap is what built Apex.
The specific moment that locked it in was reading about a star player who got injured mid-season after a stretch of unusually high minutes. Every analyst called it bad luck. But the workload data was sitting there the whole time. Nobody was looking at it the right way — comparing the player to themselves, not to a league average that means nothing for that individual.
We decided to build the tool that should already exist.
What It Does
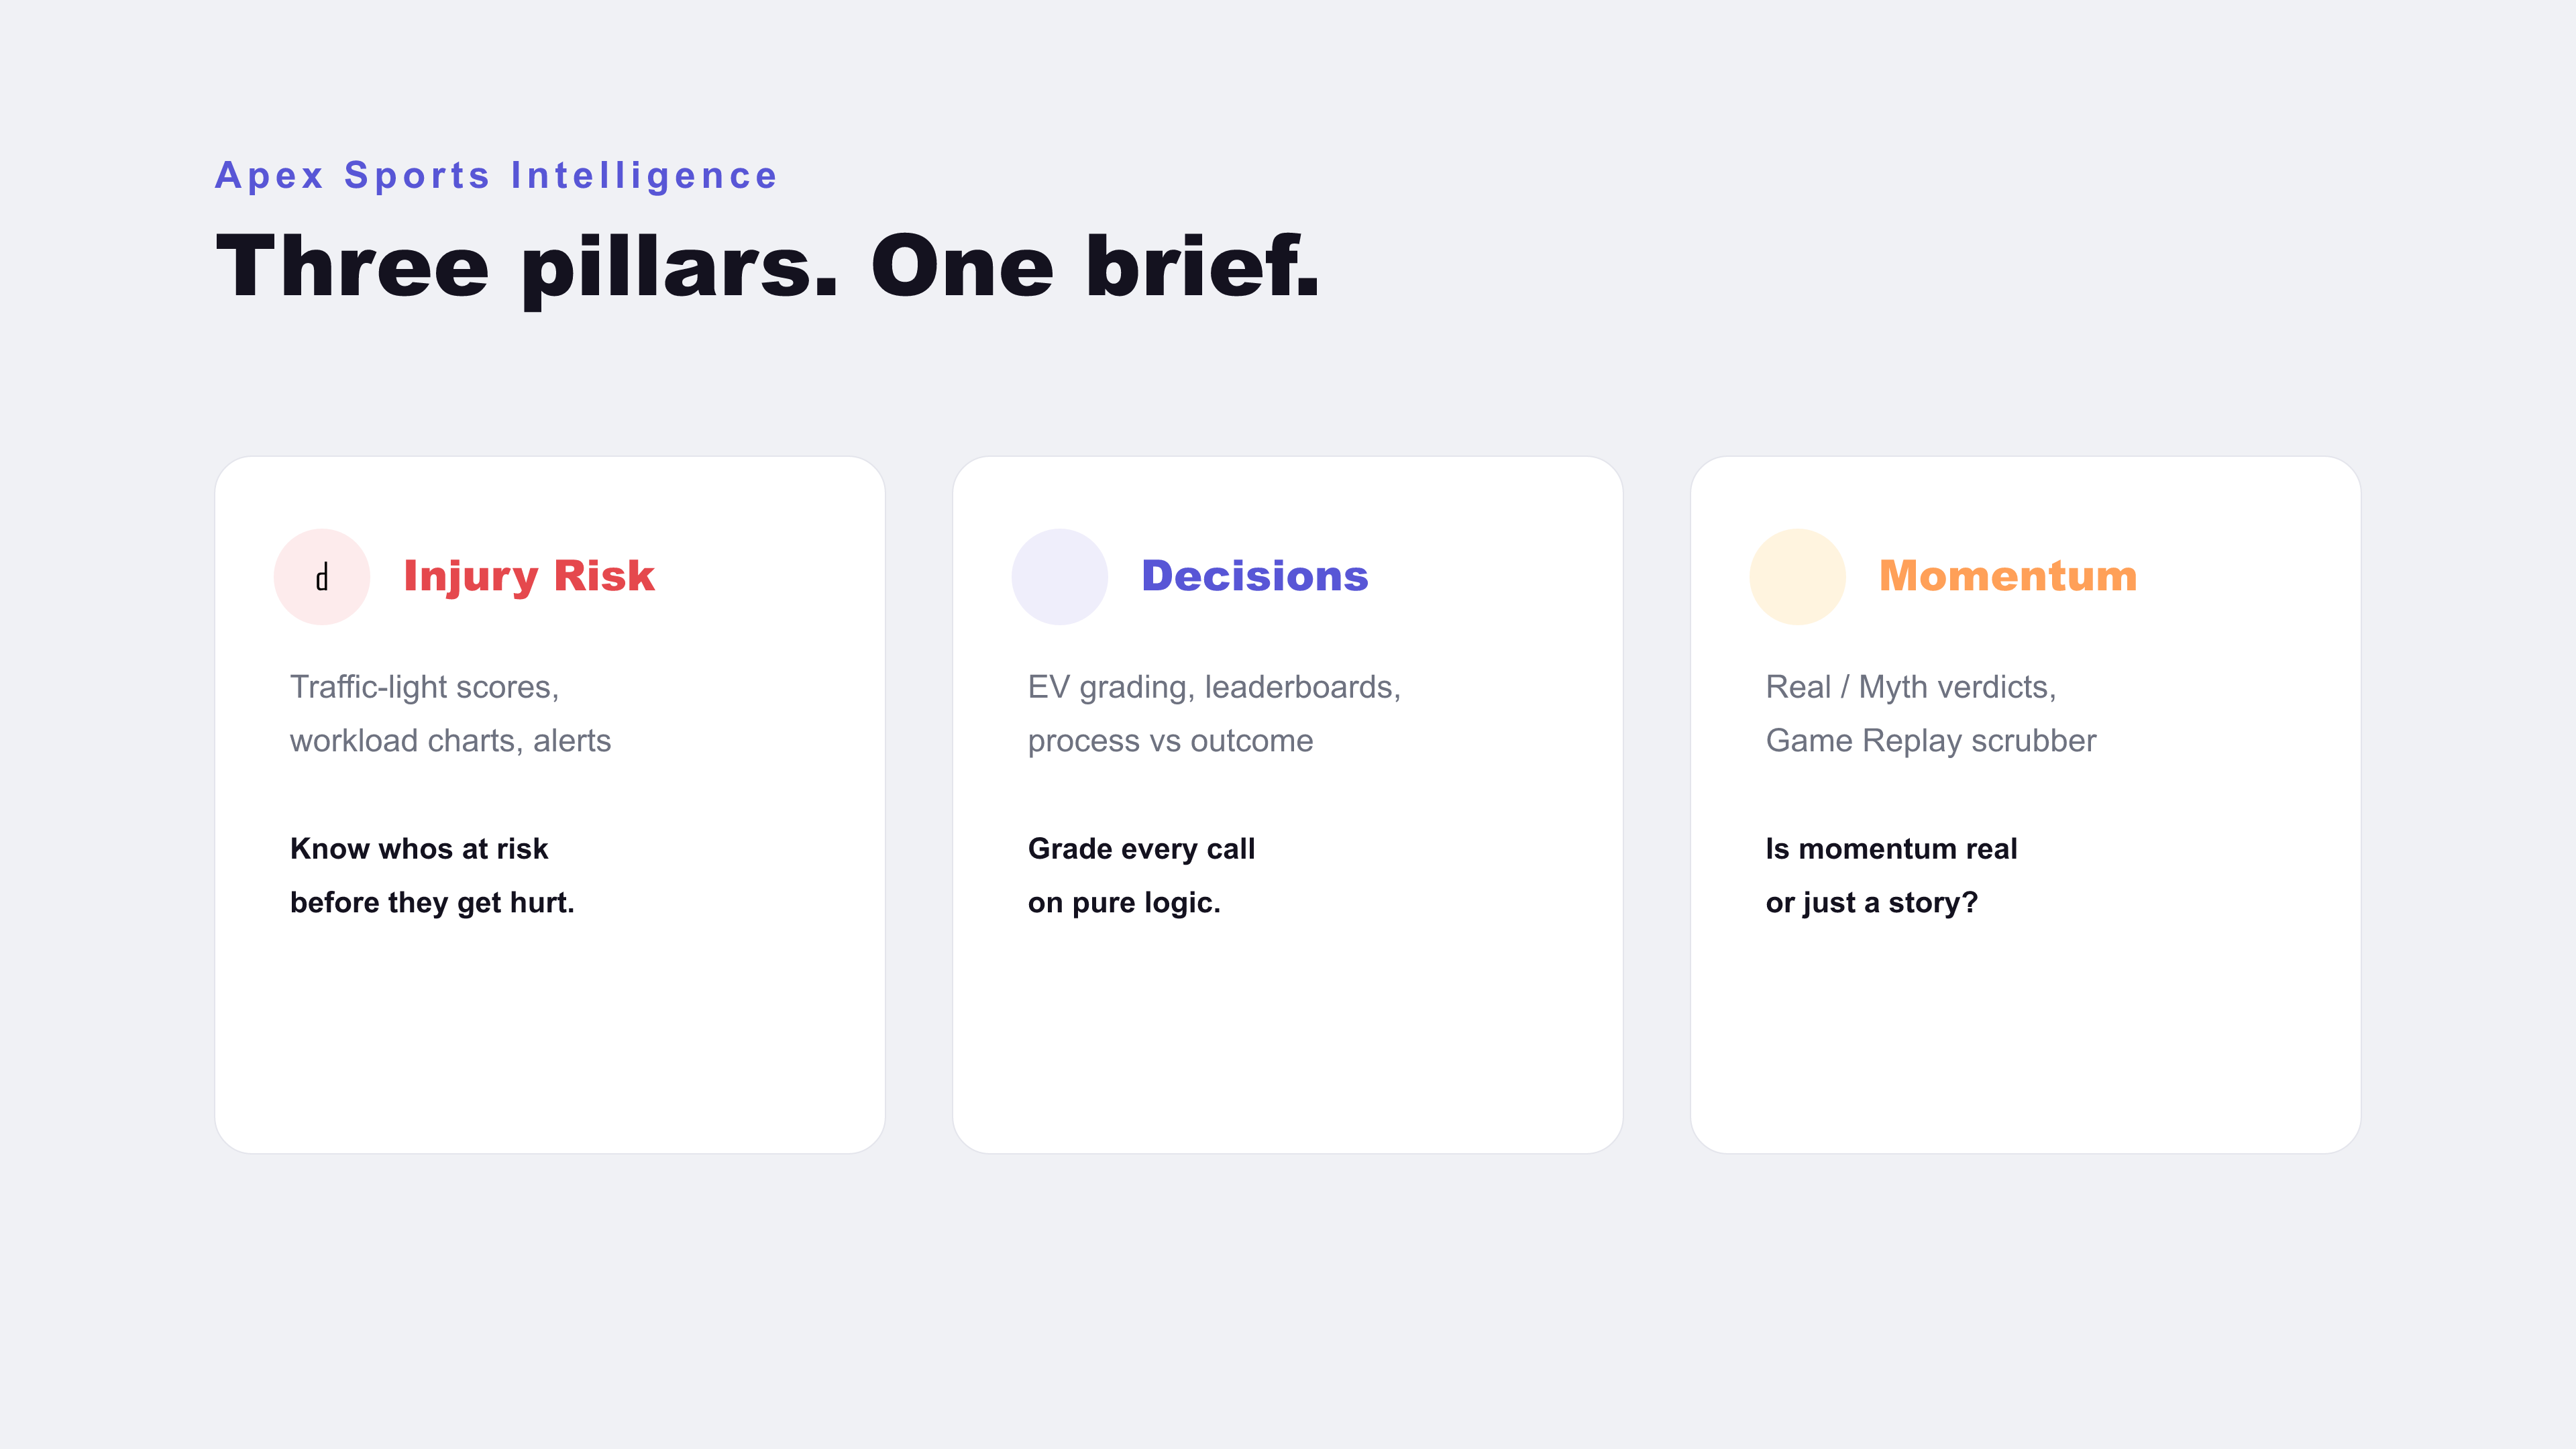
Apex is a universal sports analytics intelligence platform with three distinct engines working together.
Injury Risk Engine Monitors player workload and flags risk by comparing each player to their own personal baseline — not the league average. A player who normally plays 28 minutes suddenly playing 38 minutes is flagged even if 38 is below average for other players. The system computes a personalized 21-day baseline per player, runs z-score deviation analysis on the most recent 7-day window, and outputs a 0–100 risk score with a plain English explanation and a traffic light alert system for entire team rosters.
Decision Quality Index Grades coaching decisions on the quality of the process, not the outcome. A coach who goes for it on 4th-and-1 from the opponent's 30 with a 3-point lead made a correct expected value decision — even if the offense fumbles. Apex computes the win probability at every decision moment using a logistic regression model trained on historical game data, calculates the EV of every available option, and produces a ranked coach leaderboard showing who actually makes the best decisions and who just gets lucky.
Momentum Analyzer Tests the thing every commentator says but nobody proves. Using a Cox proportional hazard model on play-by-play data, Apex measures whether consecutive scoring runs statistically change the probability of the opponent scoring next. The results differ by sport. Hockey shows a significant effect. Baseball shows almost none. The platform surfaces this with confidence intervals, p-values explained in plain English, and a Timeout Optimizer that tells coaches exactly when interrupting momentum is worth the timeout.
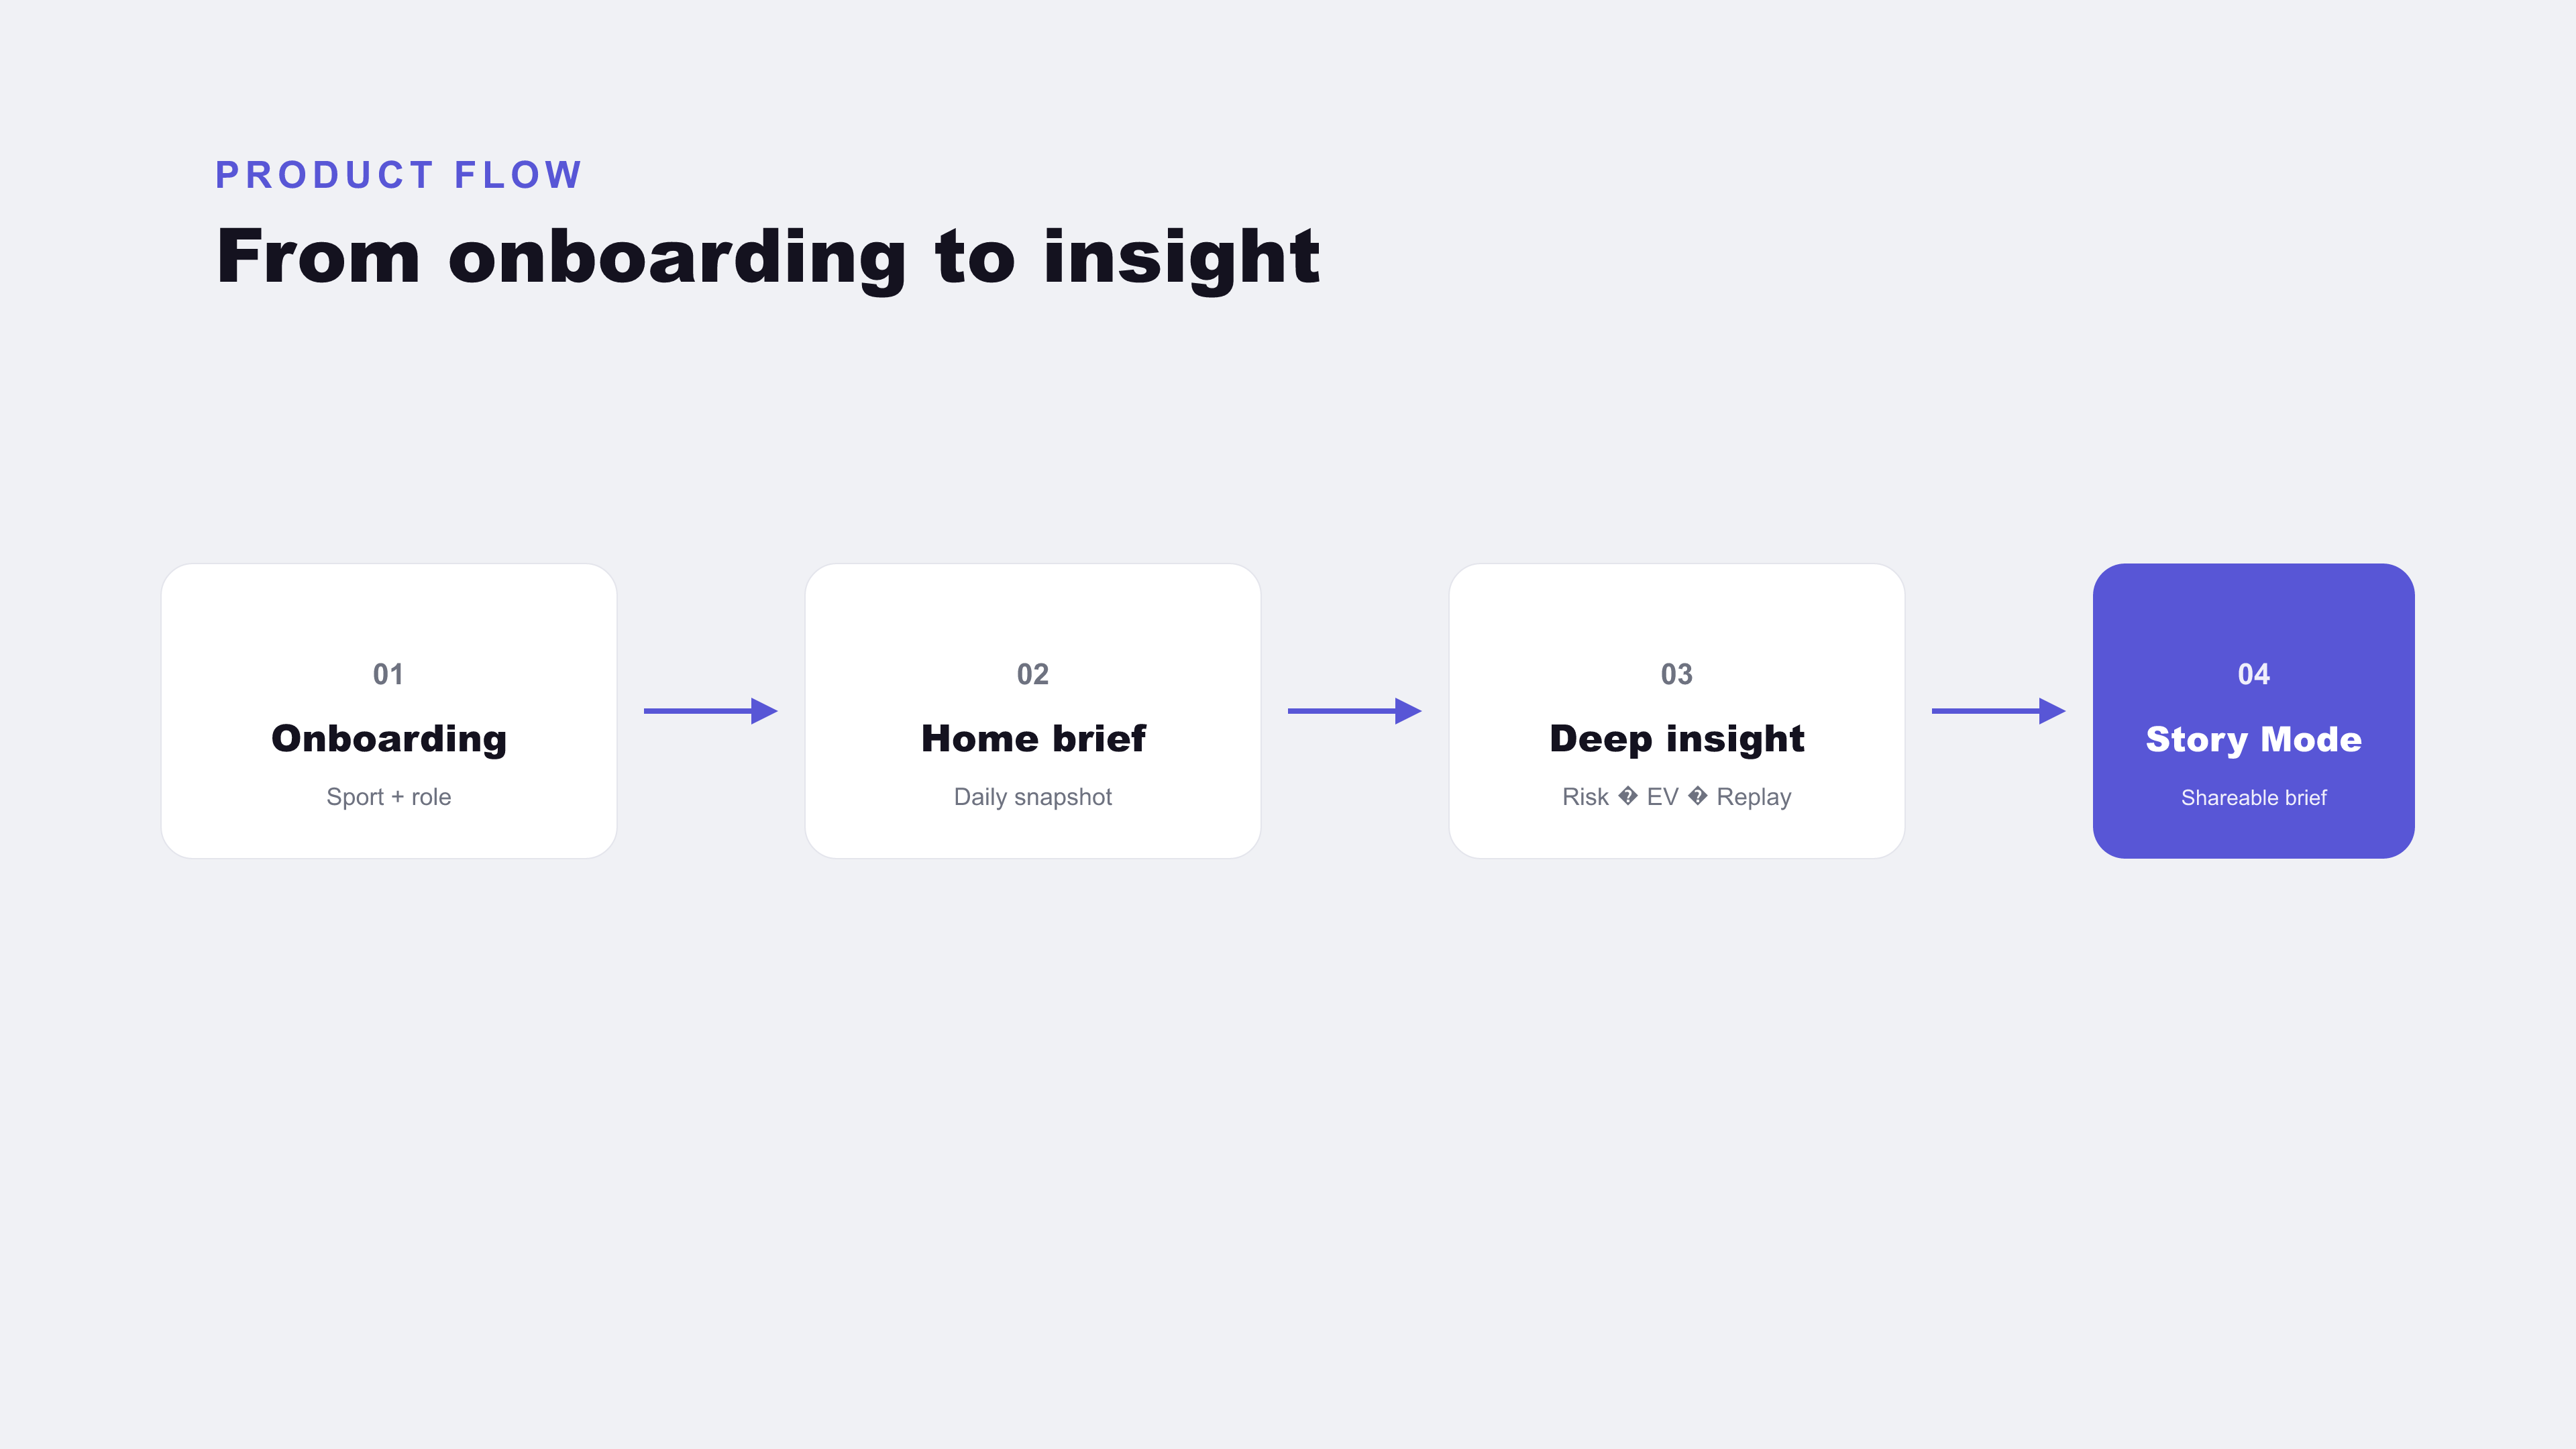
Unified Platform All three engines run inside one mobile application with role-based views for athletic trainers, coaches, front office analysts, and fans — and a Story Mode that generates plain English summaries of any screen in the app.
How We Built It
| Layer | Technology | Purpose |
|---|---|---|
| Mobile App | React Native | Cross-platform iOS and Android |
| Backend API | Node.js with Express | All routing, caching, data management |
| ML Service | Python with FastAPI | Statistical models and AI computation |
| Database | SQLite with Prisma ORM | Persistent storage for all computed data |
| Injury Model | Scikit-learn, NumPy, SciPy | Z-score deviation and risk scoring |
| Momentum Model | Lifelines (Cox PHFitter) | Proportional hazard survival analysis |
| Decision Model | Scikit-learn Logistic Regression | Win probability and EV calculation |
| Story Mode | Template engine with optional OpenAI | Plain English narrative generation |
| NBA Data | BallDontLie API | Player game logs and box scores |
| NFL Data | nfl-data-py via Python bridge | Play-by-play and coaching decisions |
| MLB Data | Official MLB Stats API | Game logs and play-by-play |
| Caching | Node-cache and SQLite | Two-layer cache for sub-10ms responses |
| Background Jobs | node-cron | Automated data sync every 6 hours |
The build followed nine structured phases. Database schema first — 15 tables covering players, game logs, coaching decisions, momentum timelines, risk scores, and cache metadata. Data fetching layer second — sport-specific connectors that normalize raw API responses into a consistent schema before storage. The Python microservice third — each model built and tested independently before integration. API routes fourth — layered architecture with routes, controllers, services, and ML clients cleanly separated. Background jobs fifth — automated sync and recomputation running on schedule so the platform maintains itself. Caching sixth — a two-layer system combining in-memory and SQLite persistence that makes repeated requests return in under 10 milliseconds.
Challenges We Ran Into
Personalized baselines at scale Computing a personal workload baseline per player sounds simple. Doing it for 450 NBA players, 1,700 NFL players, and 750 MLB players in reasonable time required careful batching. We process players in groups of 25, send batch requests to the Python ML service, and write results back in transactions. Getting the balance right between speed and not overwhelming the ML service took significant iteration.
The Cox model on sparse data The Cox proportional hazard model needs enough events to produce reliable coefficients. Early in a season there simply are not enough games. We built minimum data thresholds — the model will not run until at least 50 games exist — and return a clear "insufficient data" message rather than a statistically meaningless result. This was a discipline decision as much as a technical one.
NaN values breaking the JSON pipeline Python's pandas library uses NaN for missing values. NaN is not valid JSON. When NFL play-by-play data flowed from the Python bridge back to Node, NaN values silently corrupted the responses. We had to build an explicit sanitization step in the NFL data bridge that converts every NaN to null before serialization. Simple problem, surprisingly painful to diagnose.
Caching complexity across two layers Two-layer caching with different TTLs, stale-while-revalidate behavior, and cross-layer invalidation created subtle bugs. A risk score could be fresh in memory but marked stale in SQLite, or vice versa. The cache invalidation system went through three rewrites before the behavior was fully predictable. The key insight was that CacheMetadata tracks freshness but never stores data — actual data always lives in proper typed tables.
Making statistics accessible A p-value of 0.21 means nothing to a coach. The technical outputs of the Cox model, the EV calculations, the z-scores — none of it is useful without translation. Building the Story Mode and plain English explanation system to accurately represent complex statistics without distorting them required more thought than the models themselves.
Accomplishments That We're Proud Of
The personalized baseline approach to injury risk is the one we are most proud of. Every other accessible tool compares players to league averages. Comparing a player to themselves is both statistically correct and practically more useful. A player who normally plays 22 minutes is at risk at 32 minutes even though that is below average for the league. That insight is simple but the implementation required building individual rolling baselines for every active player across four sports.
The process-versus-outcome matrix in the Decision Quality Index surfaces something coaches almost never see clearly stated — that good decisions and good outcomes are not the same thing. Seeing that a coach made the statistically correct call 71% of the time but only saw it work out 58% of the time is exactly the kind of uncomfortable truth that analytics should provide.
The momentum research itself is an accomplishment. The Cox proportional hazard model applied to sports scoring sequences is not a standard approach. Finding that hockey shows statistically significant momentum effects (p < 0.05) while basketball does not challenges conventional commentary wisdom with actual evidence.
Building a system that gracefully degrades — that serves cached data when Python is down, that serves database data when sports APIs are down, that never crashes and never shows a blank screen — is an engineering accomplishment that is invisible when it works but catastrophic when it is missing.
What We Learned
Statistical significance is not the same as practical significance. A momentum effect can be real but too small to act on. We learned to report both the p-value and the effect size, and to build the Timeout Optimizer only for sports where the effect is large enough to be actionable — not just statistically detectable.
Caching is architecture, not an afterthought. We planned the caching layer before writing a single route. Every TTL was decided based on how often the underlying data actually changes. Background jobs were scheduled to run before caches expire so users never see a cache miss. This level of planning is what separates fast applications from slow ones.
The explanation matters as much as the result. A risk score of 68 out of 100 is meaningless without "LeBron has played 27% more minutes than his personal baseline over the last 5 games." The plain English explanation layer — both the template system and Story Mode — is what makes the platform usable by someone who has never heard of a z-score.
Separation of concerns scales. Keeping routes, controllers, services, ML clients, and data fetchers in separate layers felt like overhead at the start. By the time we were debugging a caching issue at 2am it became obvious why every layer has exactly one responsibility. The bug was in the cache service. Nothing else needed to be touched.
What's Next for Apex — Sports Intelligence Manager
Live game mode. The architecture already supports it. The momentum analyzer and win probability model can update on every play during a live game. The next step is connecting to live play-by-play feeds and pushing real-time momentum scores and decision alerts during games as they happen.
Player health integration. Combining workload data with official injury reports, player age curves, and position-specific strain profiles would significantly improve risk score accuracy. The model architecture is designed to accept additional features — adding them is a data access problem more than a modeling problem.
Expanded decision types. The Decision Quality Index currently grades NFL 4th-down calls, timeout usage, and 2-point conversion decisions. Expanding to NBA lineup decisions, MLB pitching changes, and NHL pull-the-goalie scenarios requires new EV models per decision type. The infrastructure to add them is already built.
Team subscriptions. The platform is designed with three real buyers in mind — athletic trainers, coaching staff, and front office analytics teams. The next step is a subscription model where teams get private dashboards with their full roster data, historical decision reports, and exportable PDF briefings for coaching staff meetings.
College sports. The same models apply to NCAA data. College athletic departments have even less access to this level of analytics than professional teams. The data is publicly available. The market is significantly larger.
Data Sources
| Sport | Source | Data Type | Cost |
|---|---|---|---|
| NBA | BallDontLie API | Game logs, box scores, rosters | Free |
| NFL | nfl-data-py library | Play-by-play, decisions, rosters | Free |
| MLB | Official MLB Stats API | Game logs, play-by-play, rosters | Free |
| NHL | ESPN public API | Scores, schedules, rosters | Free |
Models Used
| Model | Library | Applied To | Output |
|---|---|---|---|
| Z-Score Deviation | NumPy, SciPy | Player workload vs personal baseline | Risk score 0–100 |
| Logistic Regression | Scikit-learn | Game state → win probability | Win probability 0–1 |
| Cox Proportional Hazard | Lifelines | Scoring streaks → opponent hazard rate | Hazard coefficient, p-value |
| Decision Tree | Scikit-learn | Game situation → timeout recommendation | Binary recommendation + probability |
| Template NLG | Custom | Analytics data → plain English | Narrative paragraph |

Log in or sign up for Devpost to join the conversation.