Inspiration
Racing is a sport of milliseconds. But when you're 2 seconds off the pace, traditional data tools just show you endless columns of numbers without telling you the story. I wanted to build something different—a platform that doesn't just display telemetry, but teaches you how to drive faster.
The Toyota GR Cup dataset gave me real-world racing data from professional circuits. I saw an opportunity to create a coaching tool that speaks to drivers in their language: visual overlays, animated replays, and plain-English recommendations instead of spreadsheets.
What it does
Apex Replay transforms motorsport telemetry into an interactive coaching experience:
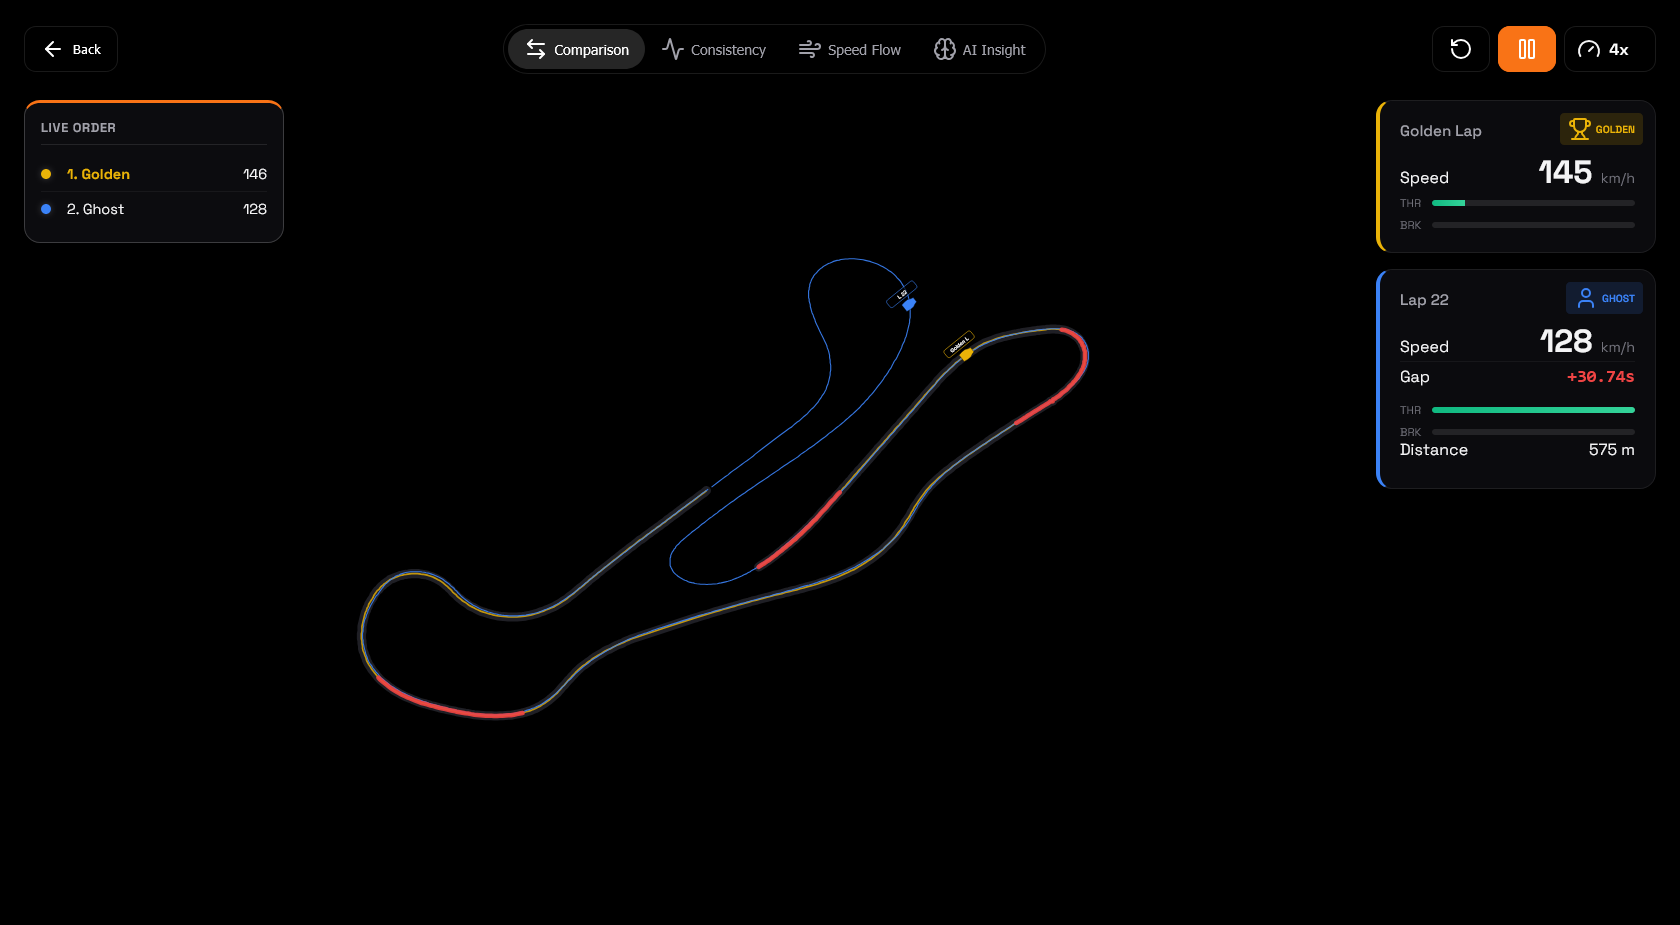
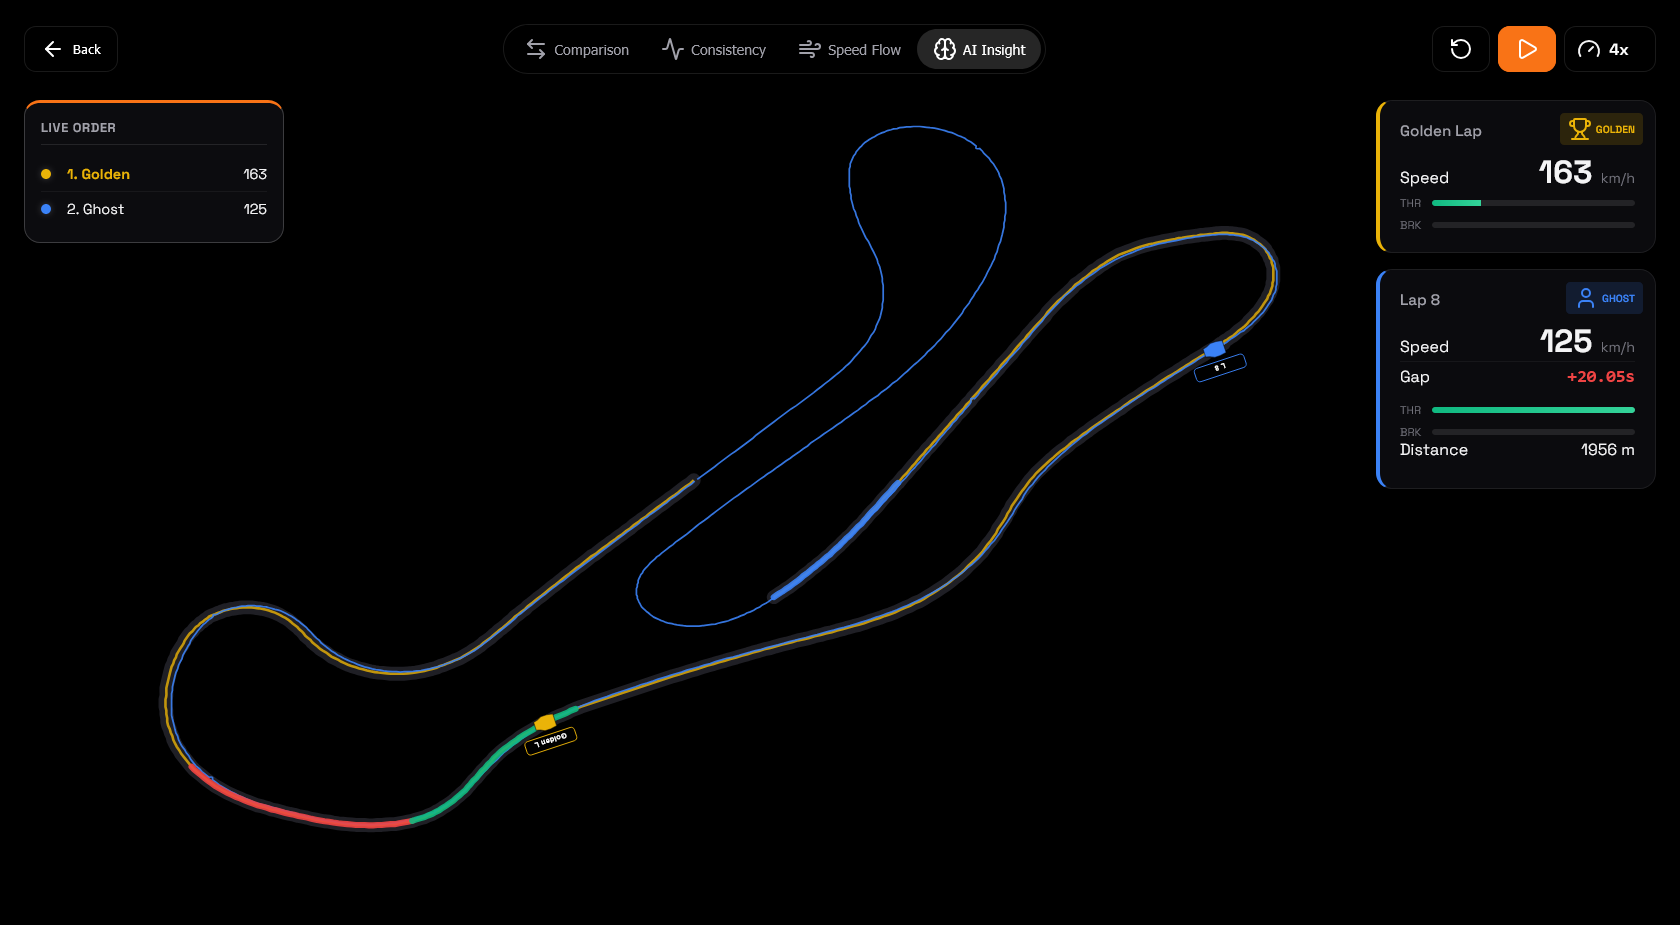
- Multi-Lap Replay: Animated comparison mode with ghost cars showing you exactly where you're losing time, frame by frame
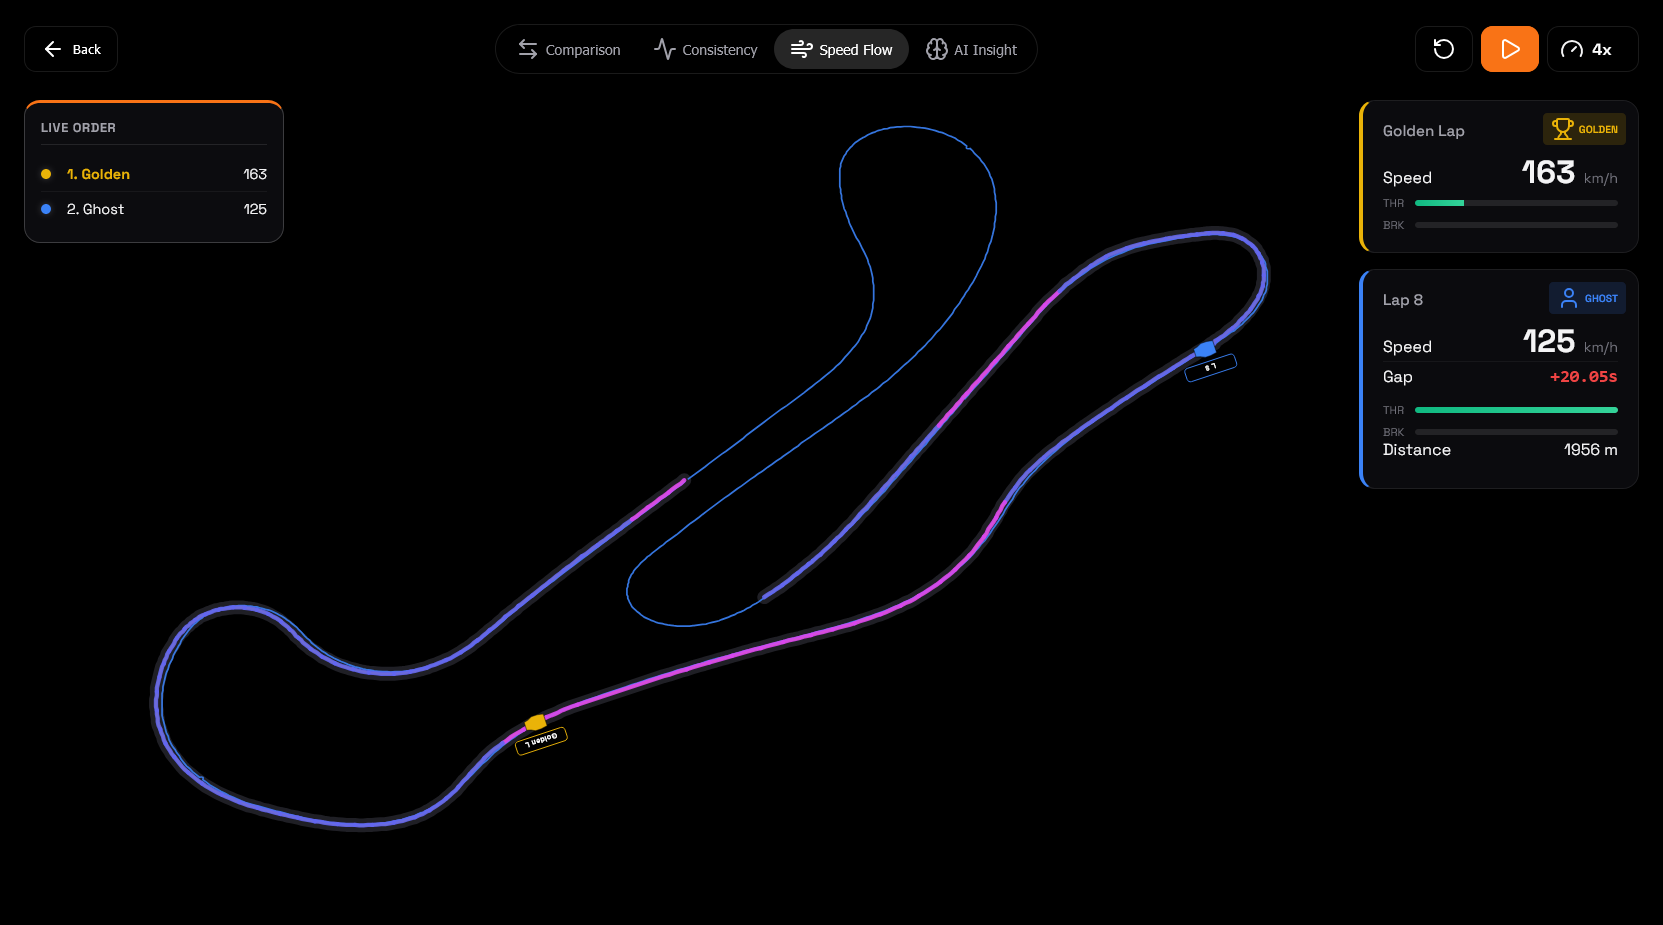
- Speed Flow Analysis: Visual momentum mapping that highlights where you're carrying speed vs bleeding energy through corners
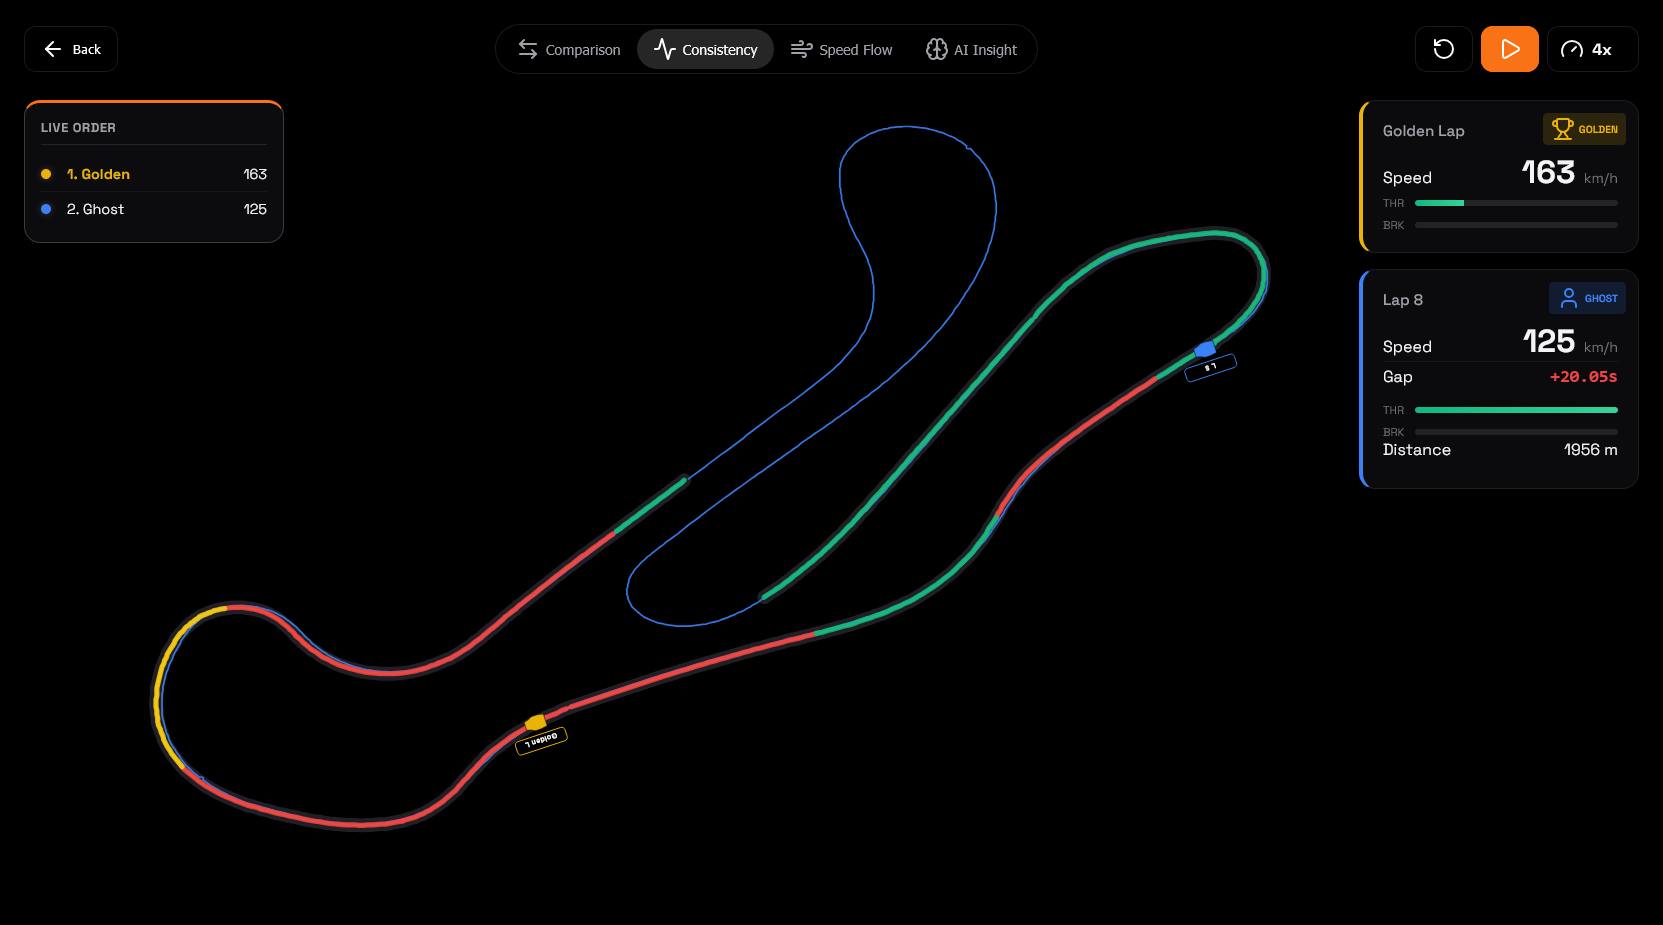
- Consistency Tracking: Identifies which laps are outliers and calculates your consistency score across sessions
- AI Insight Engine: Gemini 2.5 Pro analyzes your driving patterns and delivers targeted recommendations in natural language
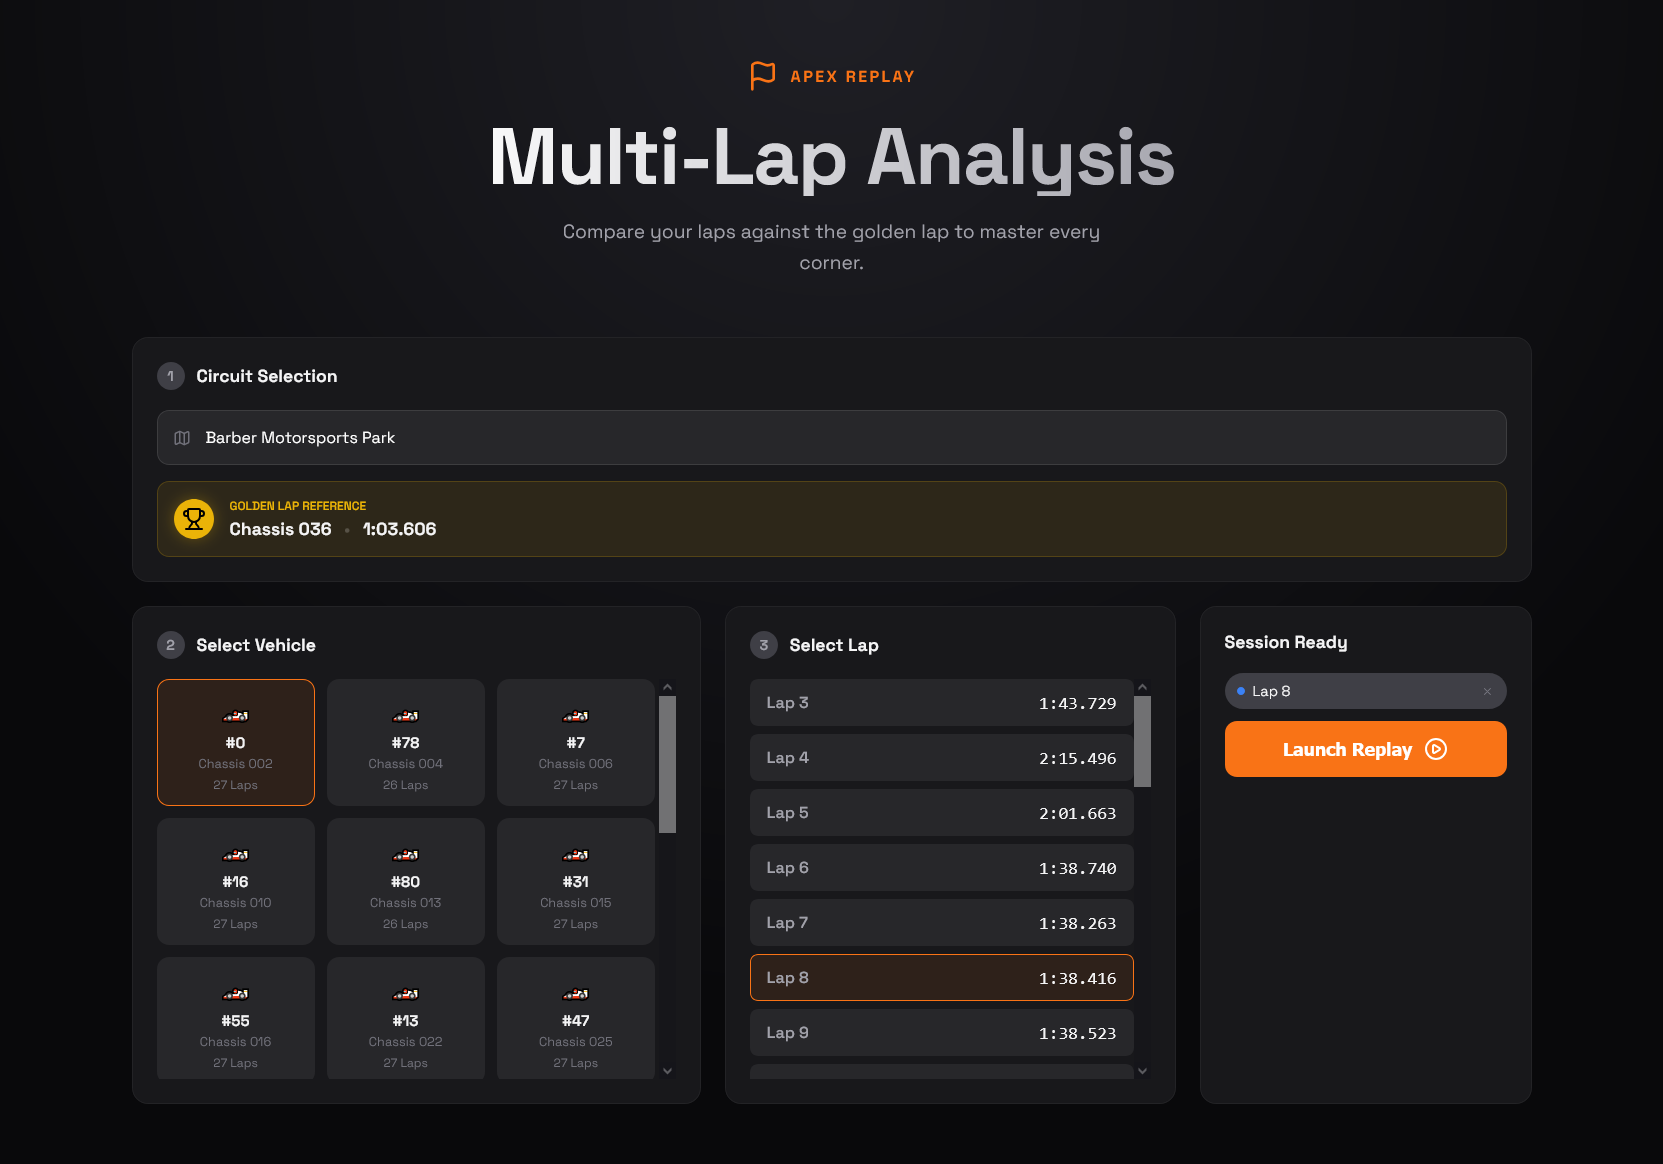
- Curated Datasets: Pre-loaded with enriched telemetry from Barber and Indianapolis for immediate analysis
The platform focuses on teaching, not just measuring. Every visualization includes contextual tooltips, every metric comes with actionable advice.
How I built it
The architecture balances performance with simplicity:
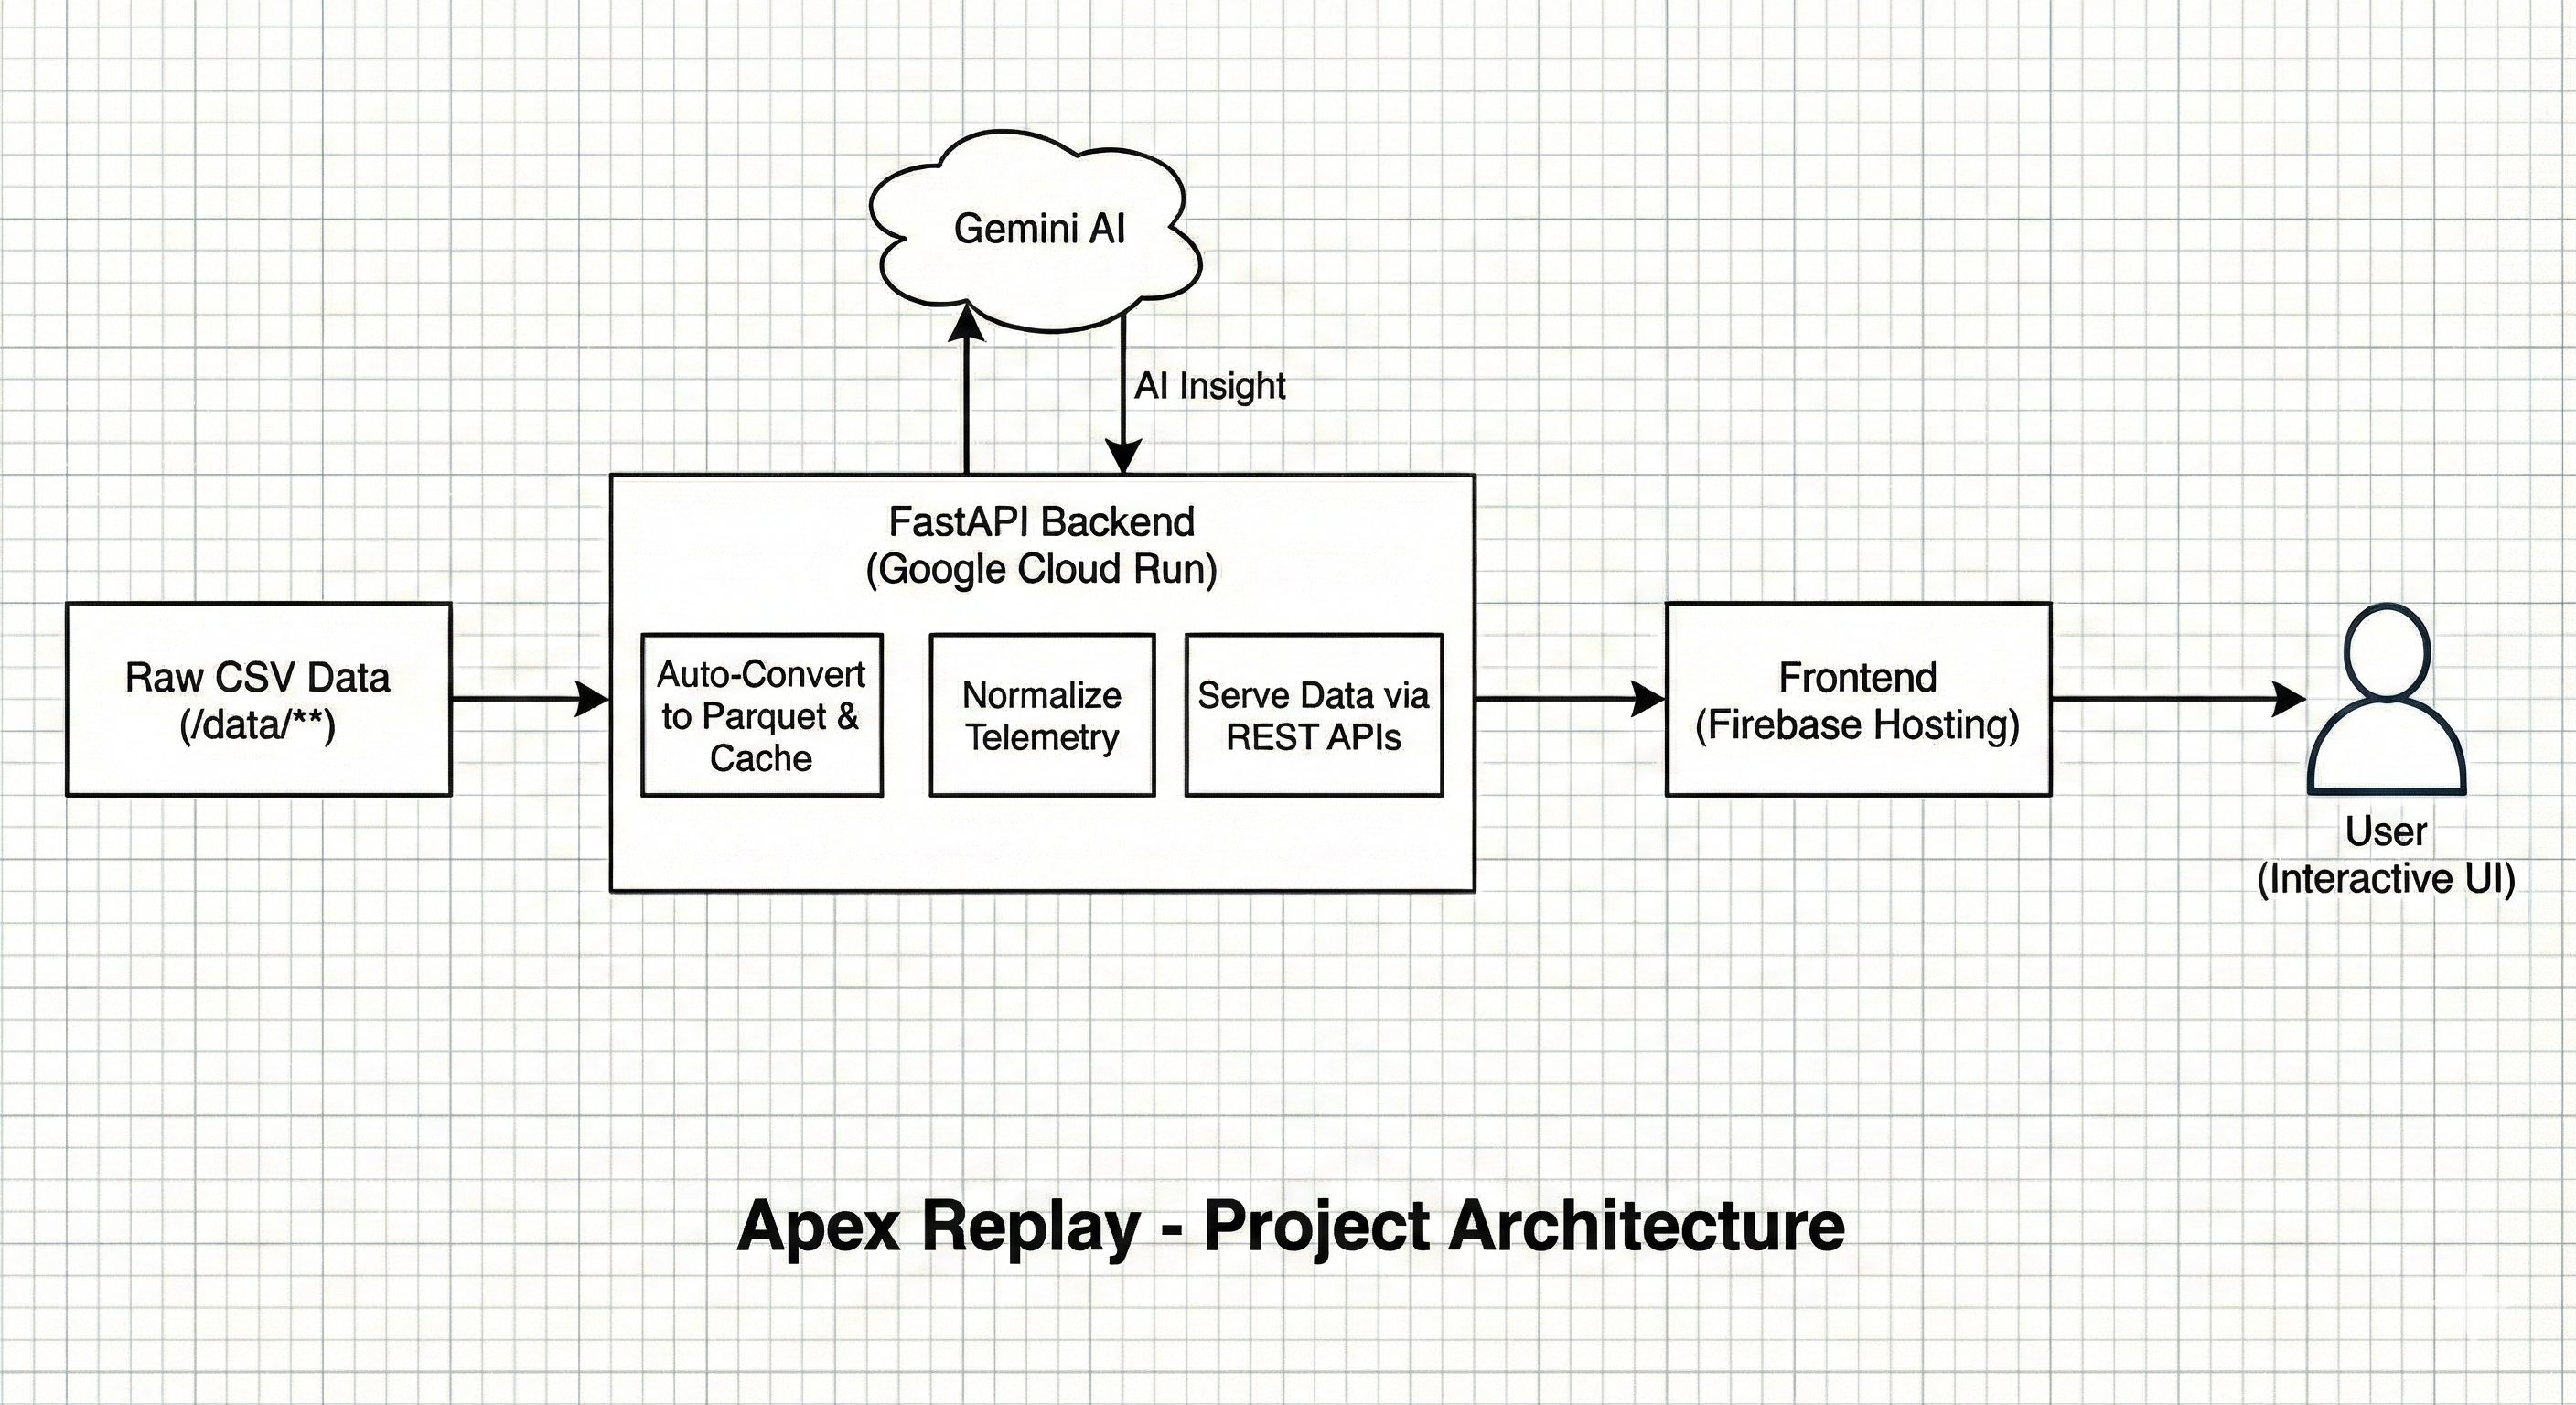
Data Pipeline (Python):
- Built an auto-discovery system that scans circuit folders and converts CSV telemetry to Parquet format
- Achieved efficient storage (Parquet compression reduces dataset size significantly while maintaining full fidelity)
- Implemented smart caching: lap events, golden lap detection, and vehicle metadata load once and persist
Backend (FastAPI):
- REST API serves normalized telemetry with sub-second response times
- Comparison engine calculates sector-by-sector deltas and identifies improvement zones
- AI integration layer that serializes telemetry into structured JSON for Gemini 2.5 Pro analysis
Frontend (Vanilla JS + D3):
- Canvas-based rendering for smooth 60fps animations with thousands of GPS points
- Three visualization modes: Comparison (ghost laps), Consistency (variance heatmaps), Speed Flow (momentum analysis)
- Chart.js integration for speed traces, lap progression, and timeline analysis
- Zero framework overhead—pure performance with progressive enhancement
Cloud Architecture:
- Frontend deploys to Firebase Hosting (global CDN, automatic SSL)
- Backend containerizes to Google Cloud Run (serverless, auto-scaling)
- No external database needed—the processed dataset bakes into the container
Challenges I ran into
Dataset complexity: The raw telemetry used mixed naming conventions across circuits (barber_telemetry_R1.csv vs vir_lap_time_R2.csv). I built a regex-based discovery system that handles any convention, making the platform extensible to new circuits without code changes.
Real-time animation performance: Rendering animated ghost cars across 10,000+ GPS coordinates was causing frame drops. Solution: D3's spatial indexing (quadtree) for efficient point lookups + throttled animation loops. Now runs at 60fps even on modest hardware.
AI context optimization: Gemini can't consume raw telemetry arrays (too large). I created a summarization pipeline that extracts key metrics—sector deltas, speed variance, consistency patterns—into compact JSON. This reduced payload size by 95% while preserving coaching quality.
GPS coordinate precision: Some circuits had sparse GPS sampling (one point every 50 meters). Implemented cubic spline interpolation to smooth track rendering while maintaining geometric accuracy.
Deployment edge cases: Python 3.13 broke Pandas compilation on Cloud Run. Created custom Dockerfile forcing Python 3.11 to ensure reproducible builds.
What I learned
This project deepened my understanding of production-ready data processing. I learned how to:
- Design for stateless serverless environments (baked-in datasets, no persistent storage)
- Optimize client-side rendering for large datasets (spatial indexing, progressive loading)
- Structure AI prompts that extract actionable insights from numeric data
- Balance performance with developer experience (automatic discovery vs manual configuration)
Most importantly: great UX for technical users means hiding complexity. Drivers shouldn't need to understand Parquet files or API schemas—they should see their racing line and know exactly what to fix.
What's next for Apex Replay
Near-term:
- Video sync: Overlay telemetry on in-car footage with frame-perfect alignment
- Multi-session trends: Track improvement across entire race weekends, not just single laps
- Export reports: Downloadable PDF coaching summaries with annotated maps
Long-term:
- Predictive lap times: ML model that forecasts your potential based on sector performance
- Driver authentication: Multi-user accounts with private telemetry libraries
- Real-time mode: Live telemetry streaming for pit crew analysis during sessions
The vision is to make professional-grade motorsport coaching accessible to every driver with a data logger.
Built With
Languages & Frameworks
- Python 3.11
- FastAPI
- JavaScript (ES6+)
- HTML5 / CSS3
Frontend Stack
- D3.js (map visualizations & animations)
- Chart.js (analytics charts)
- Tailwind CSS (styling)
- Canvas API (high-performance rendering)
Backend Stack
- Pandas & NumPy (telemetry processing)
- Uvicorn (ASGI server)
- PyArrow (Parquet conversion)
Cloud & Deployment
- Google Cloud Run (serverless backend)
- Firebase Hosting (CDN frontend)
- Google Cloud Secret Manager (API key management)
AI & APIs
- Gemini 2.5 Pro (Google AI Studio)
- Google Generative AI SDK
Data Tools
- Parquet (columnar storage format)
- CSV processing pipelines

Log in or sign up for Devpost to join the conversation.