-
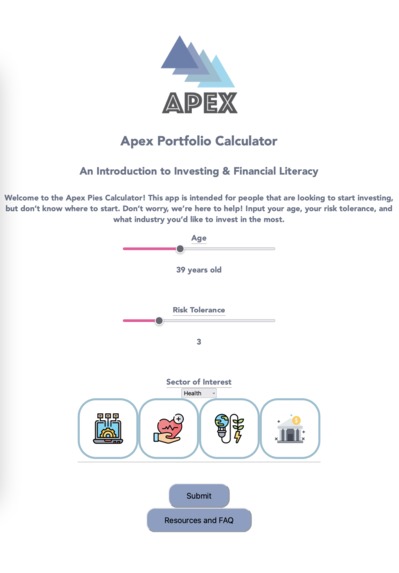
User Input page
-
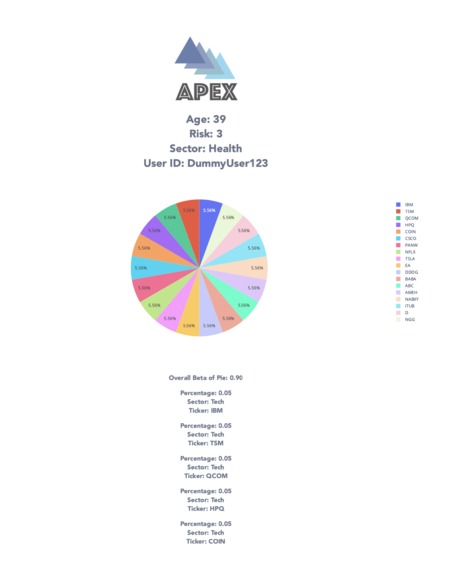
Results Page
-
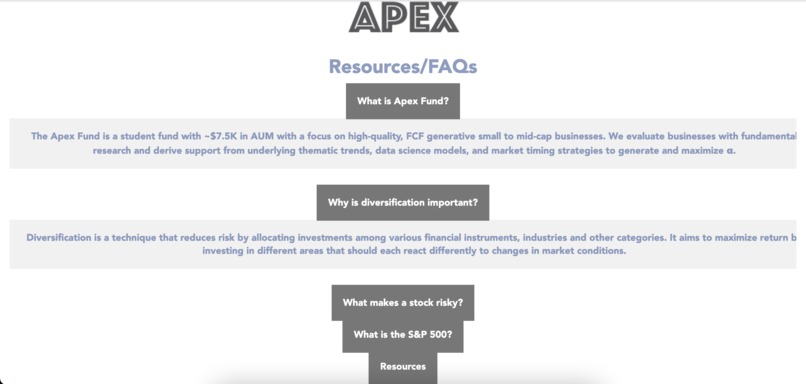
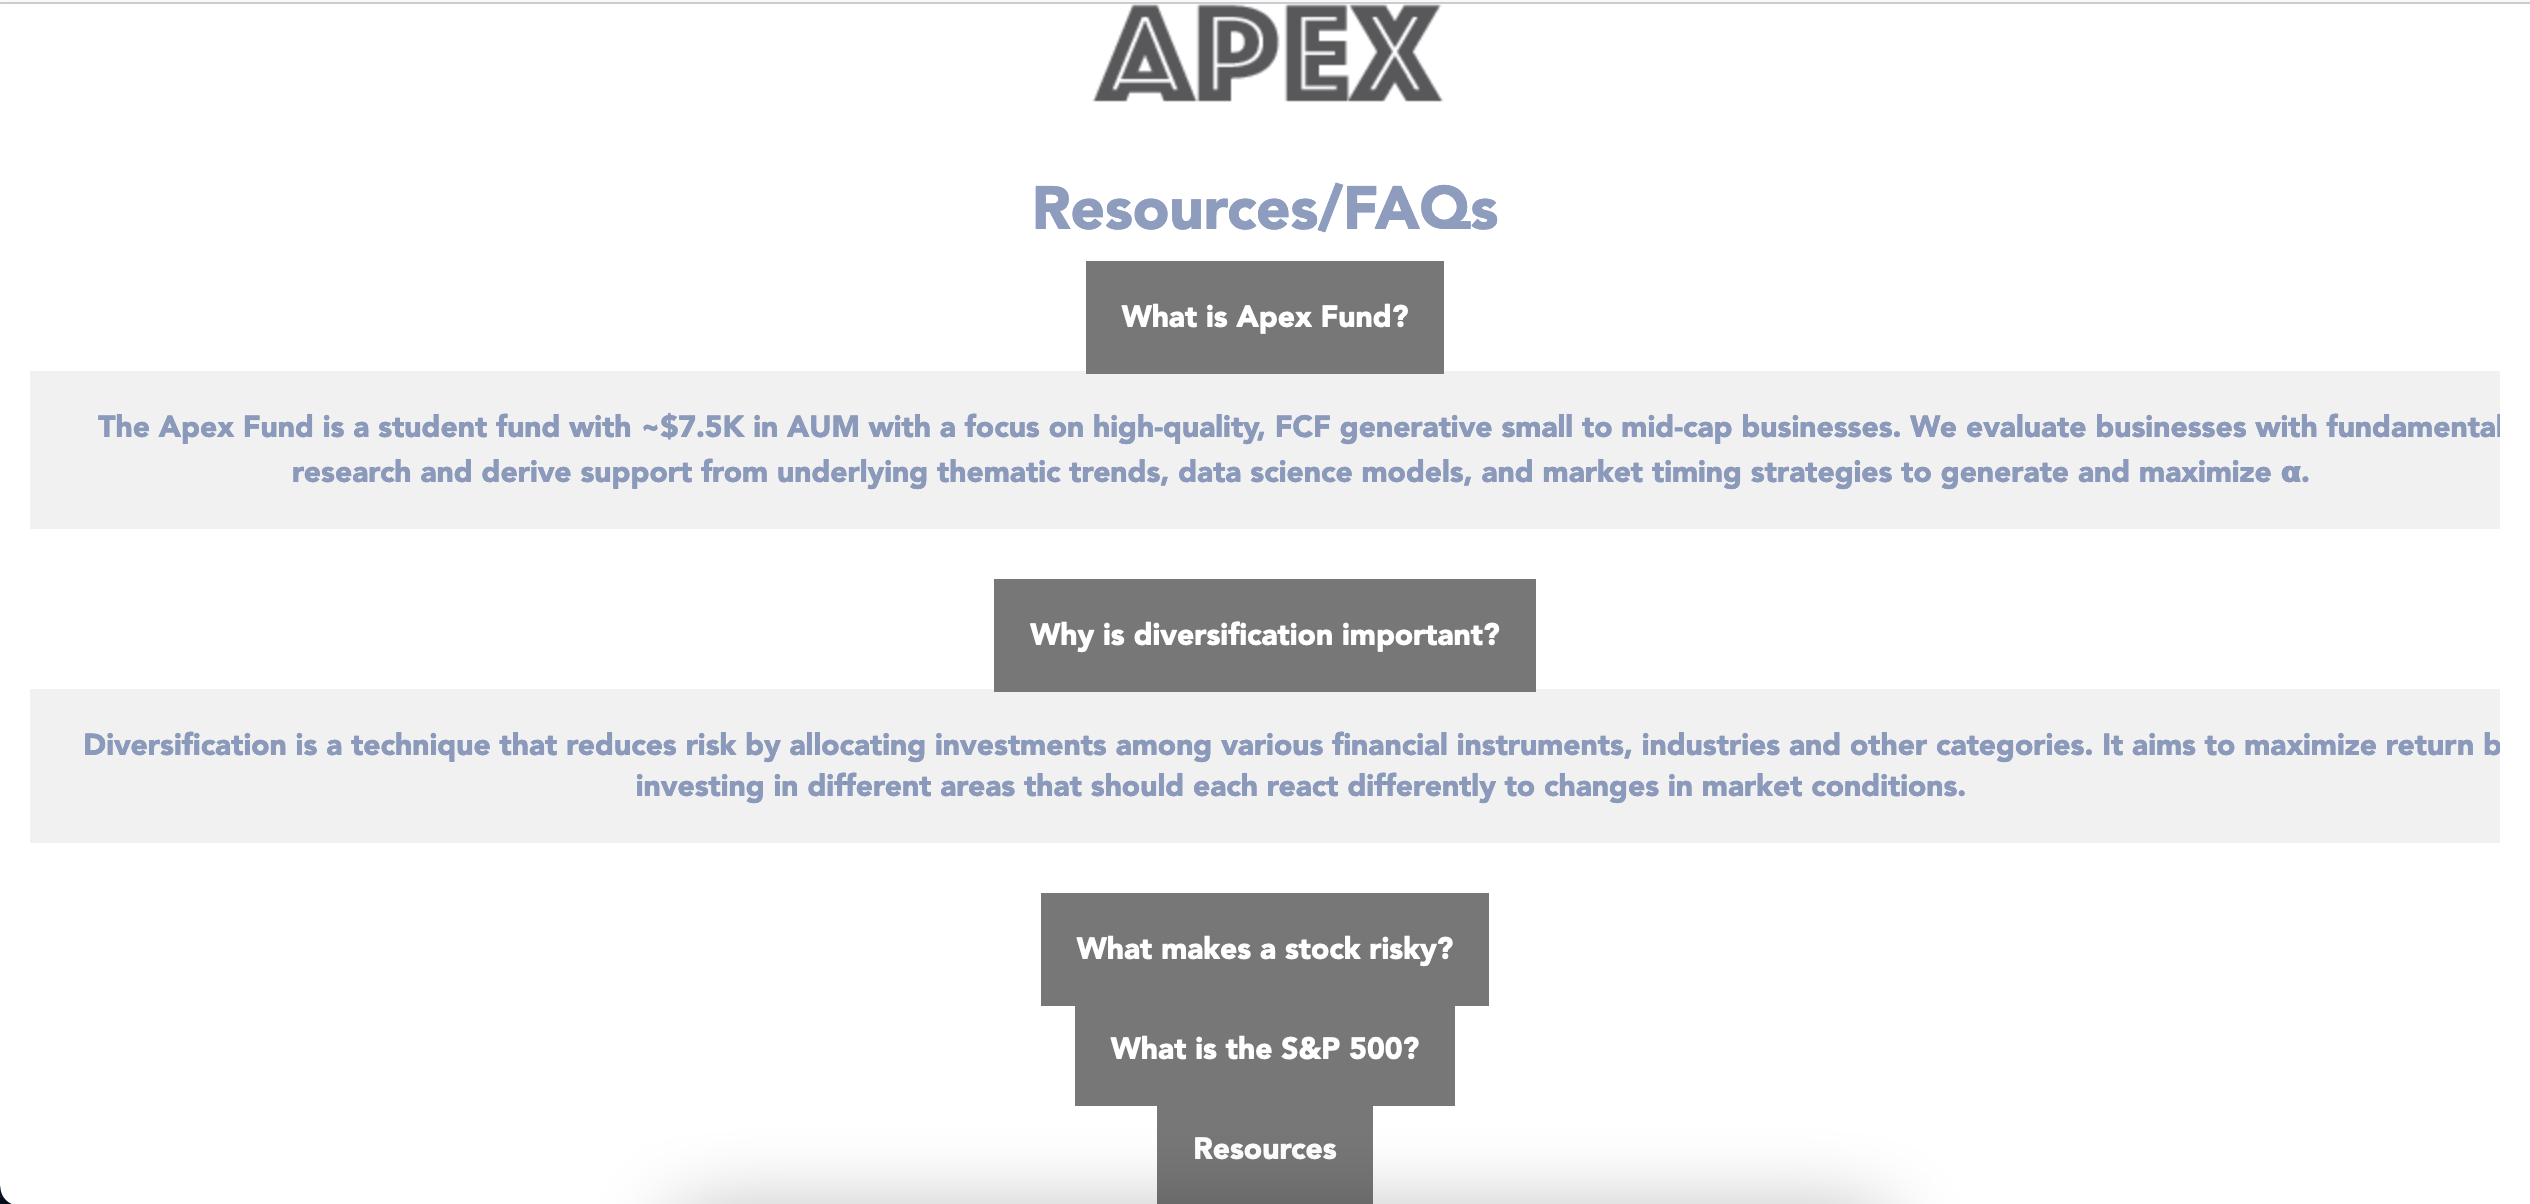
Resources/FAQs Page


Inspiration
When brainstorming we realized that there a lot of people have an interest in the field of finance, but the learning curve might be too steep for someone to feel comfortable with the investing landscape immediately. For this reason, we decided to build a tool that helps users obtain an overview of what they could potentially invest in according to key demographic parameters like age and risk tolerance. We strategically decided to ask for certain information to get the best encapsulation as to what type of investor the user is.
What it does
Our project creates a potential diverse portfolio for users based on an algorithm that relies on key demographic information from the user. We asked for basic information, and gave detailed descriptions of what each portion is useful for in terms of the algorithm. We ask users for their top industry, and provide them with an overview of each of the sectors. Based on this, we create a portfolio with 55-60% of the portfolio being in the sector that they pick, and the remainder being divided up with the other sectors, which all comes together to build a diverse portfolio.
How we built it
For the front-end, we used React.js for all of our components. We used HTML and CSS to style our website and create the flashier UI elements.
For the back-end, we used Python which was for the stock picking algorithm based on the user age, risk tolerance, and the sector that they want to invest in. For our stock-picking algorithm, we developed our own formulas for achieving a target beta, and then used an algorithm to pick the most optimal stocks for the portfolio. We used Google Finance in order to find the betas for each of the stocks.
For our database, Google Cloud Firebase was the way to go. We realized that Realtime Database fulfilled our needs perfectly by allowing us to add unstructured JSON data. We added the pies for each of the users into Realtime Database, along with a link to the visualizations we created and the average beta.
We used many libraries for our project. We utilized Pandas in order to create the data frames that we received from Google Cloud’s Realtime Database. For our visualizations, we used Plotly in order to generate data visualizations, and then had to use the Create Studio/Plotly API in order to upload our visualizations for our front-end to fetch.
Challenges we ran into
We ran into a lot of challenges with using our tech stack as this was the first time that we created a web app. Some struggles we went through were creating data visualizations as well as creating the back-end algorithm for picking the top stocks. We first aimed for picking a stock that fell within the target beta, but sometimes, the algorithm would fail to pick one fast enough and would time out. We had to change the algorithm in order to make sure that such an error doesn’t happen. With the data visualizations, we aimed to first convert our graphs to an HTML string, but we realized that it wouldn’t work due to the string being too long. We had to use the Plotly API in order to upload our visualizations to the Chart Studio website. Based on that, we had to pass the link to the visualizations through JSON for the front-end to show the visualization.
Another recurring struggle was making sure the order of which ReactJS executed different actions when moving from one screen to another was consistent. For example, the “Submit” button in the home page does the following big tasks in order: send request to Flask backend to create optimal pie and publish it to the Firebase DB, move the user to the result page, request the finished Plotly plot from the backend, and then render that graph and the rest of the results page.
Accomplishments that we're proud of
We are proud of creating a dynamic user interface and creating an alogorhim that achieves a reasonable target beta based on the parameters provided by users. Most of us had no prior hackathon or frontend development experience. However, we were able to put together the various components of the project by persistently researching, designing, and testing the code.
What we learned
Urjoshi: Coming in I had no experience with front end. However I learned how to collaborate with a team on a software product using the git workflow, write and style html components with html and css, and design for better user understanding. Adithya: The overall React.js framework and communicating between react front end and flask back end.
What's next for Apex Pies
- A buy functionality that trades on paper trading API which will spawn more educational metrics on pie performance.
- Incorporate other interesting and impactful user metrics such as yearly income when determining the best recommendation of stocks.
- Create a more robust list of signals that shape a optimal pie in addition to the beta indicator. More ideas we have:
- Educational pop-ups
- More randomization in the diversification of the pies
- Being able to access all the stocks on the market
- Better UI experience (grouping pie pieces by sector)

Log in or sign up for Devpost to join the conversation.