Inspiration

Many of us own a few ETFs and assume we're diversified. When we looked inside the funds, we kept finding the same companies. Blackstone's challenge asked how investors could better understand what they own, and that was the problem we wanted to solve.

What it does

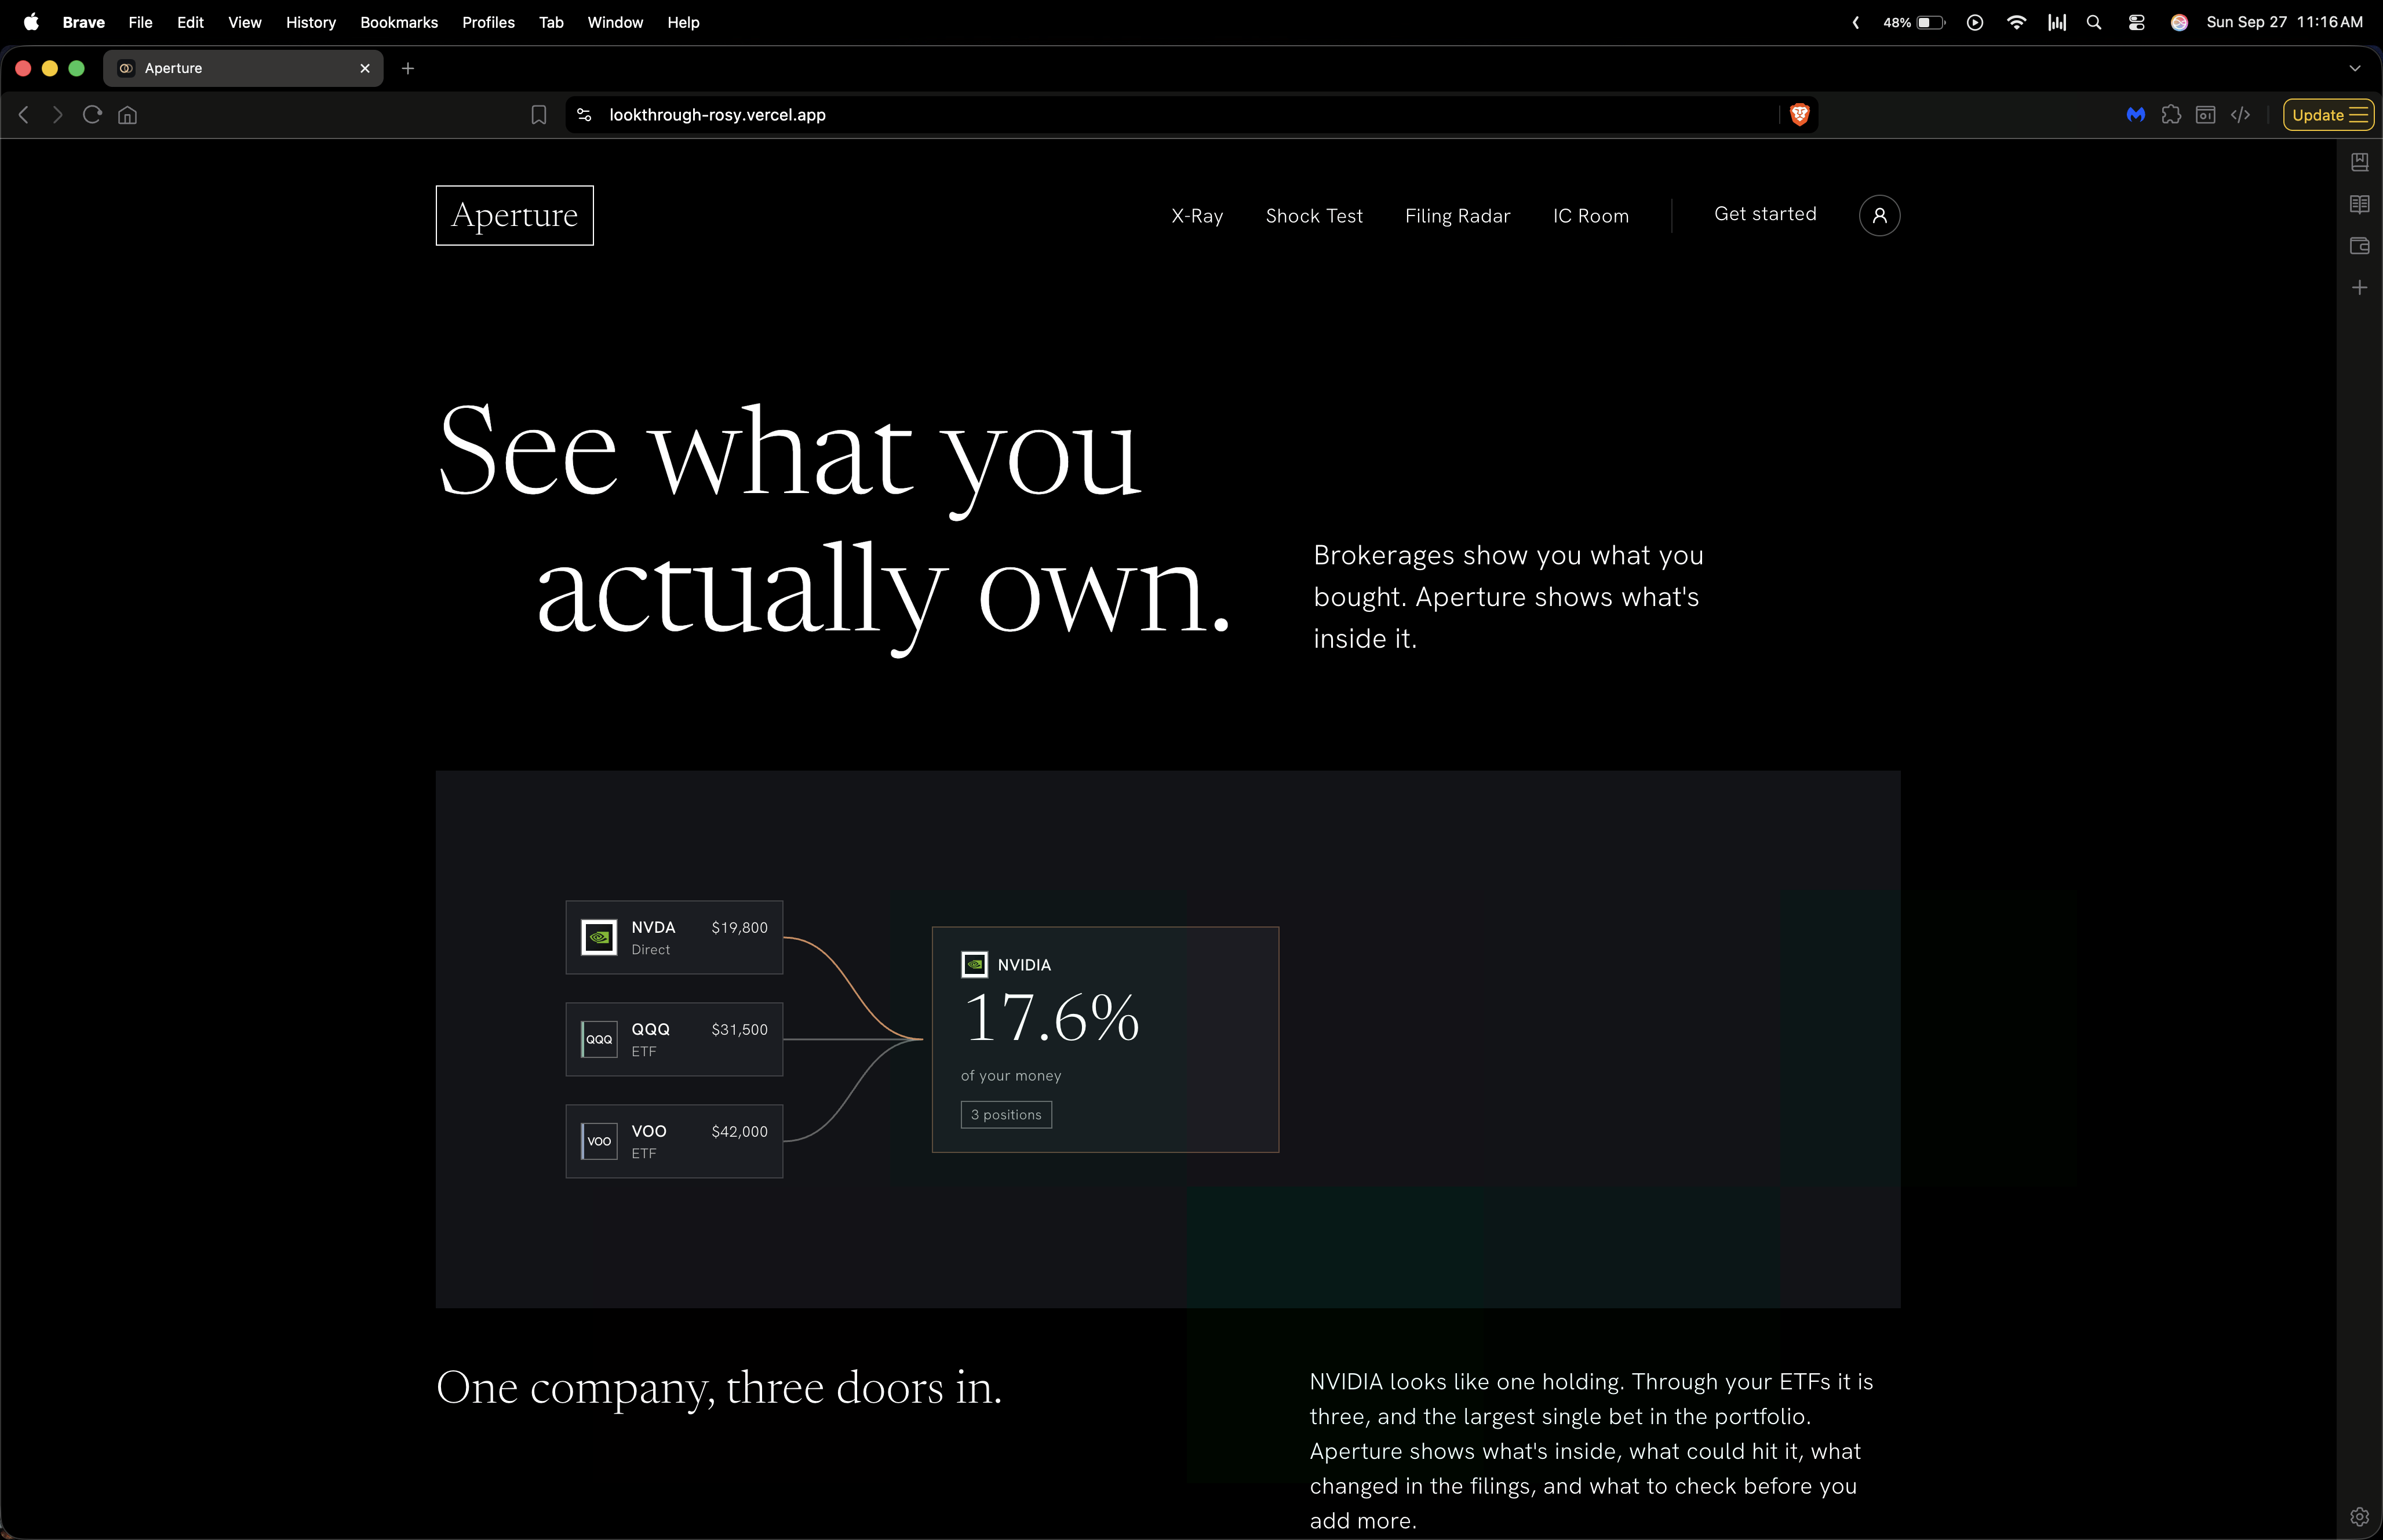
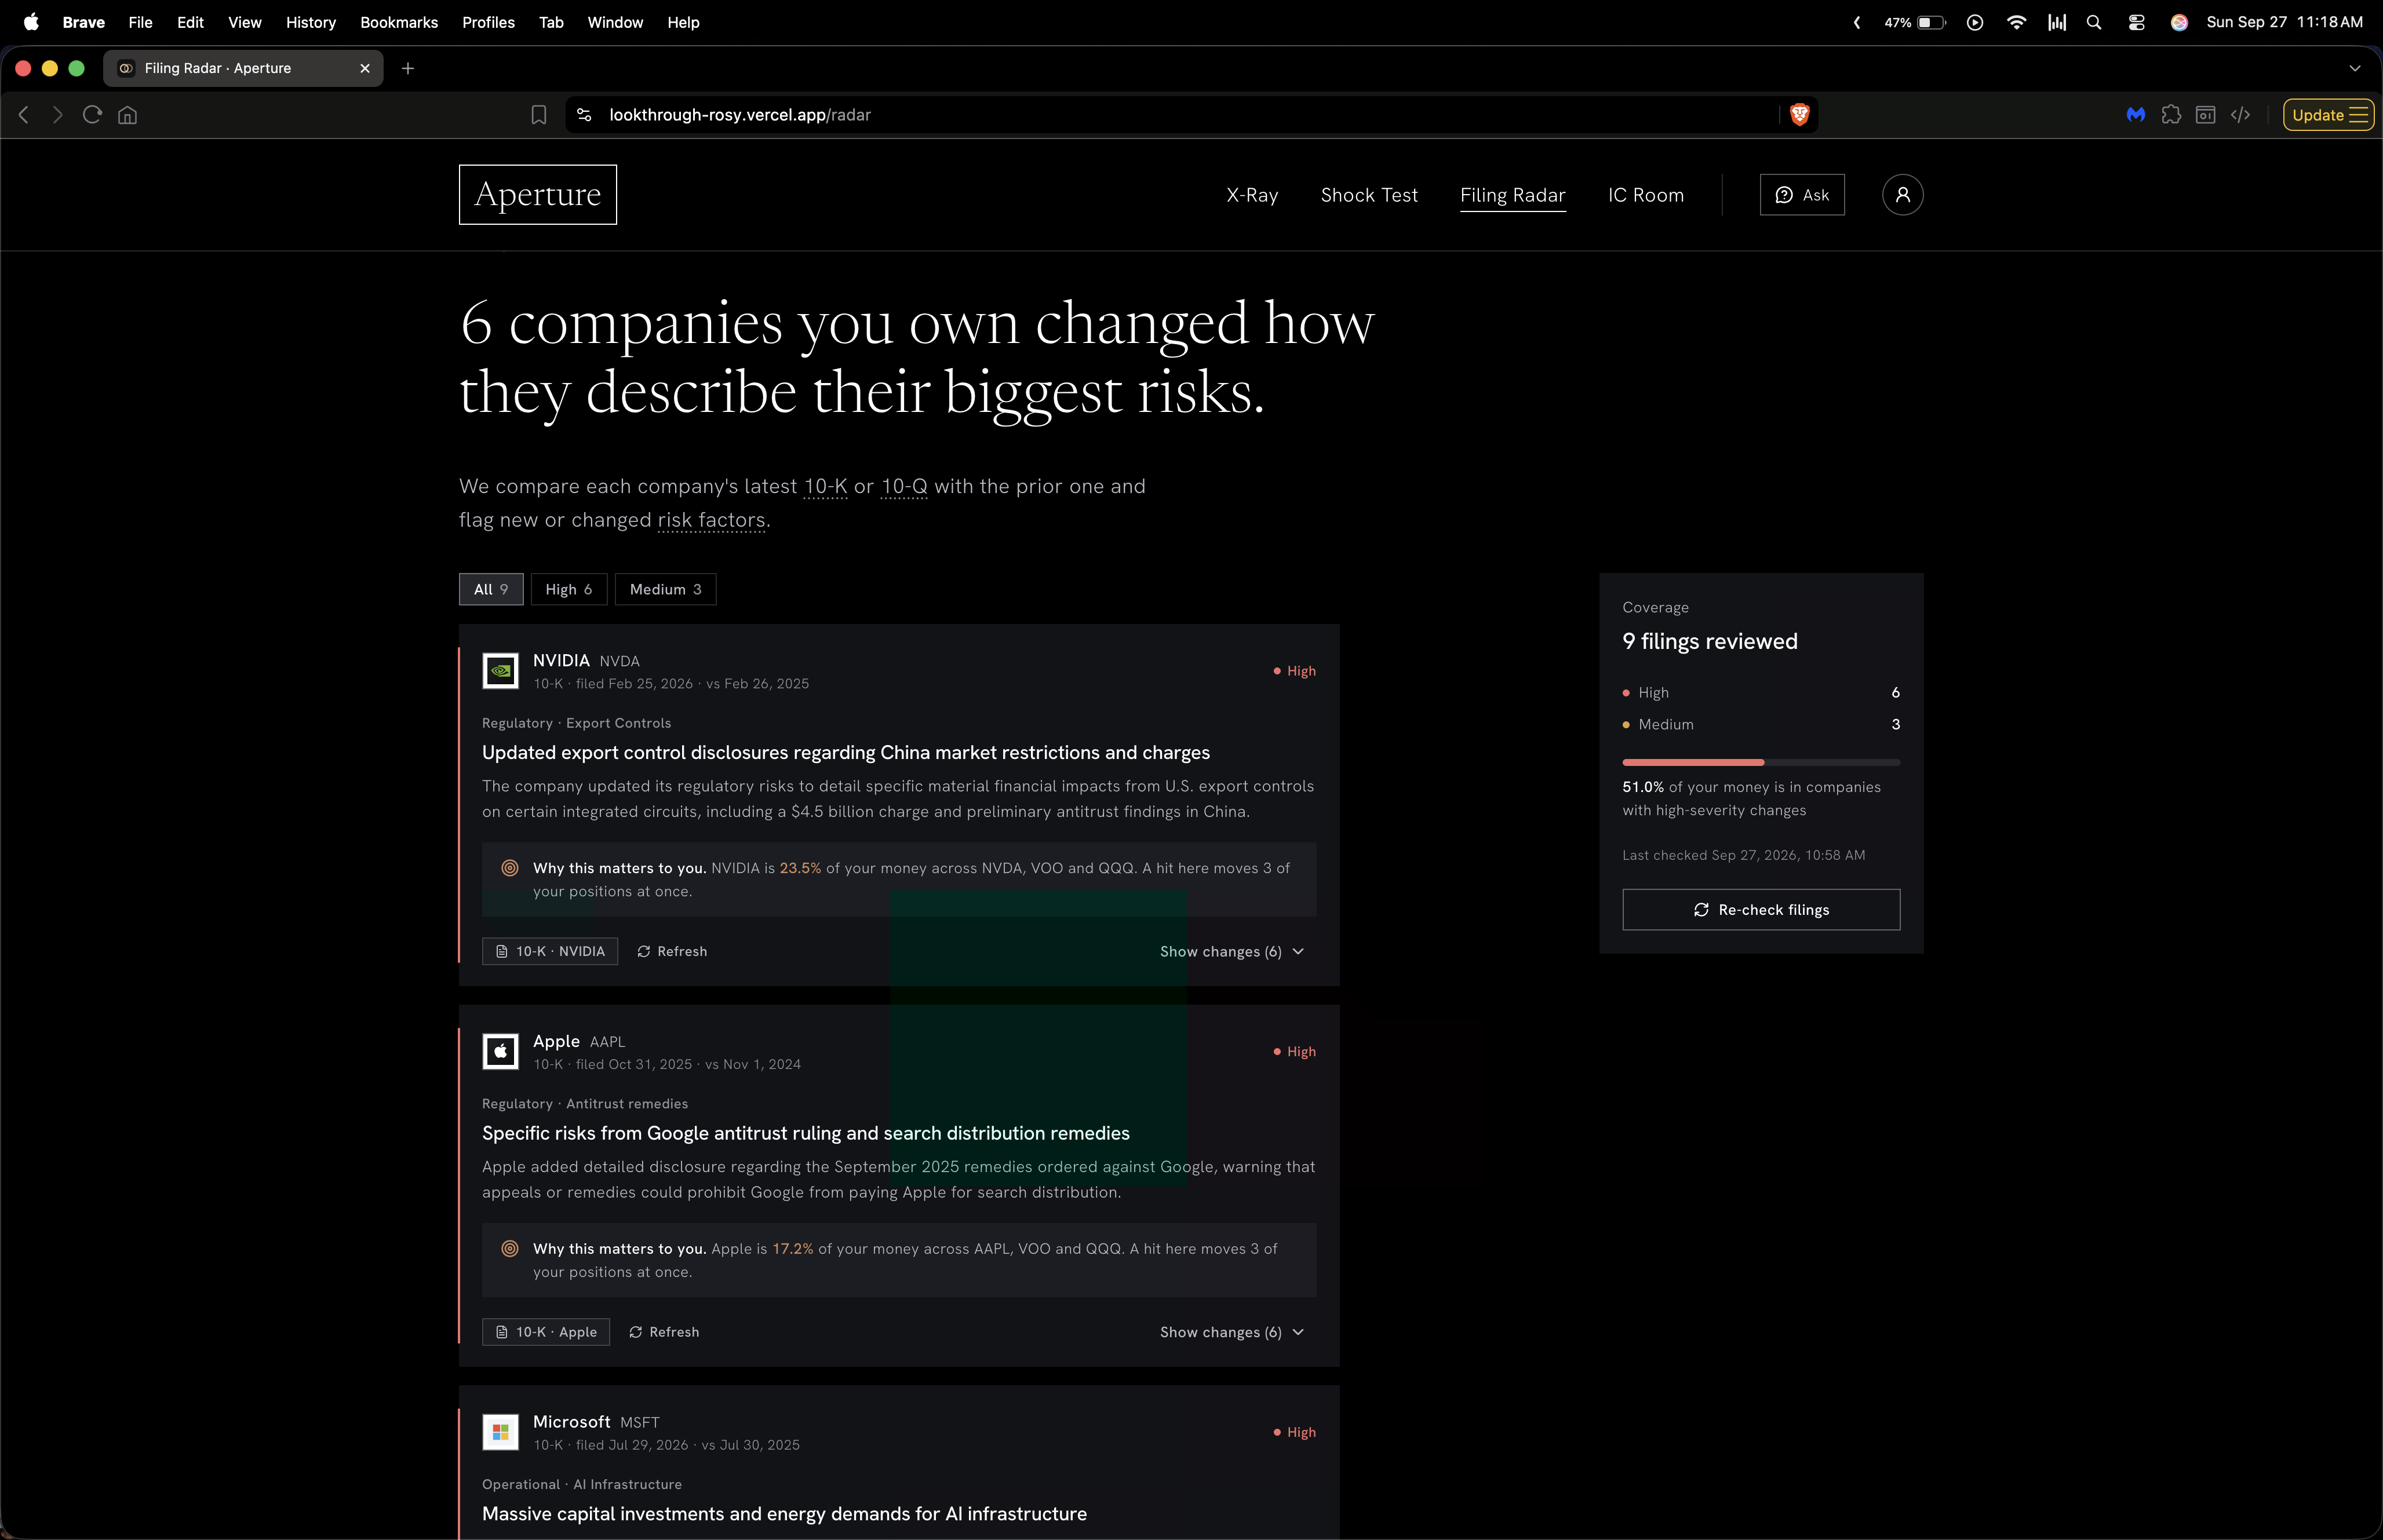
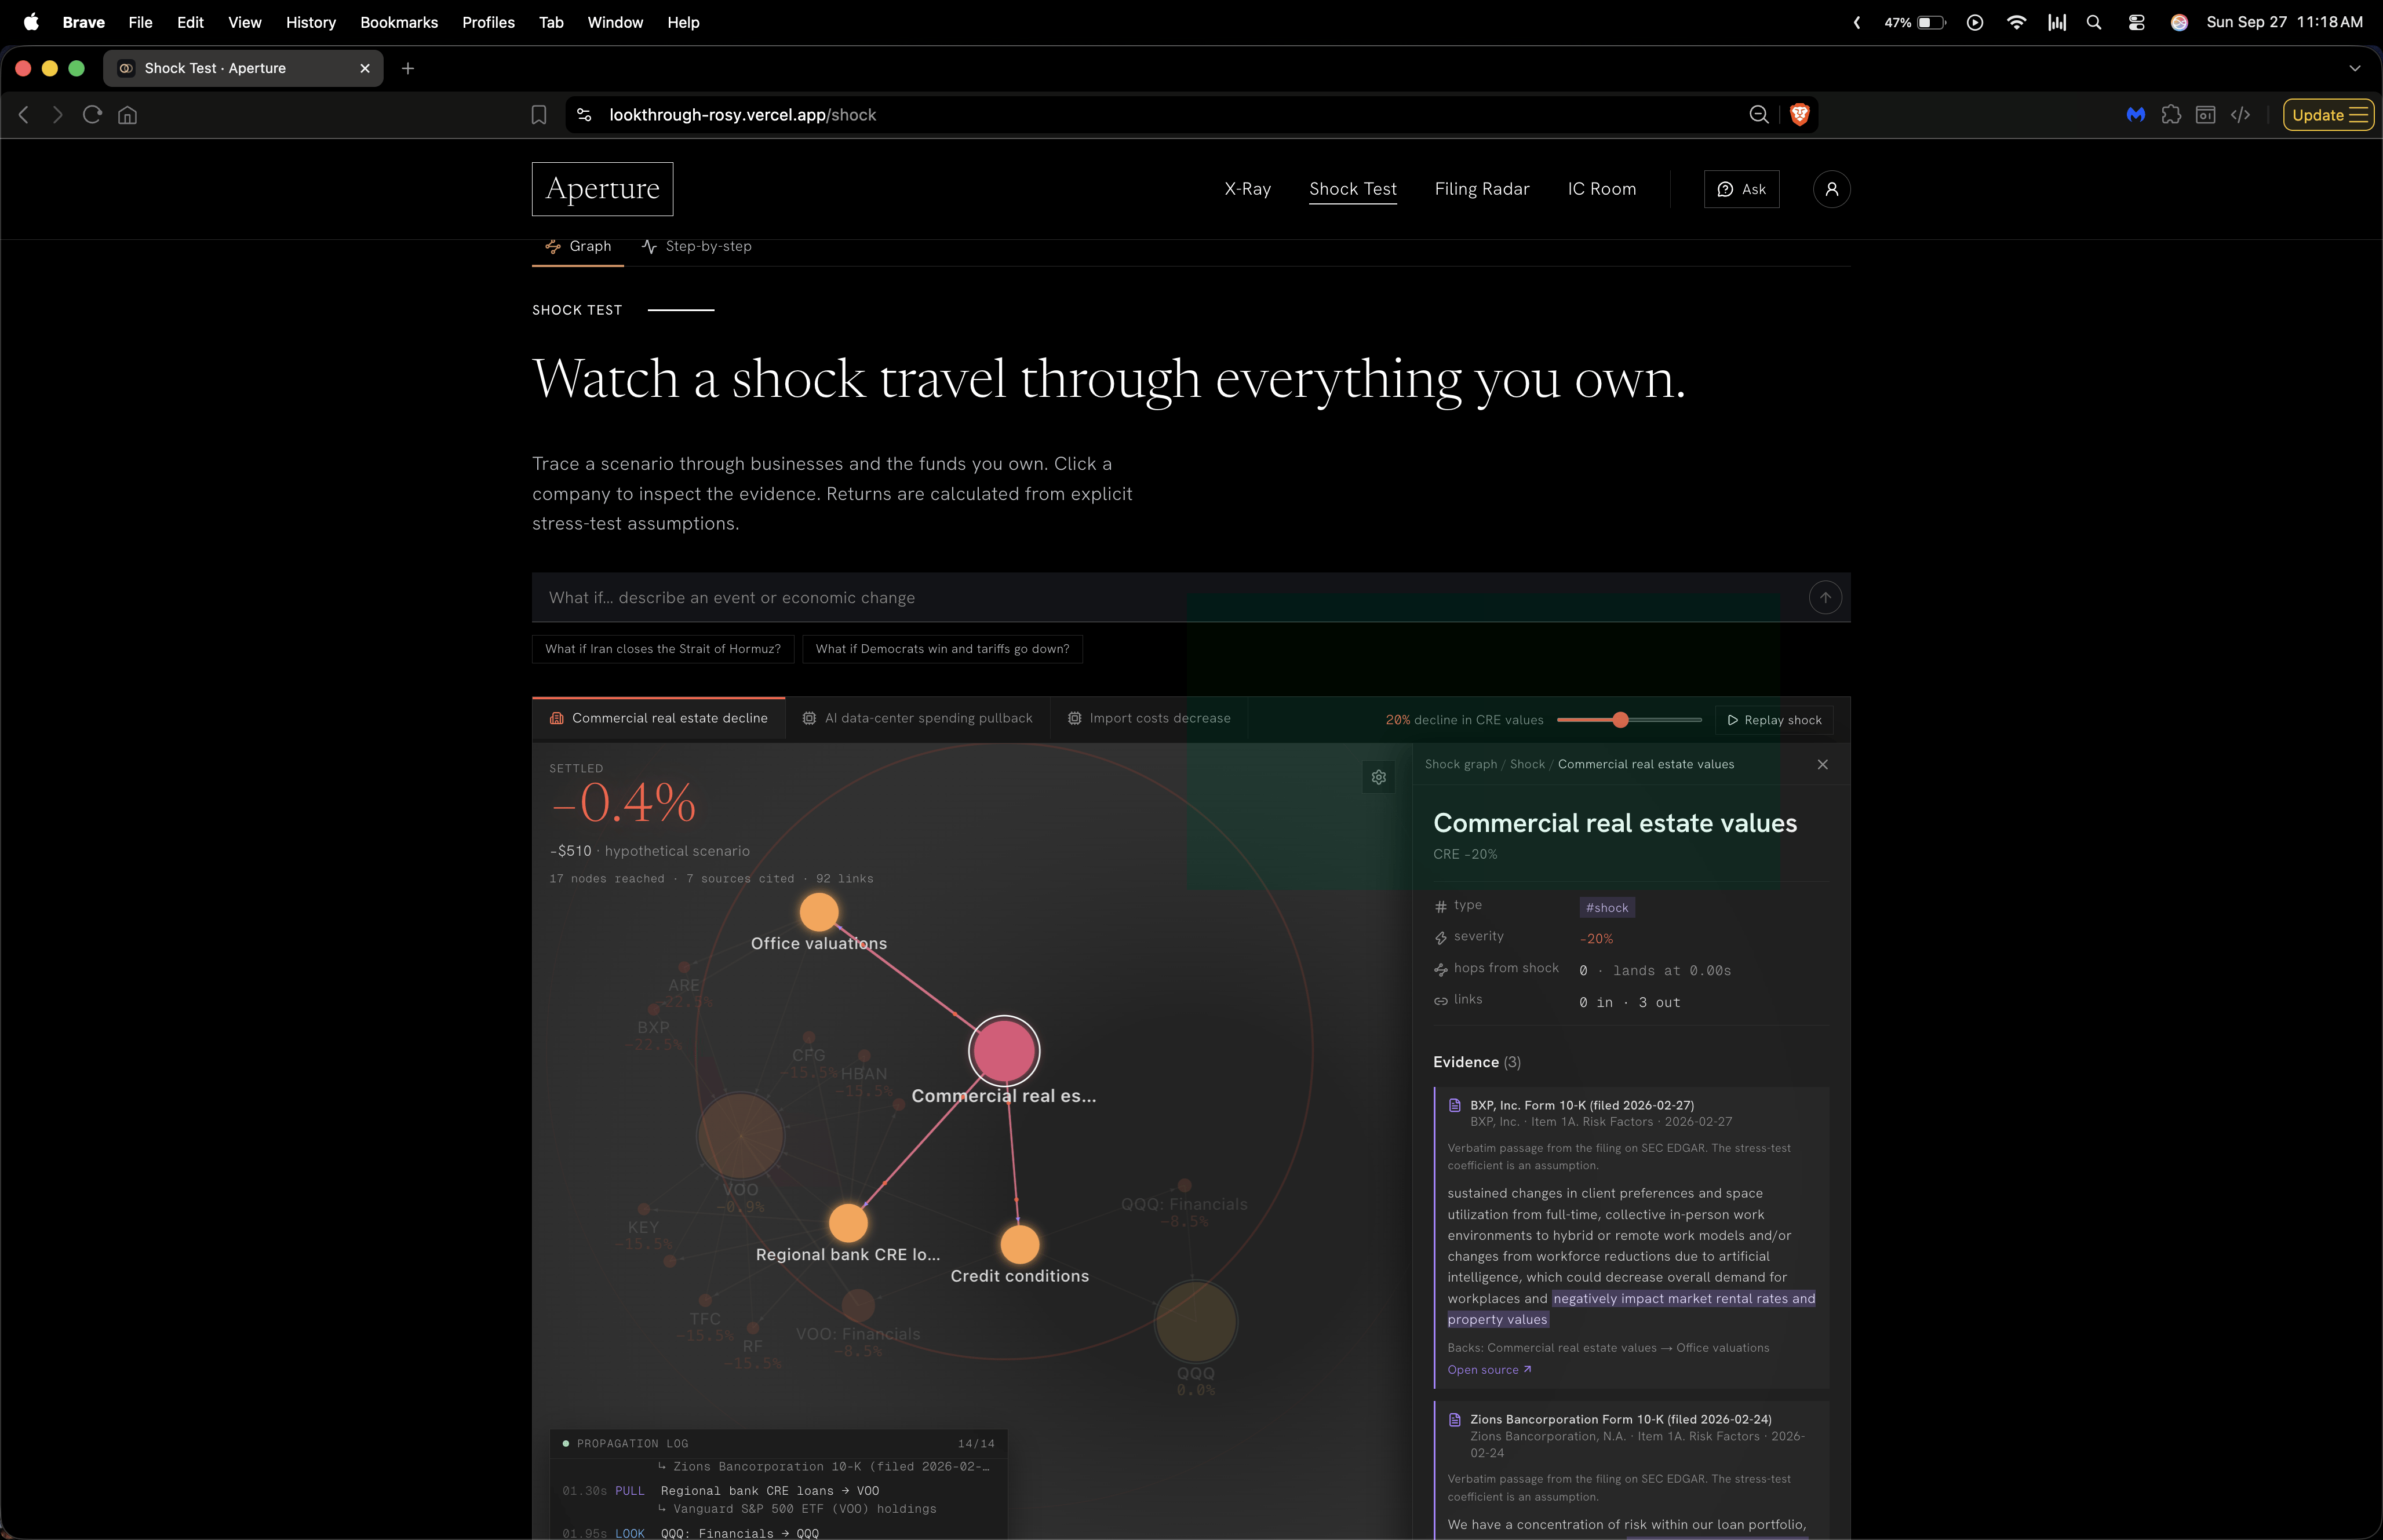
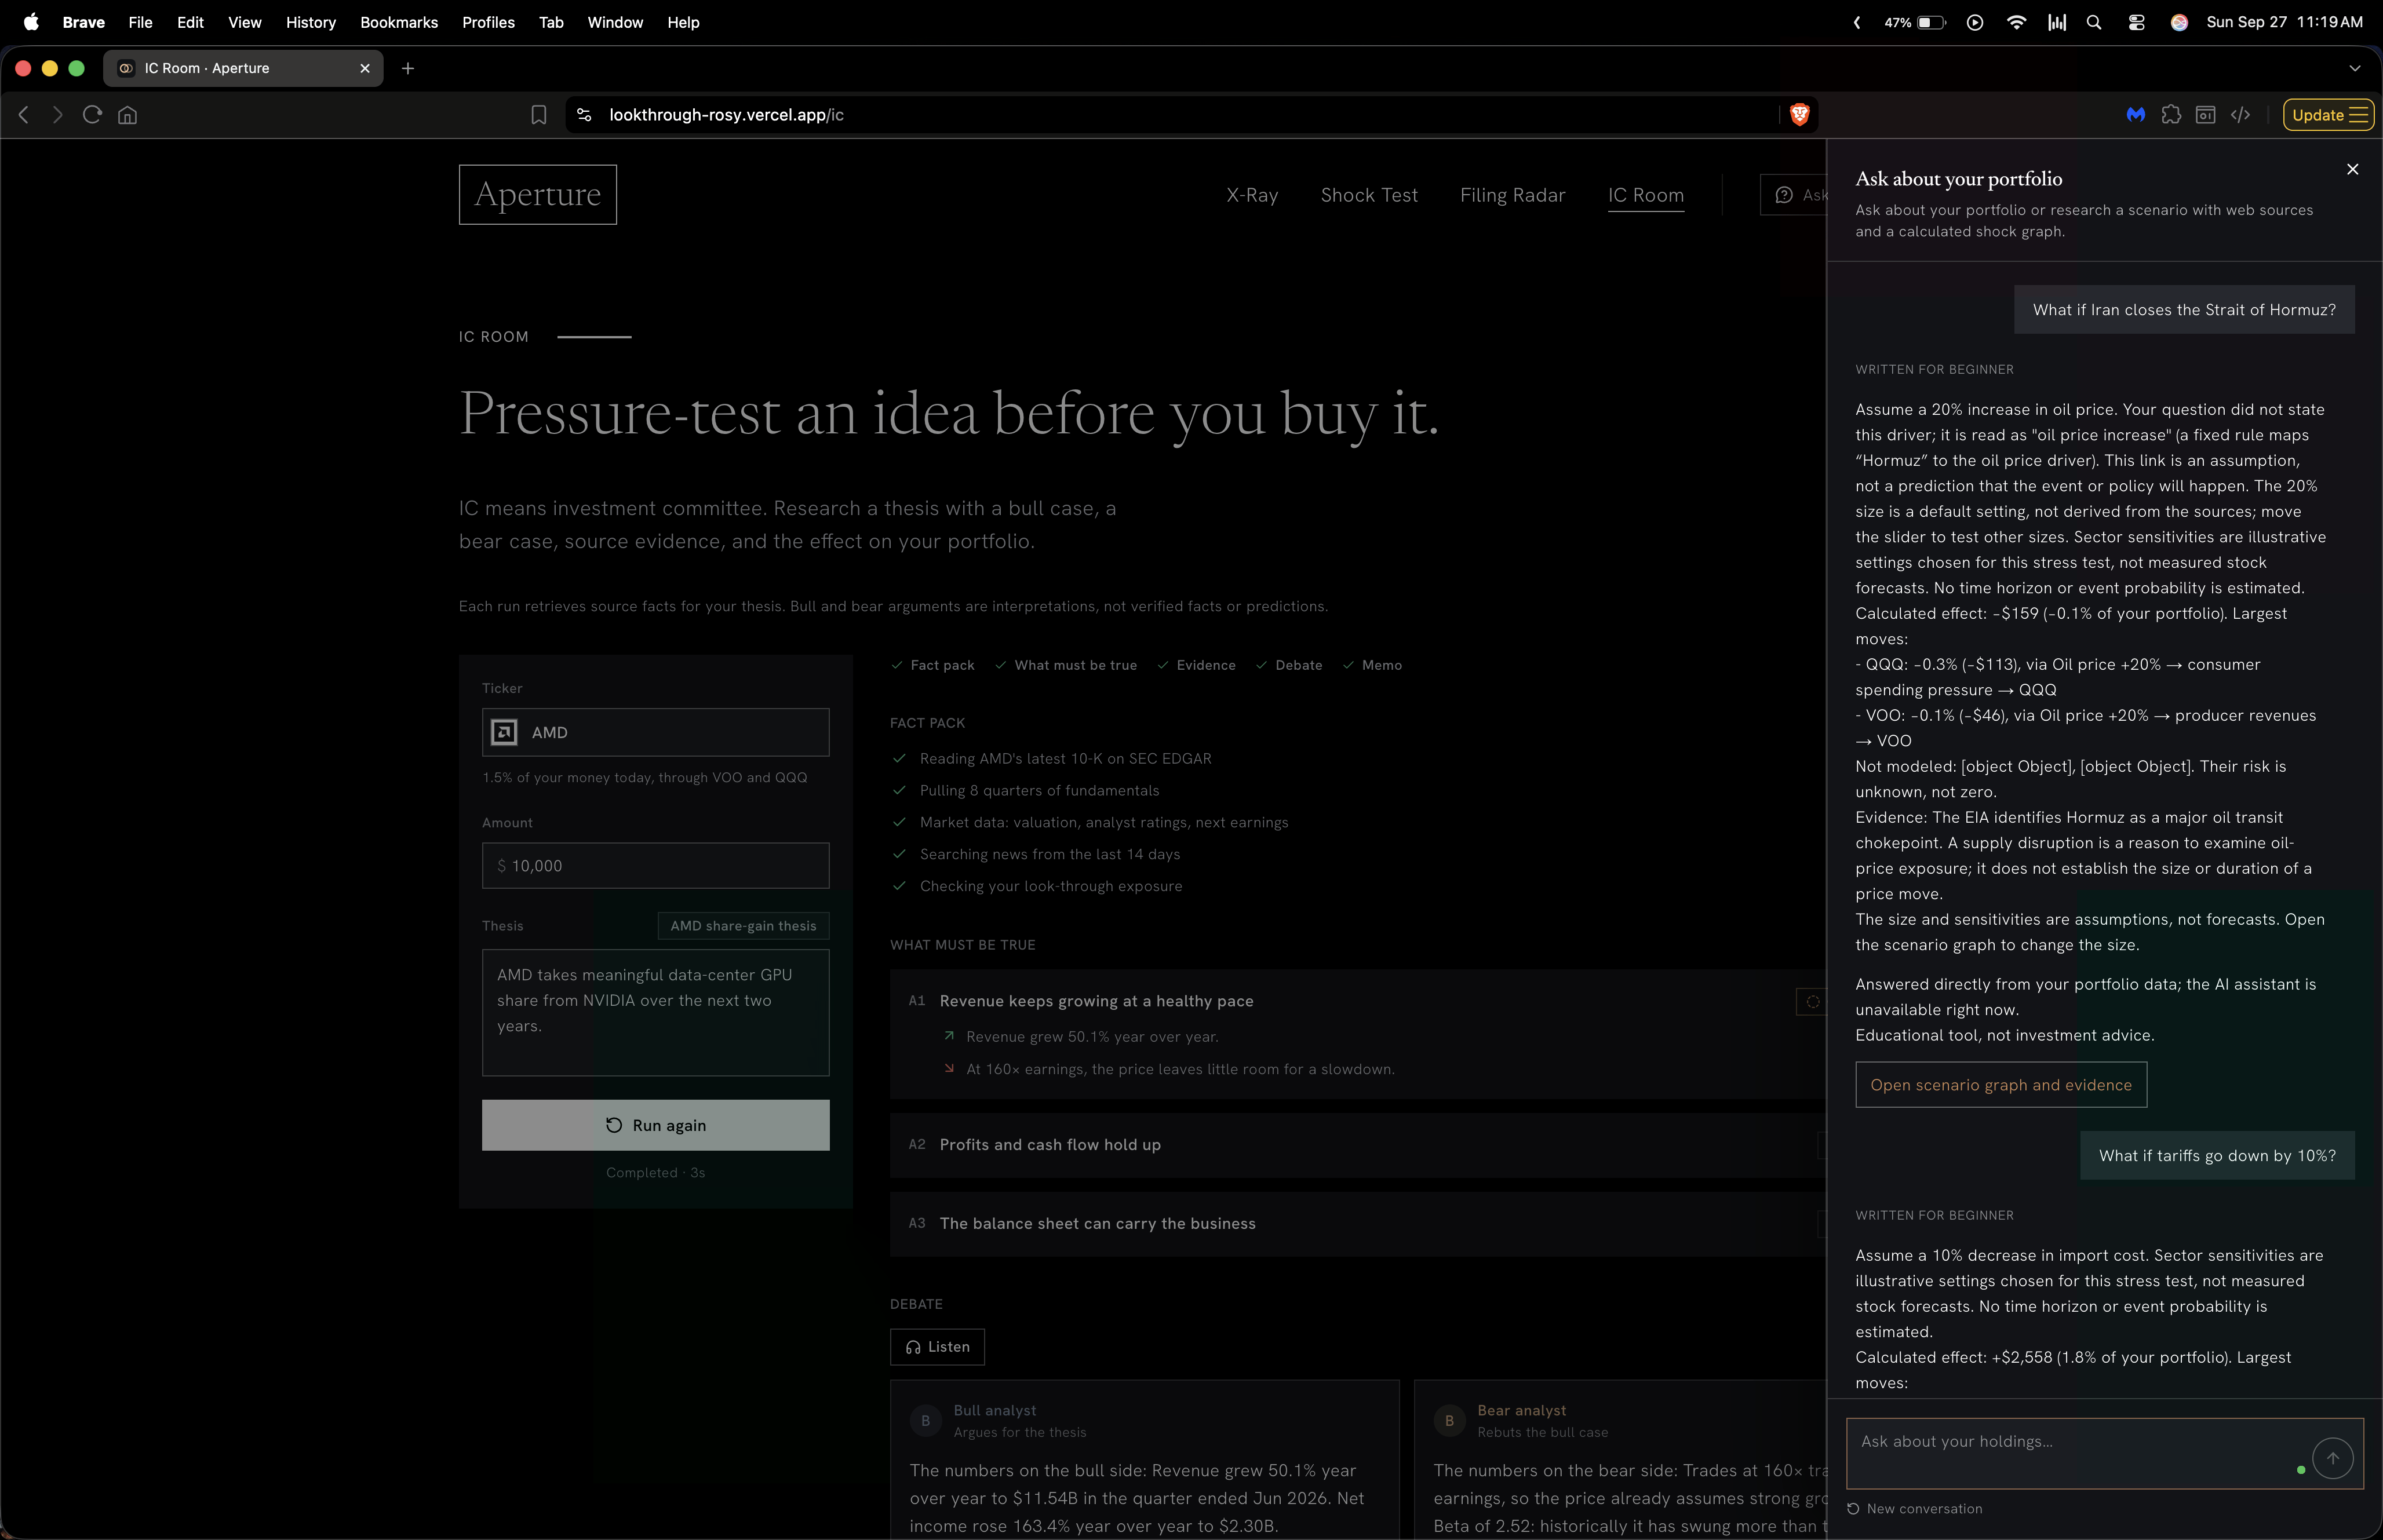
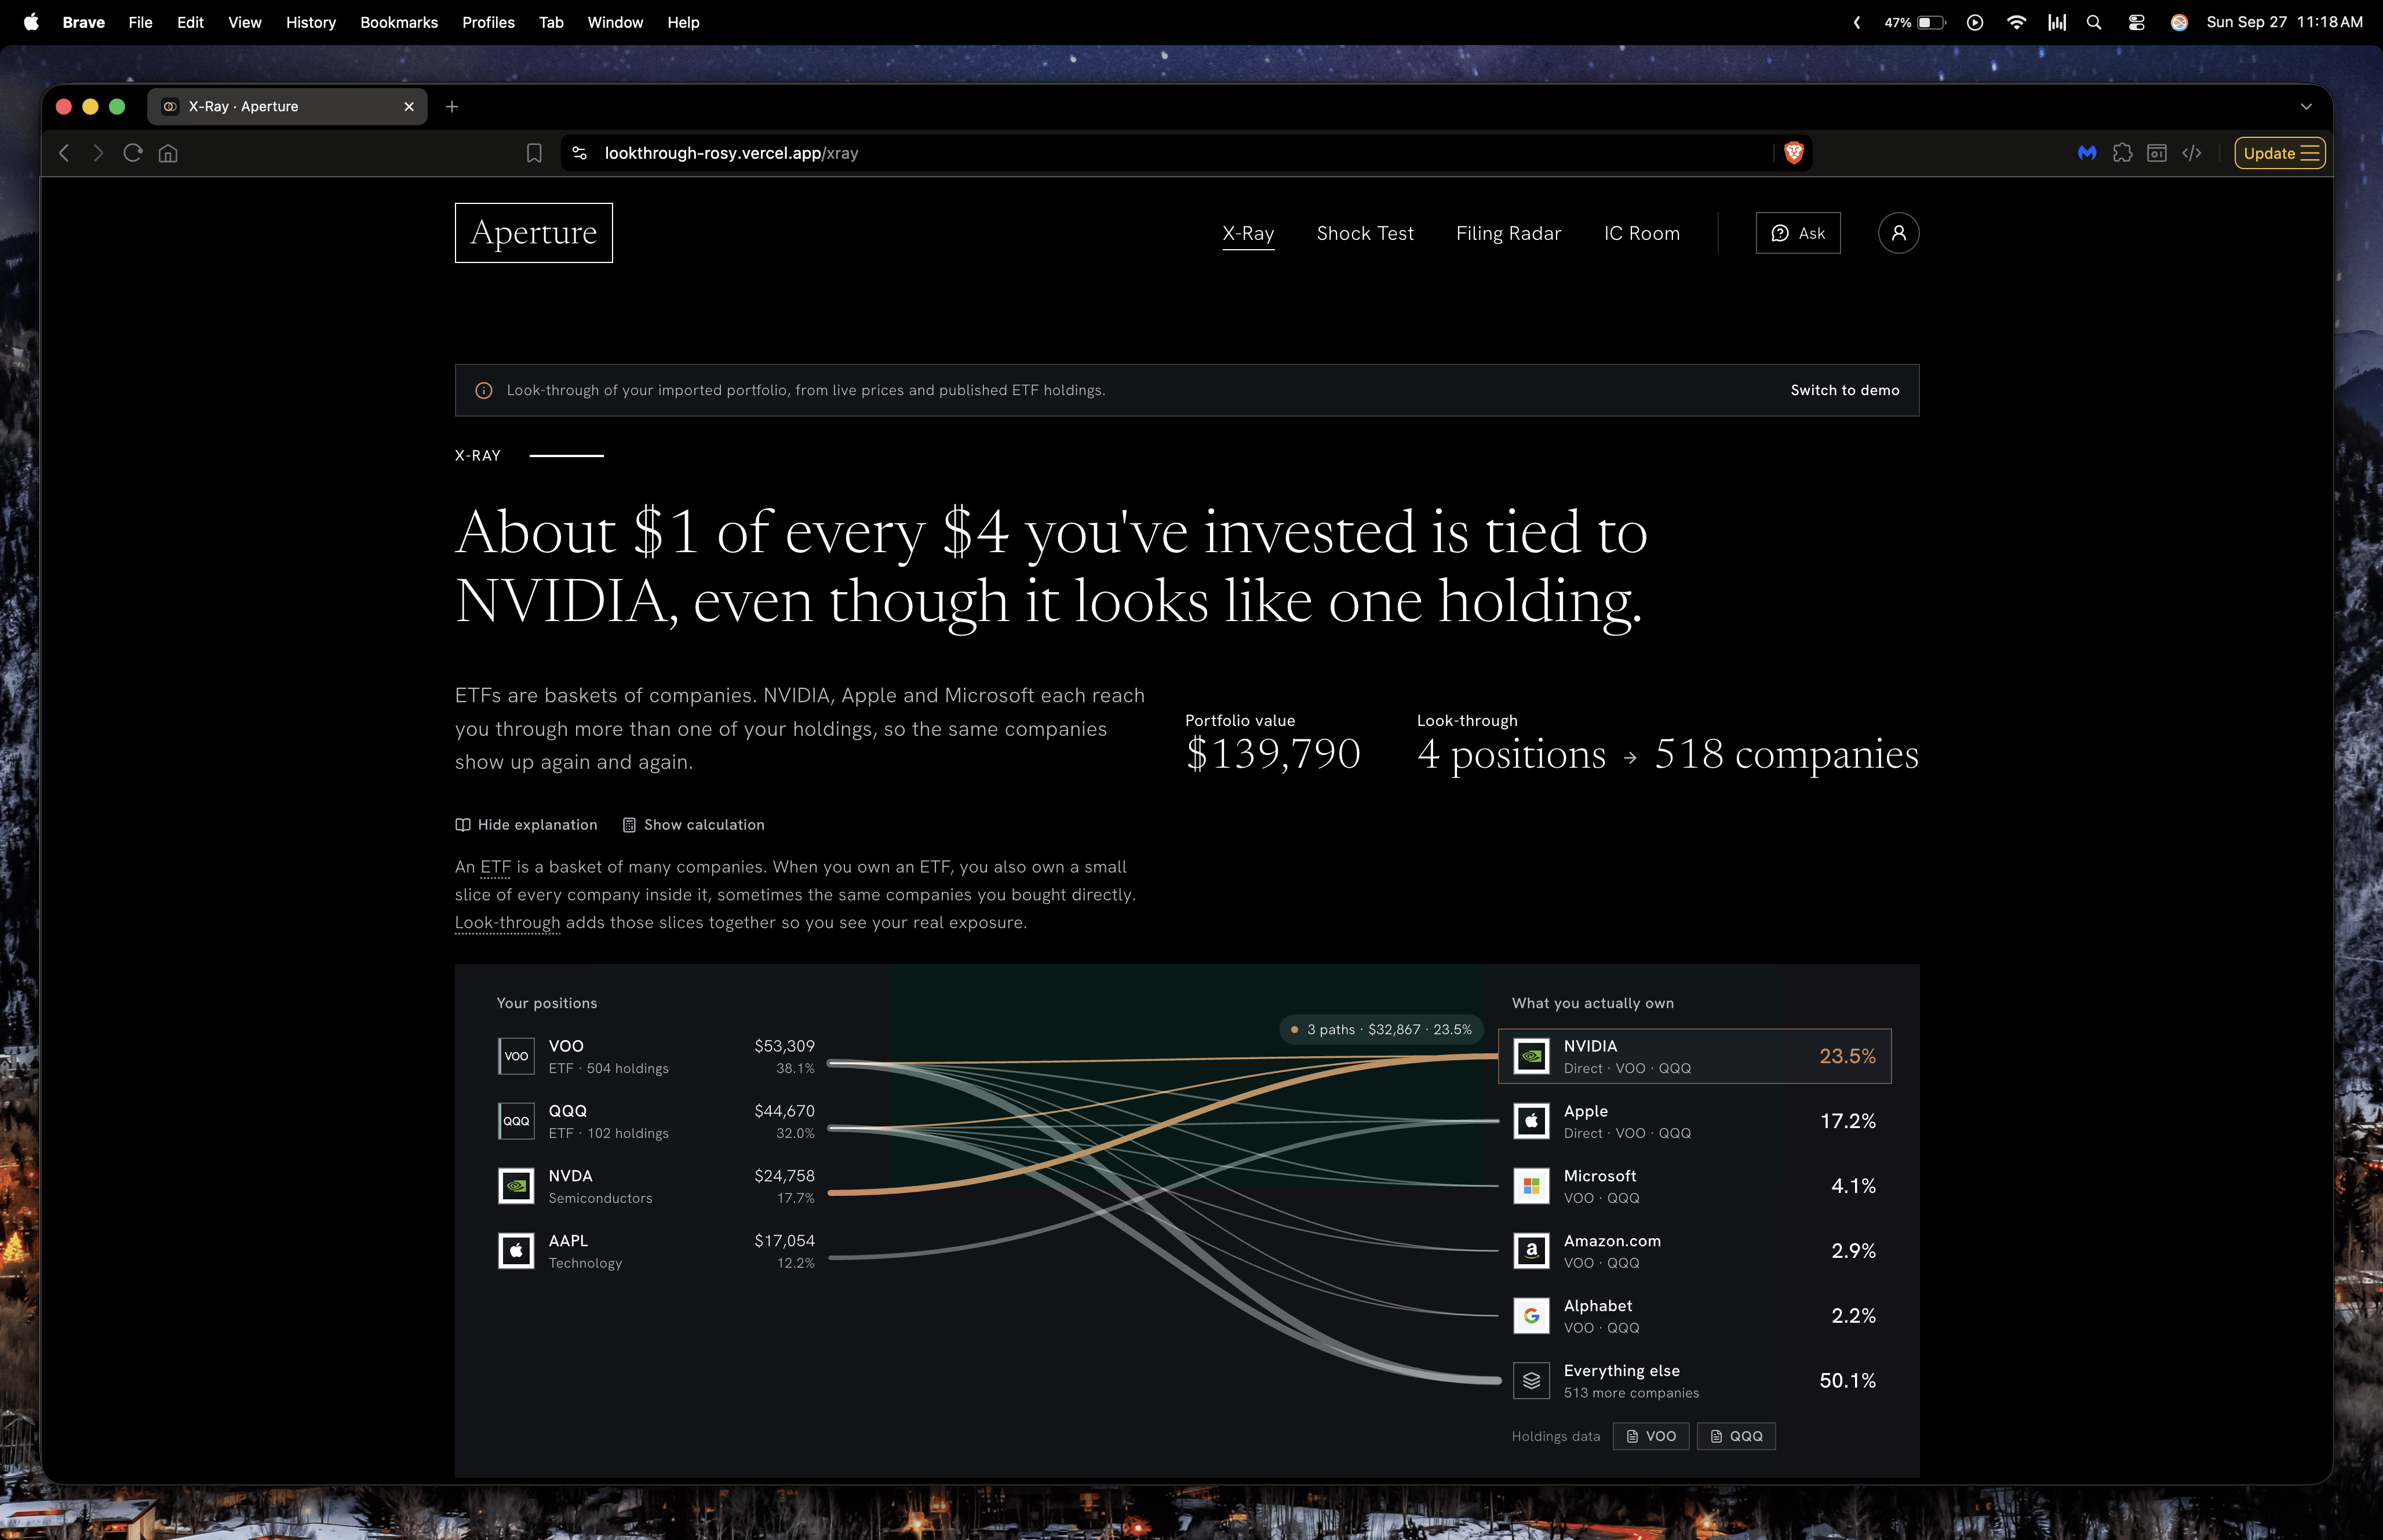
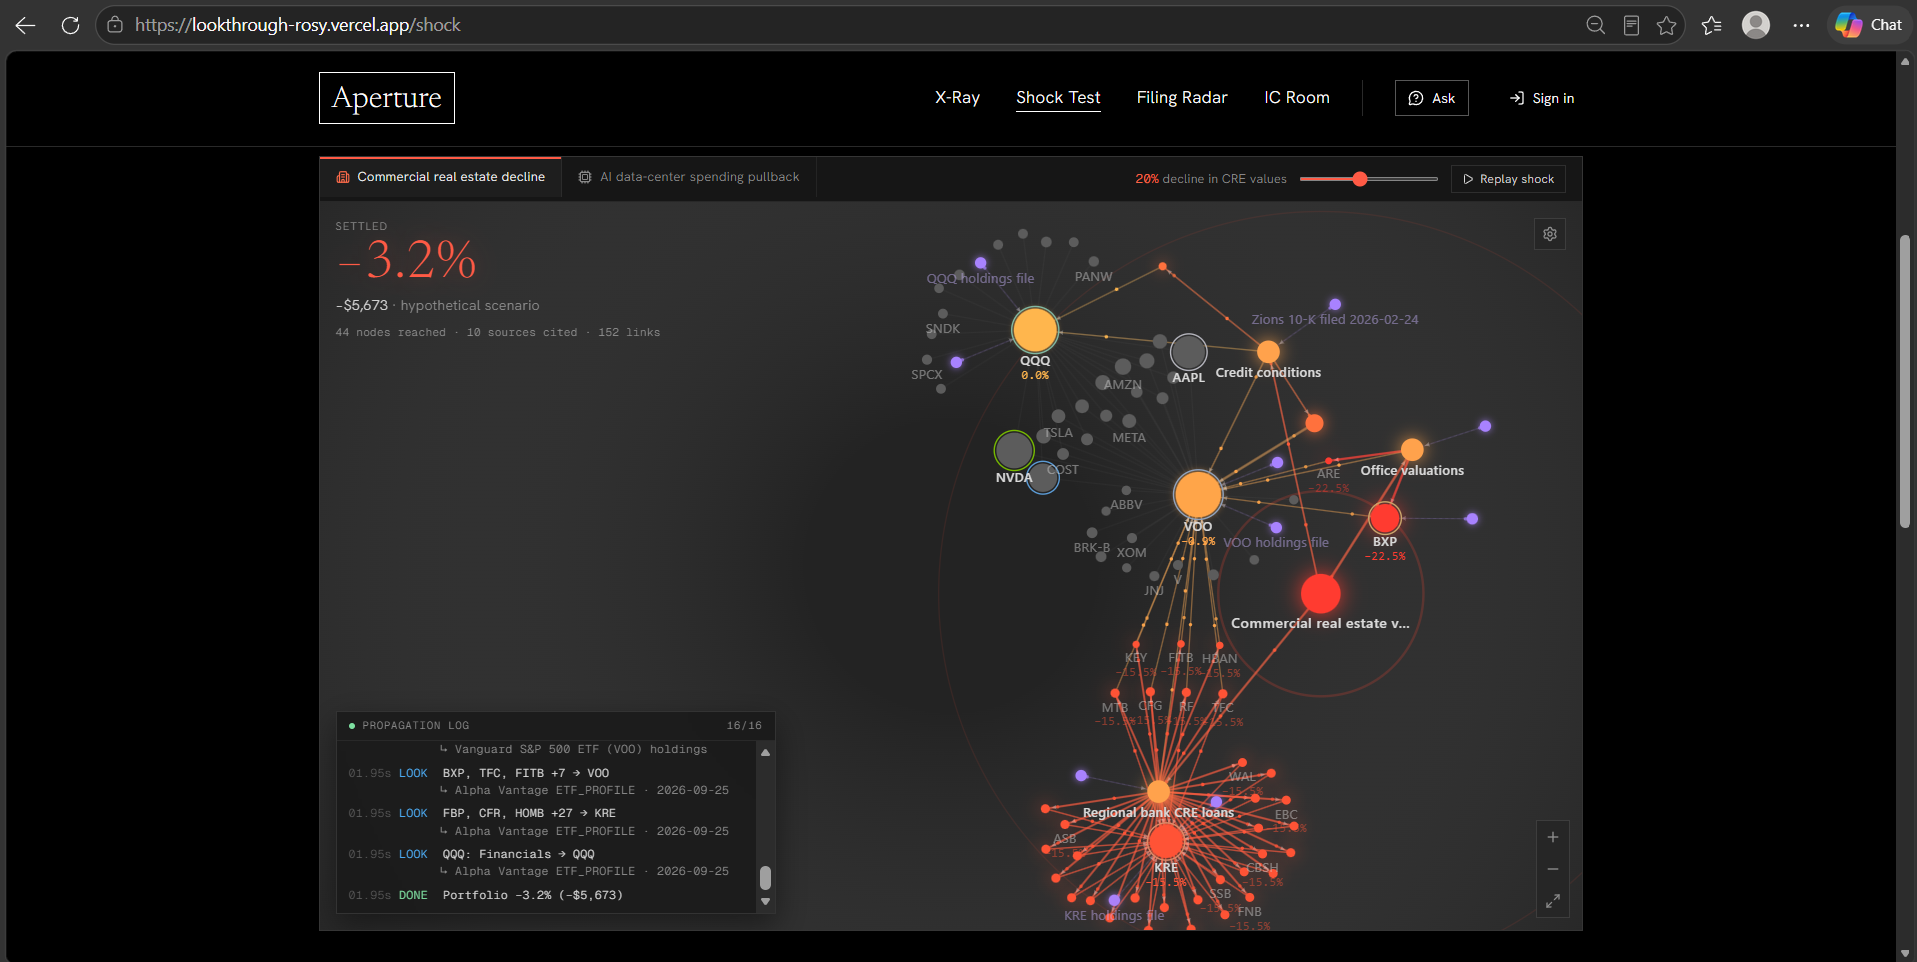
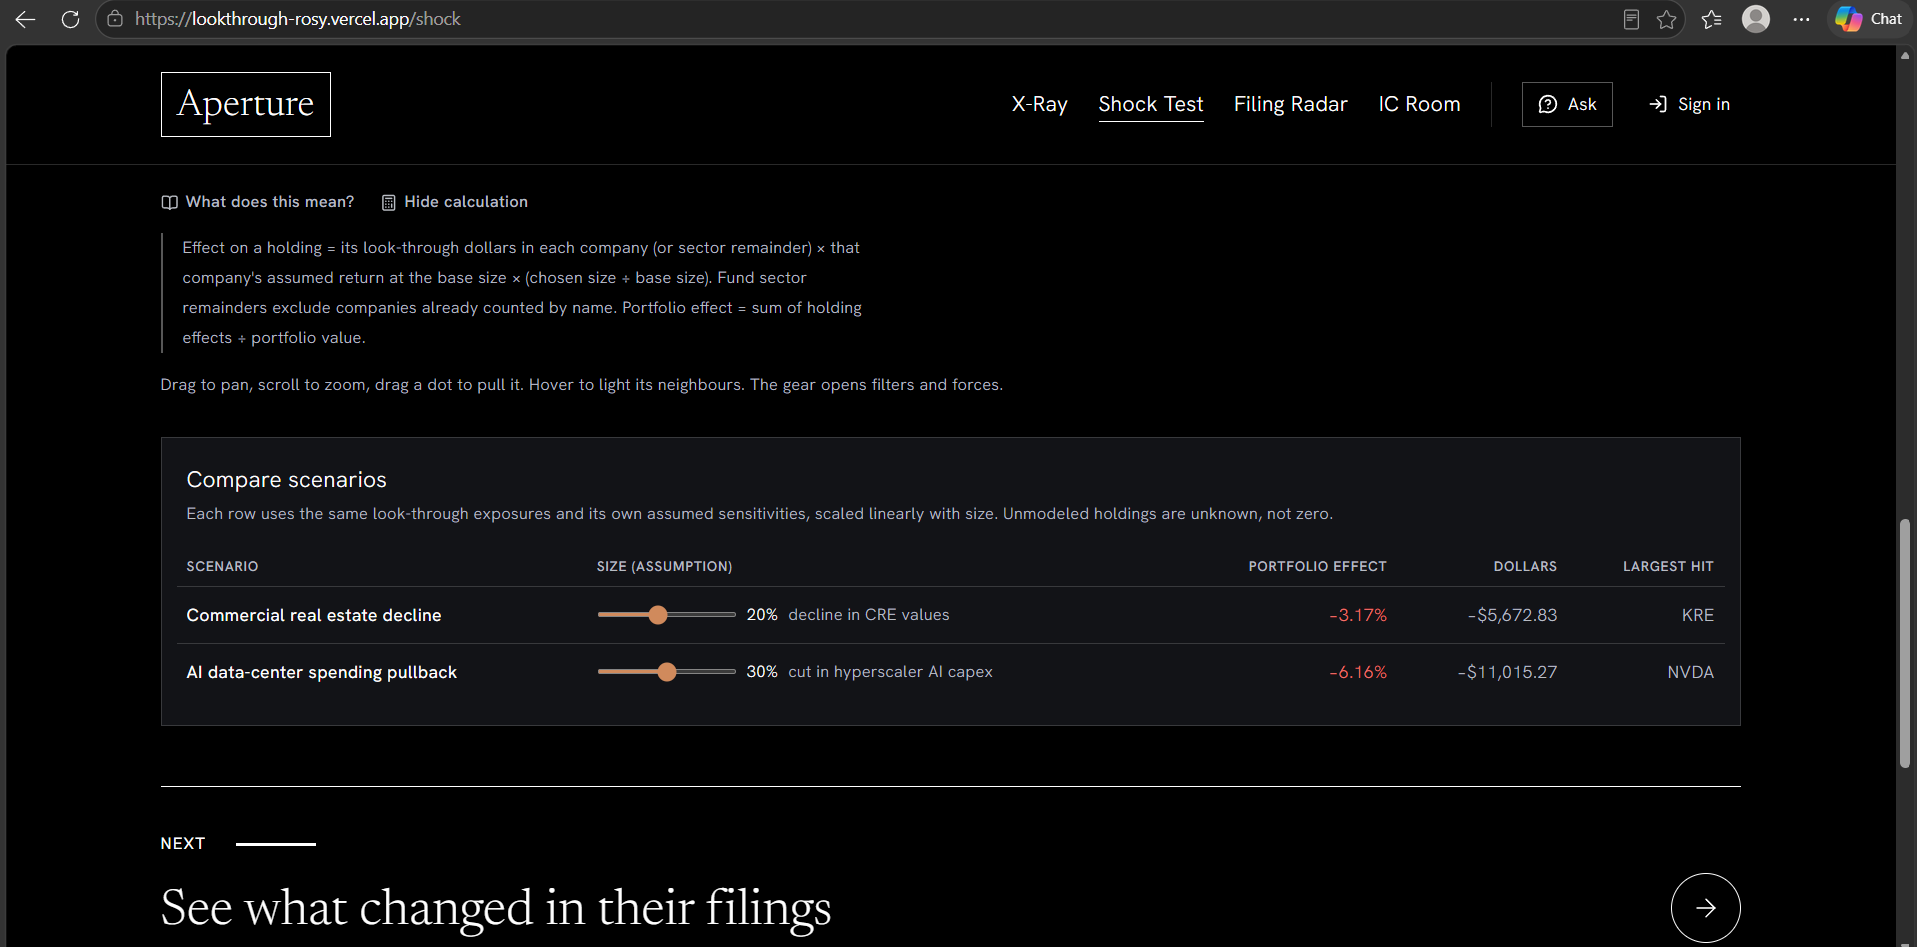
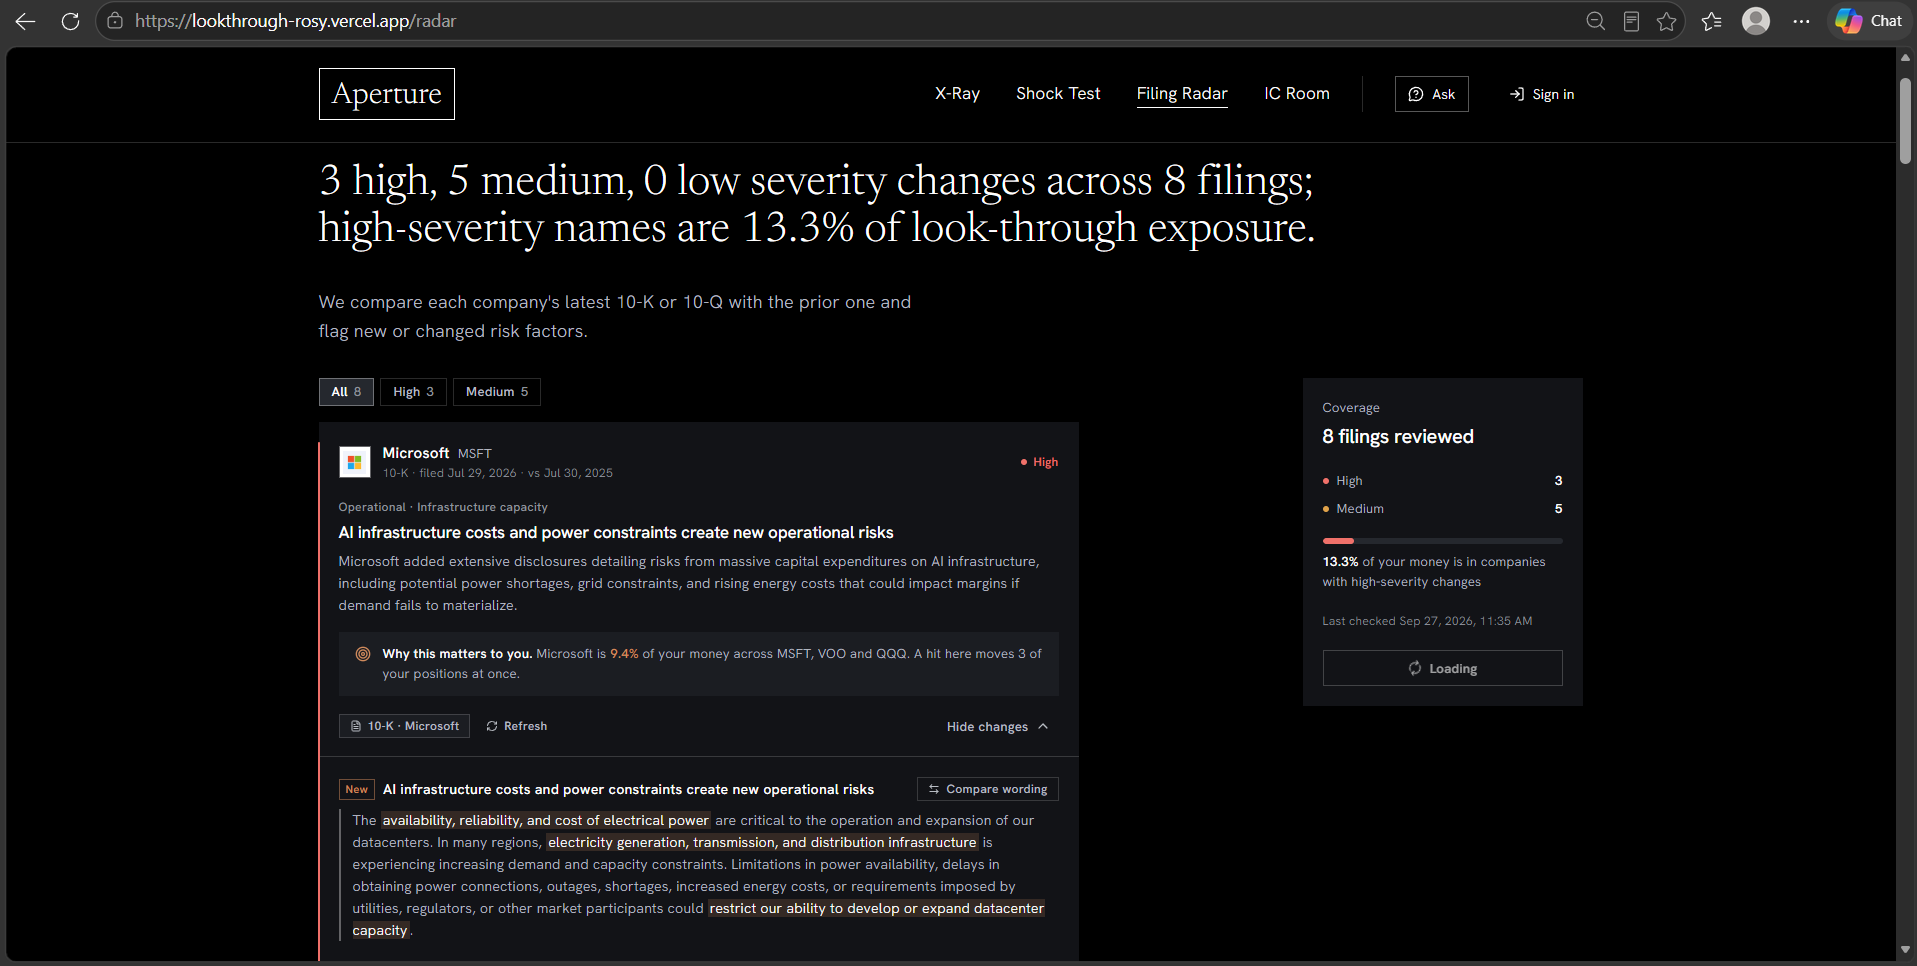
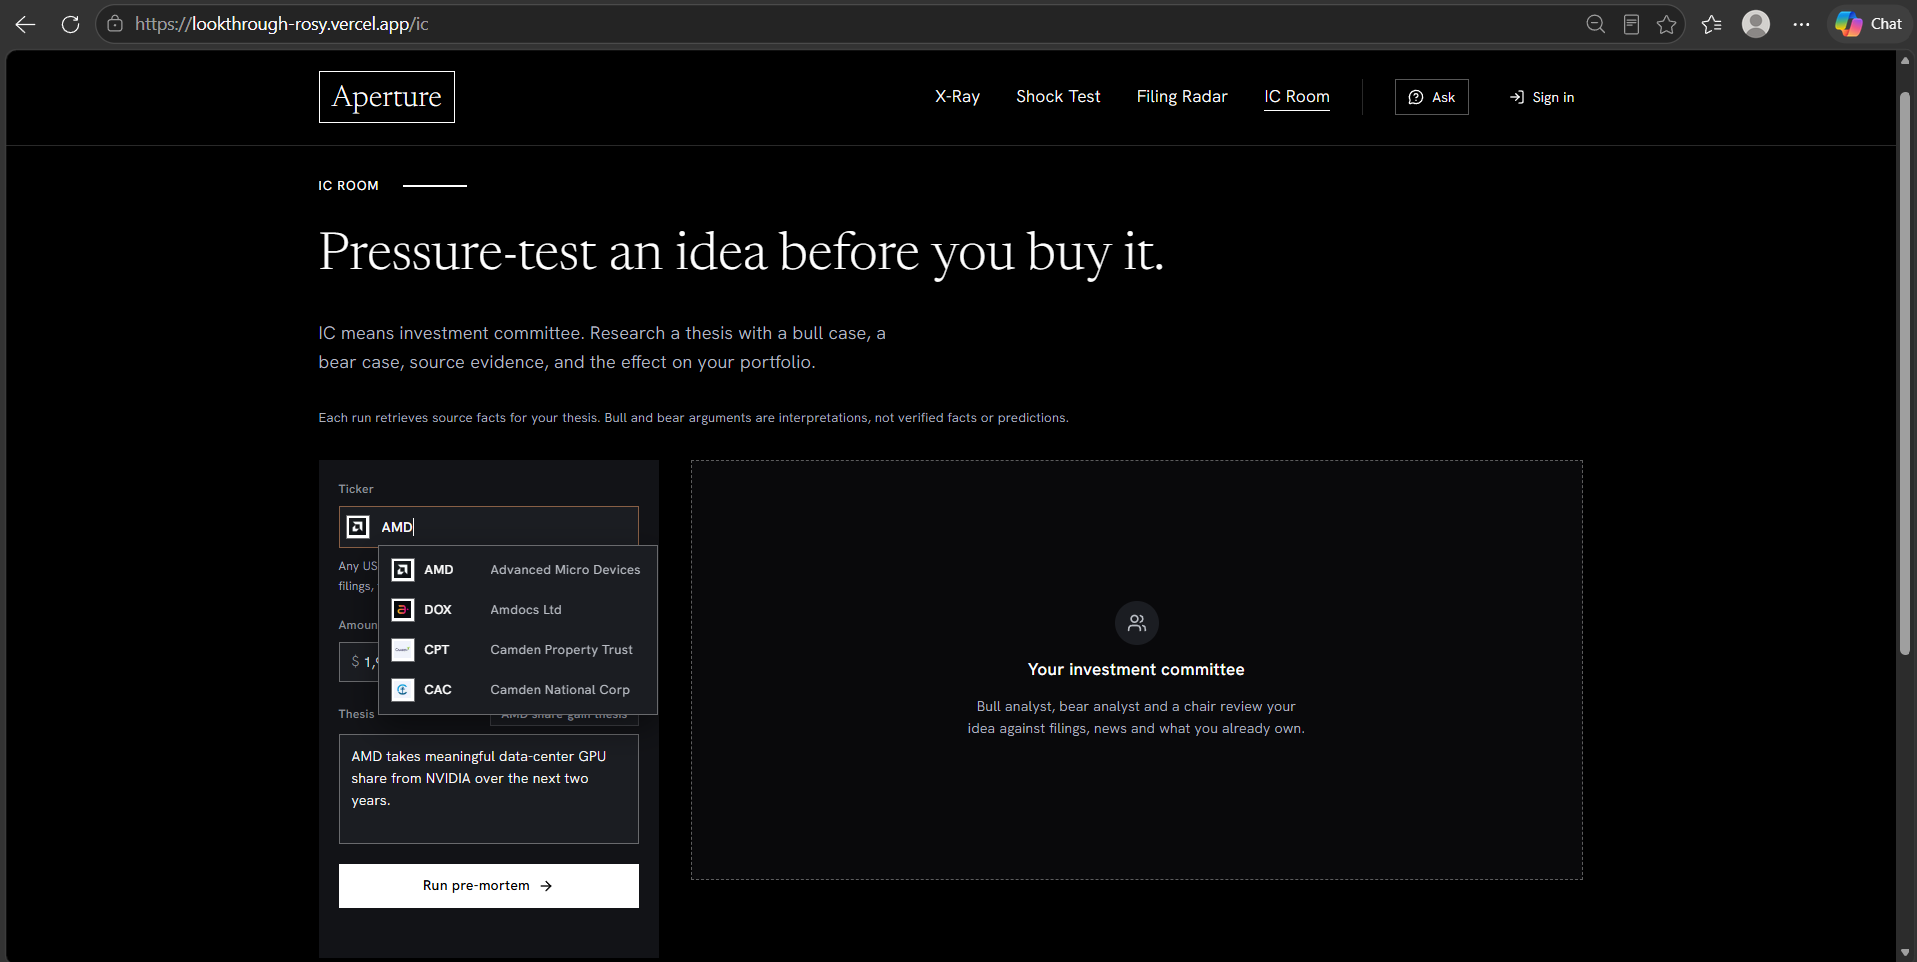
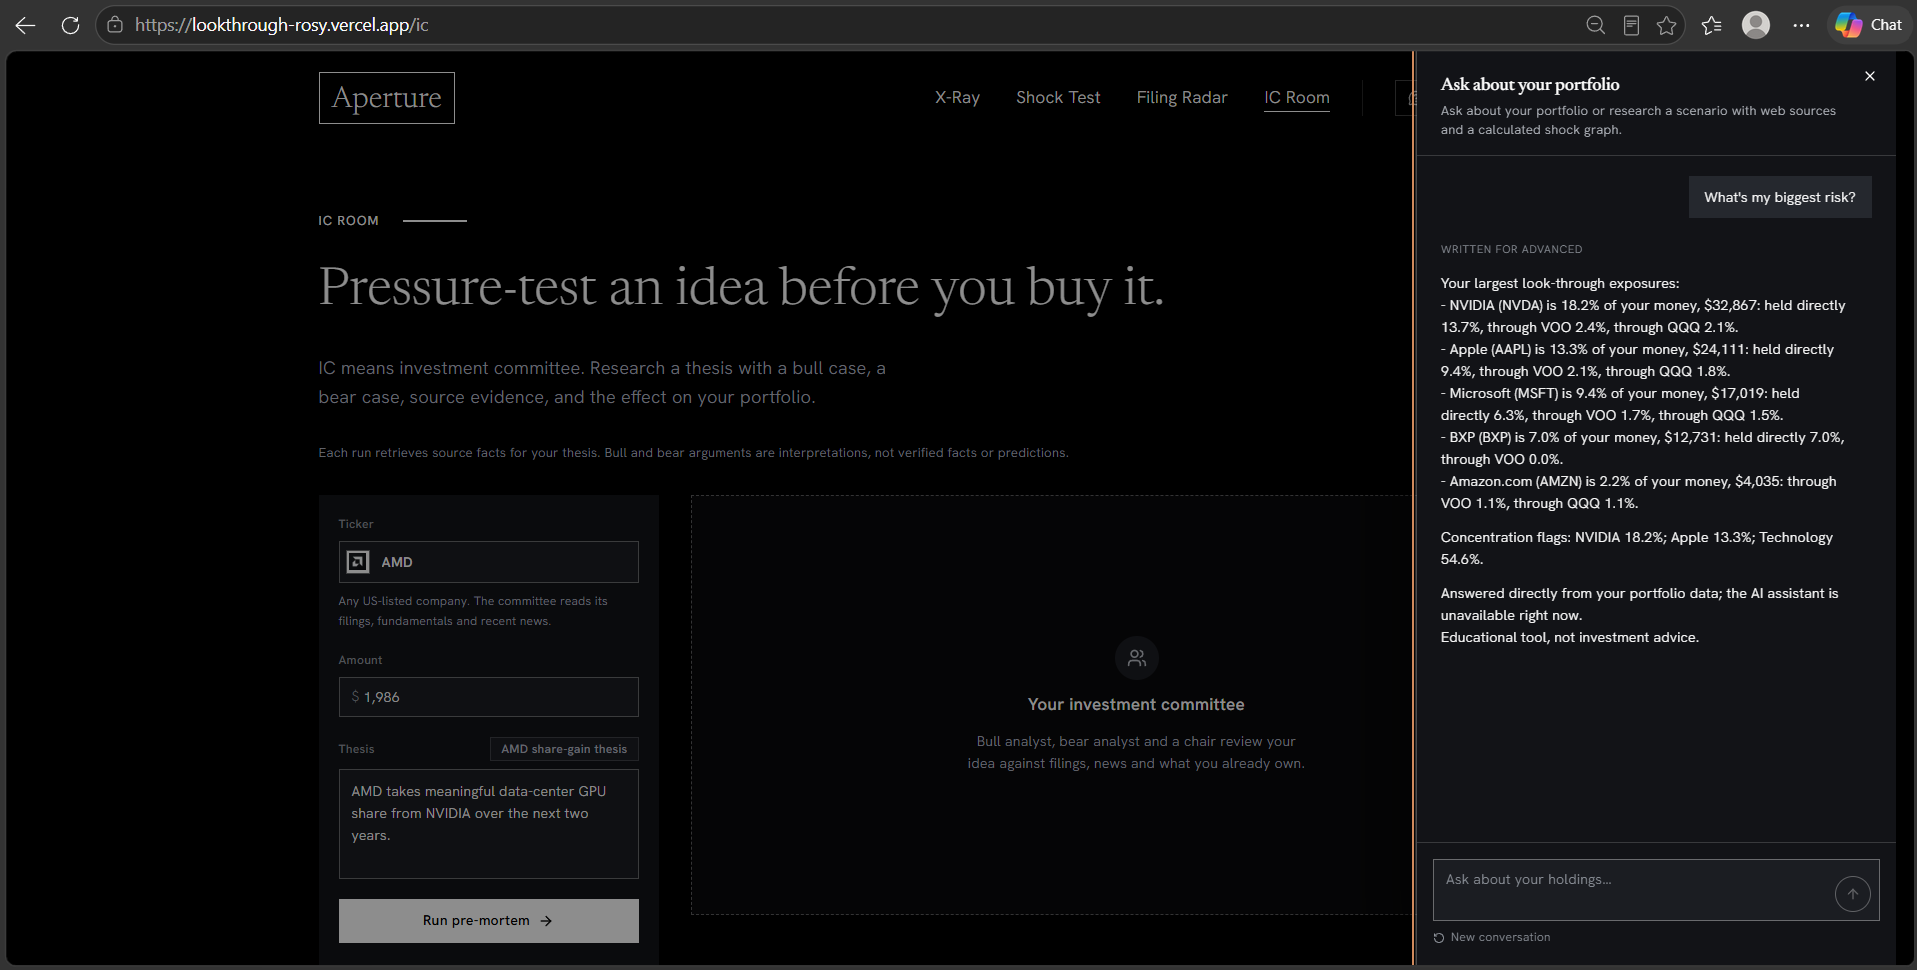
Aperture looks inside your ETFs to show which companies you actually own, and where different funds are "double dipping" into the same names. Shock Test lets you pick a news event, like an oil spike, a tariff change or commercial real estate stress, and shows how it spreads through linked companies to your holdings. Each step is backed by the companies' own SEC filings. Filing Radar and IC Room help you research what to do next.

How we built it

The numbers come from simple, repeatable math on real stock prices from Finnhub and published fund holdings, so the same portfolio always gives the same answer. AI explains the results and reads portfolio screenshots, but it never makes up the numbers. Evidence comes directly from SEC filings like 10-Ks.

Challenges we ran into

Keeping one portfolio value consistent across every page was harder than we expected. Some funds don't publish their holdings, so we had to say so clearly instead of guessing. Keeping the AI honest meant making every claim point to a real source.

Accomplishments that we're proud of

Everyone we've demoed to reacts when Aperture shows that NVIDIA isn't one position but three. We're also proud that you can trace any shock from the headline to your own funds and click through to the filing that supports each step.

What we learned

Making finance accessible is mostly about connecting information that already exists. People trust AI more when it shows its sources and admits what it doesn't know.

What's next for Aperture

We want to add direct brokerage connections, more fund types, and alerts when a new filing or market move affects something you own. We'd also like to extend look-through to private and alternative investments, the space Blackstone knows best.

Built With

  • alpha-vantage-api
  • base-ui
  • eslint
  • finnhub-api
  • geist
  • gemini-tts
  • google-gemini
  • google-oauth
  • google-search-grounding
  • lucide
  • motion
  • next.js
  • postgresql
  • react
  • recharts
  • sec-edgar-api
  • shadcn/ui
  • supabase
  • tailwind-css
  • tesseract.js
  • tsx
  • typescript
  • upstash-redis
  • zustand
+ 1 more
Share this project:

Updates

posted an update —

X-Ray now looks through your portfolio, not just the demo

X-Ray is the heart of Aperture: it looks through your ETFs to the companies inside them, so you can see what you actually own. Until this weekend it only knew one hand-built demo portfolio. Now it works on any portfolio you bring, with real prices and real fund holdings.

What's new

Live prices and company logos (Finnhub)

  • Your portfolio value and daily change update every minute from live quotes.
  • Every holding shows its real company logo and industry.
  • A new Holdings table lists each position with live price, day change, value and weight.
  • If Finnhub is unreachable, X-Ray quietly falls back to the last snapshot, so it never breaks.

Real look-through for any portfolio

  • 20 of the most popular US ETFs (VOO, SPY, QQQ, VTI, SCHD, SMH, VNQ, ARKK and more) are loaded with their full published holdings from Alpha Vantage. Any other ETF is fetched on demand.
  • X-Ray adds up every path to every company: shares you hold directly plus the slices inside each fund.
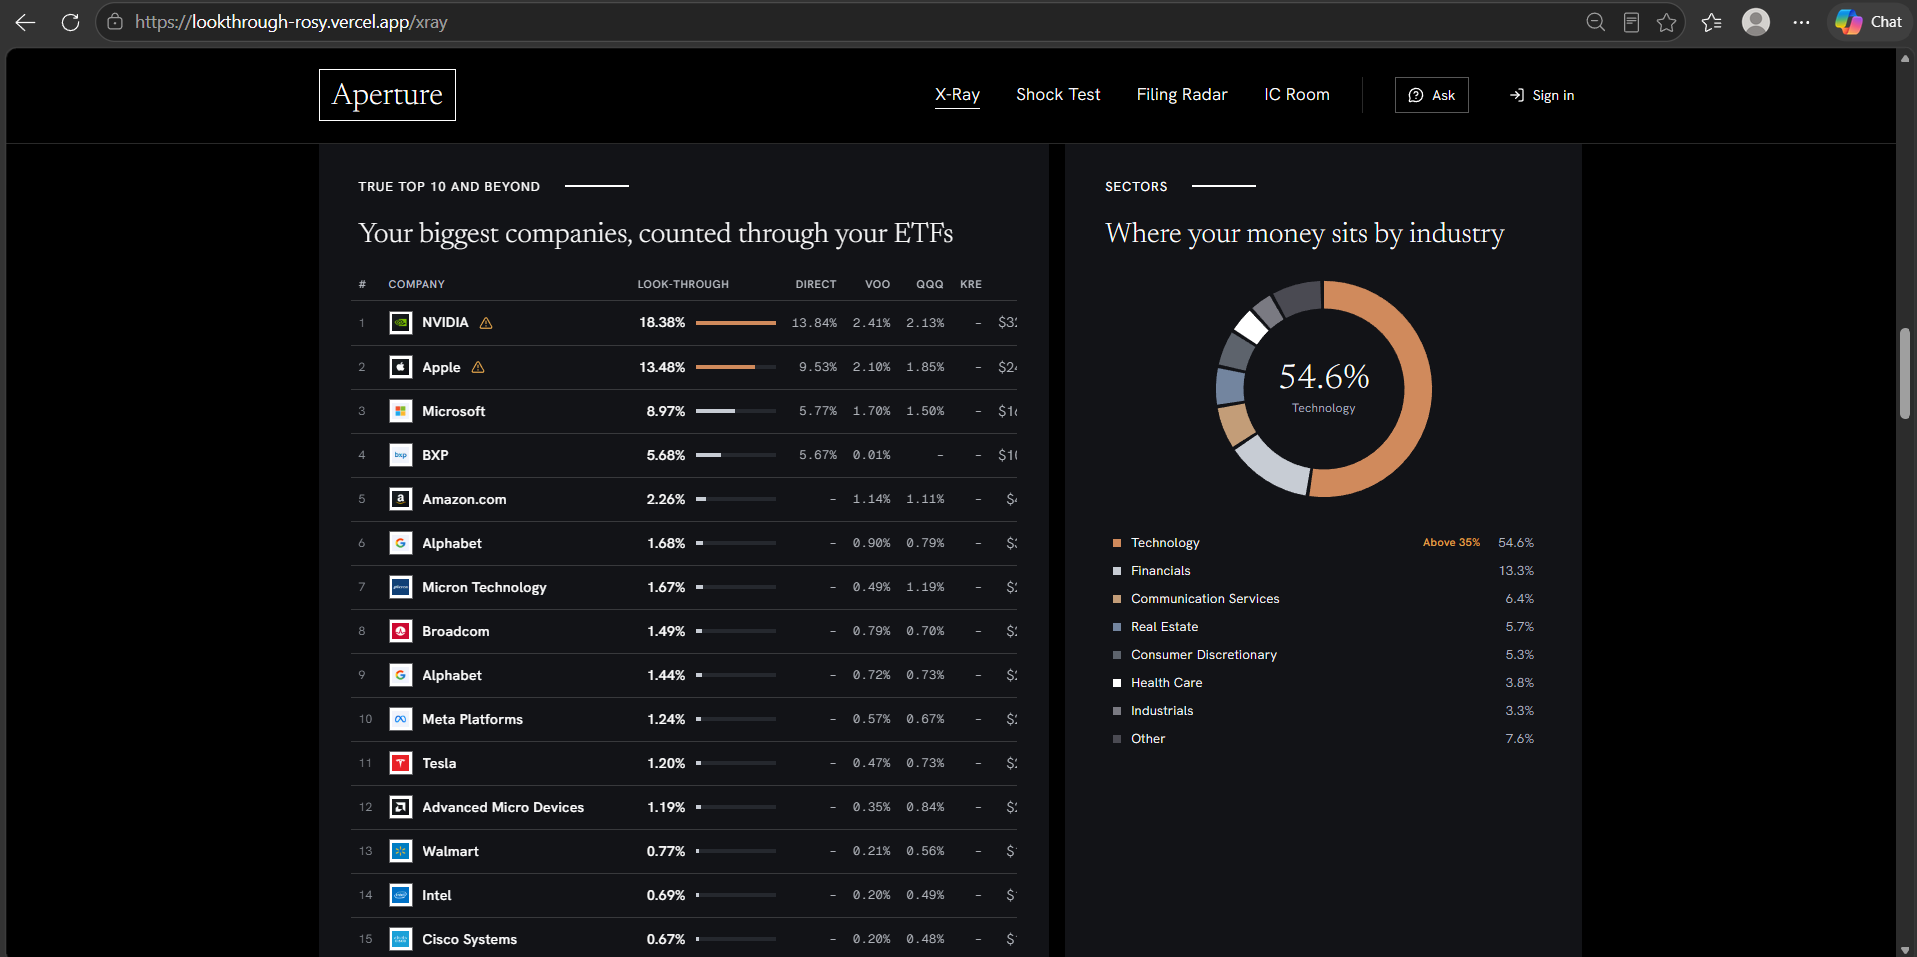
  • The whole page is computed from your numbers: the map, the True Top 10, sector breakdown, ETF overlap, concentration flags, and the headline at all three experience levels.
  • Funds we can't see inside are named, so nothing is silently wrong.

Switch between the demo and your own portfolio from the masthead at any time, without losing either.

What it found

A 12-position test portfolio (VOO, QQQ, NVDA, AMZN, GOOGL, BRK.B, JPM, KO, SCHD, TSLA, META and one fake ticker):

NVIDIA isn't one position. It's three, and 18.0% of your money.

  • 11 positions open up into 571 underlying companies.
  • VOO and QQQ overlap 54% by weight (88 of QQQ's 102 companies are also in VOO).
  • Technology is 38.9% of look-through value, flagged against a 35% limit.
  • The fake ticker was caught at import and left out of the total.

How it stays trustworthy

The math is plain code, not AI. Every number comes from prices and fund holdings, and a test script checks the look-through against a portfolio calculated by hand:

// Direct shares count once; every fund adds its slice of each company it holds.
for (const h of etf.holdings) addExposure(h.ticker, h.name, fund.ticker, fundValue * h.weight);

// ETF overlap: the weight both funds share, company by company.
for (const h of b.holdings) {
  const w = weightsA.get(h.ticker);
  if (w !== undefined) overlap += Math.min(w, h.weight);
}

Also in this update

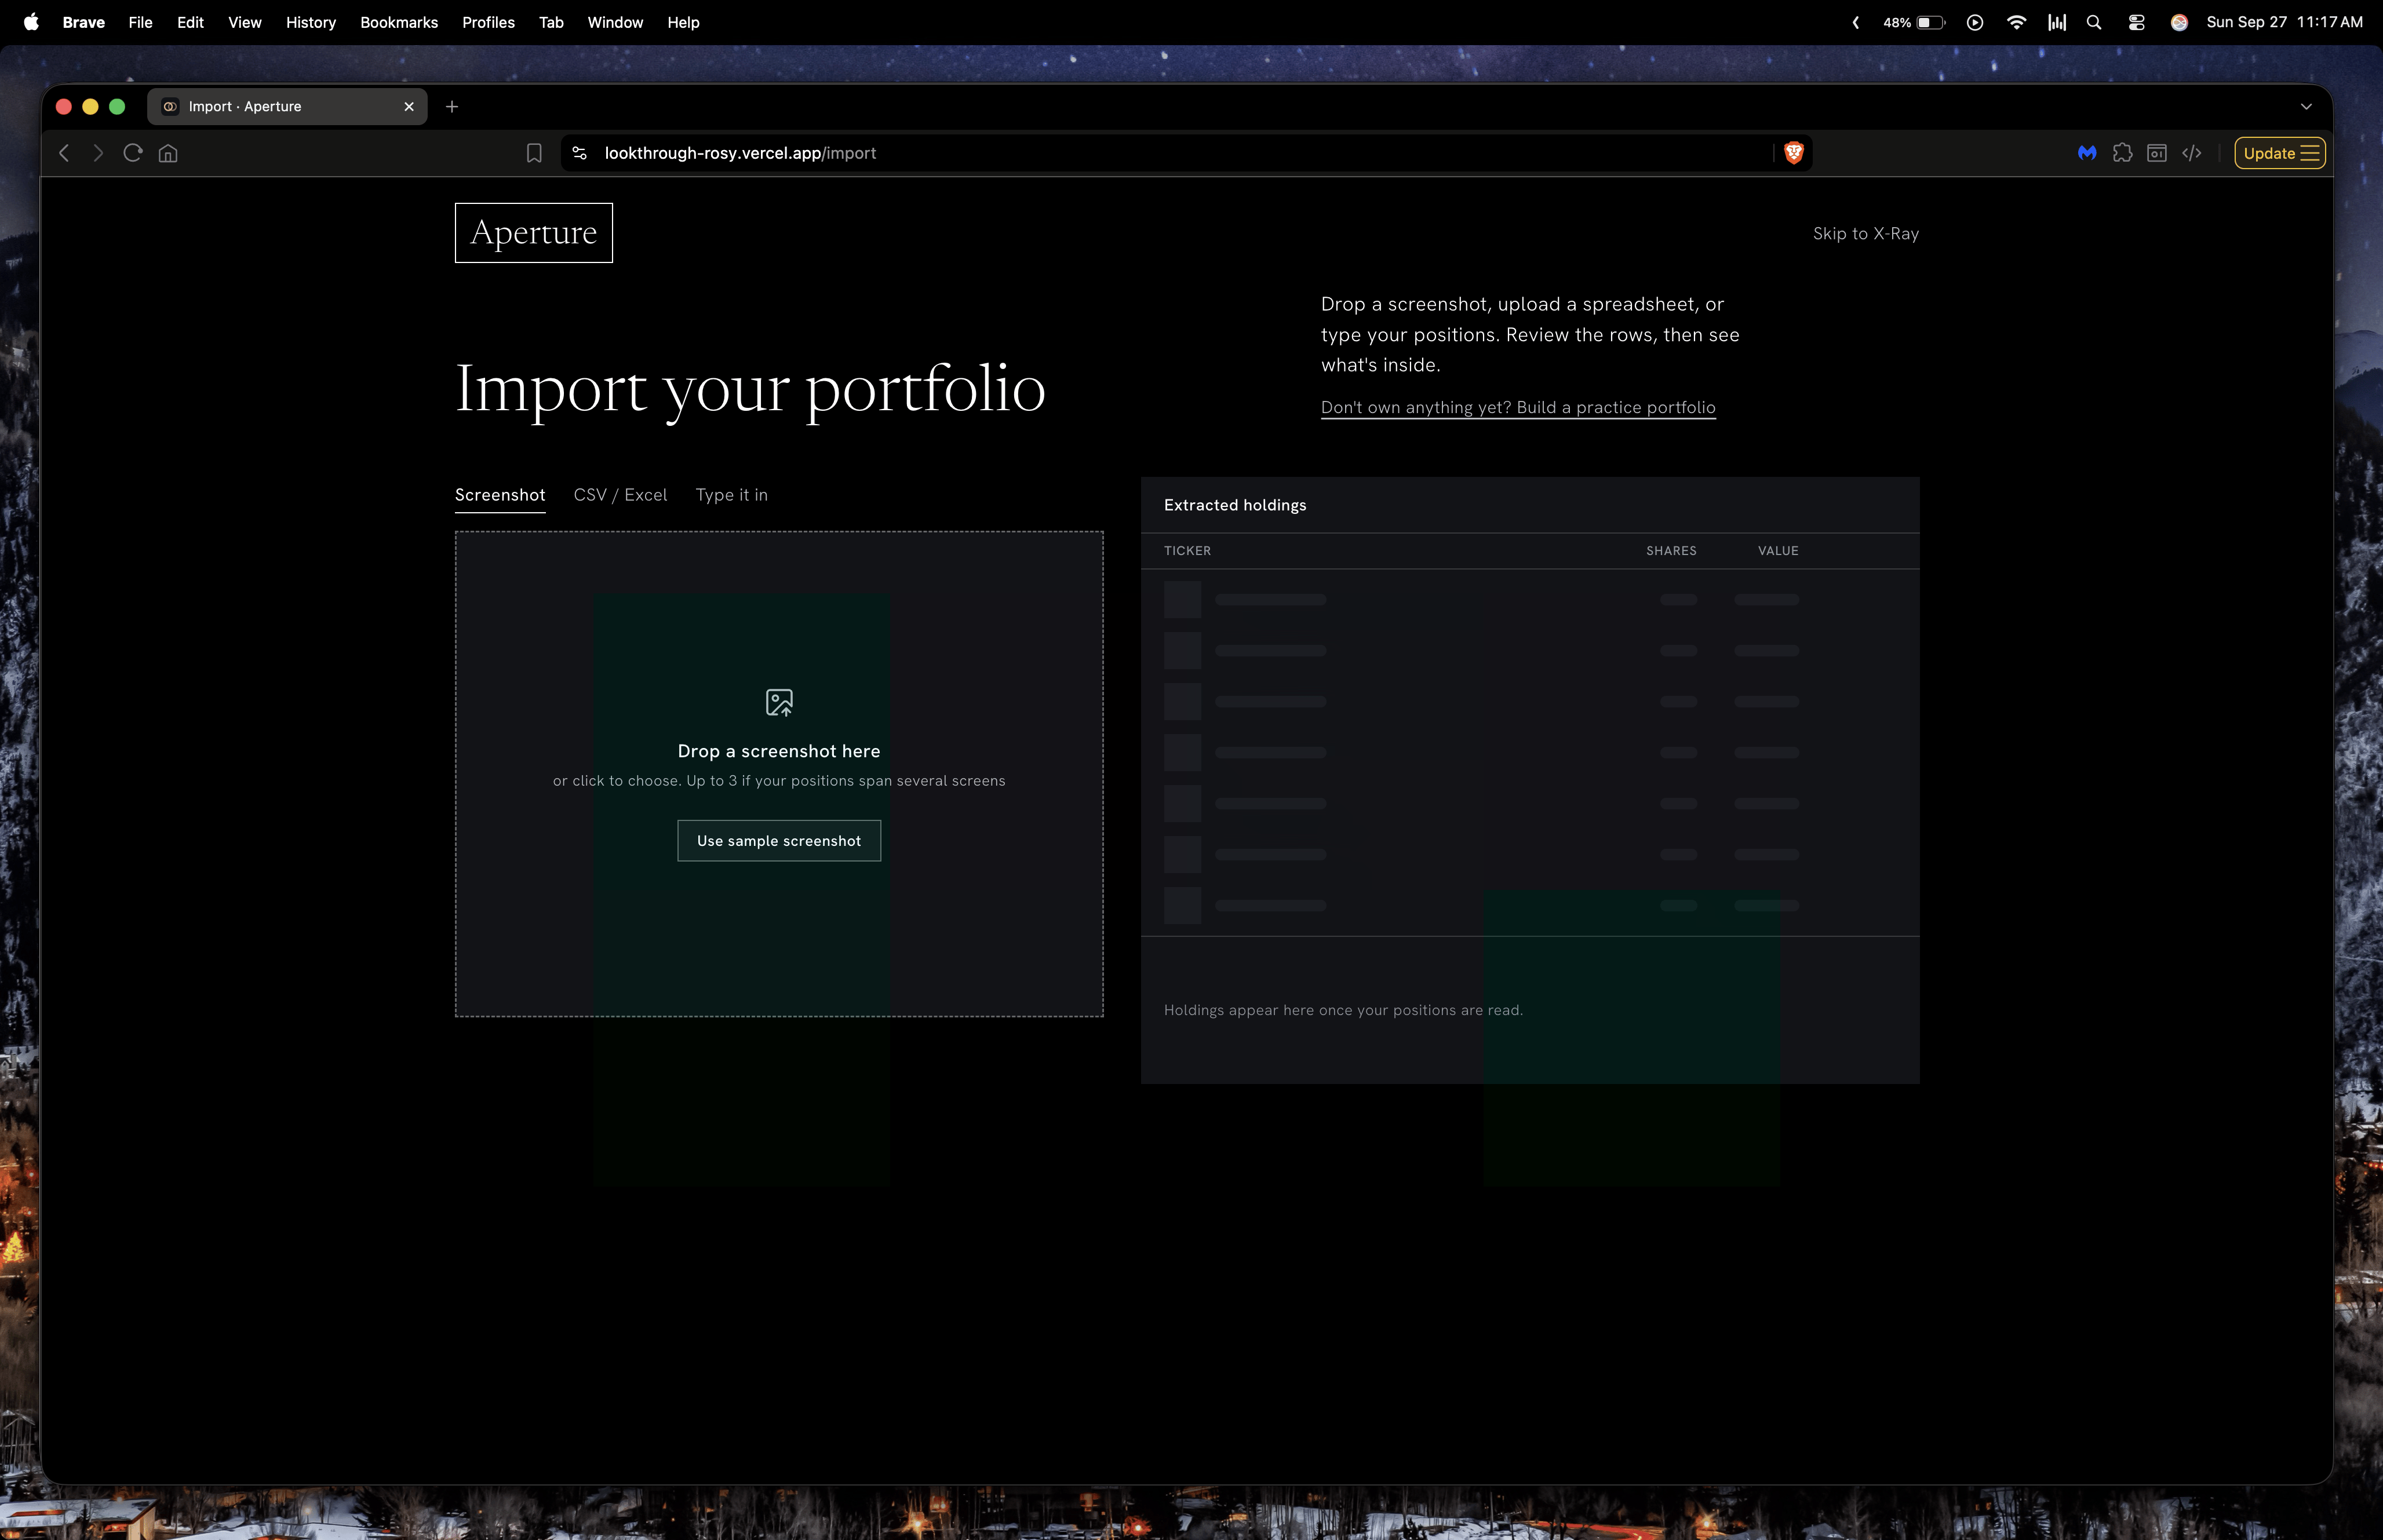
Bring your portfolio in any way you like: a brokerage screenshot (read by Gemini), your broker's CSV export, or type it in. If you don't own anything yet, build a practice portfolio with pretend money and real prices, and X-Ray looks through that too.

Log in or sign up for Devpost to join the conversation.

Submission history