-
-
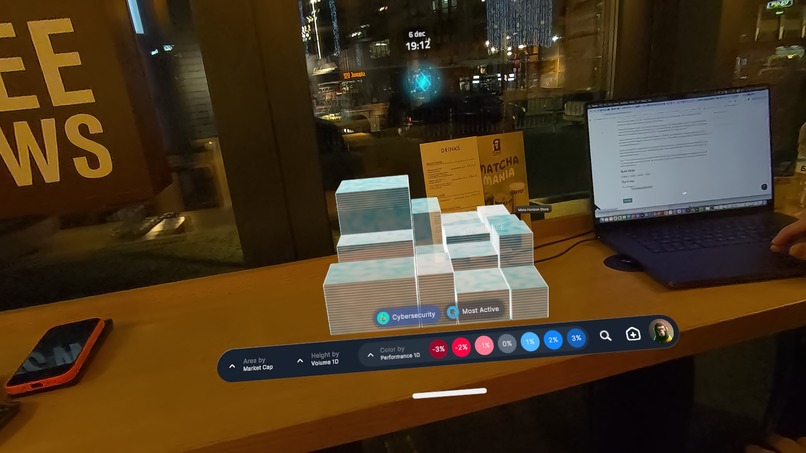
Loading holographic heatmap
-

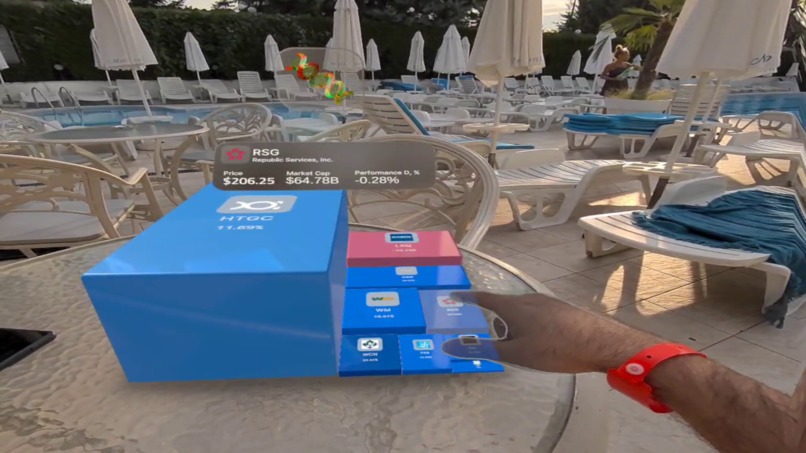
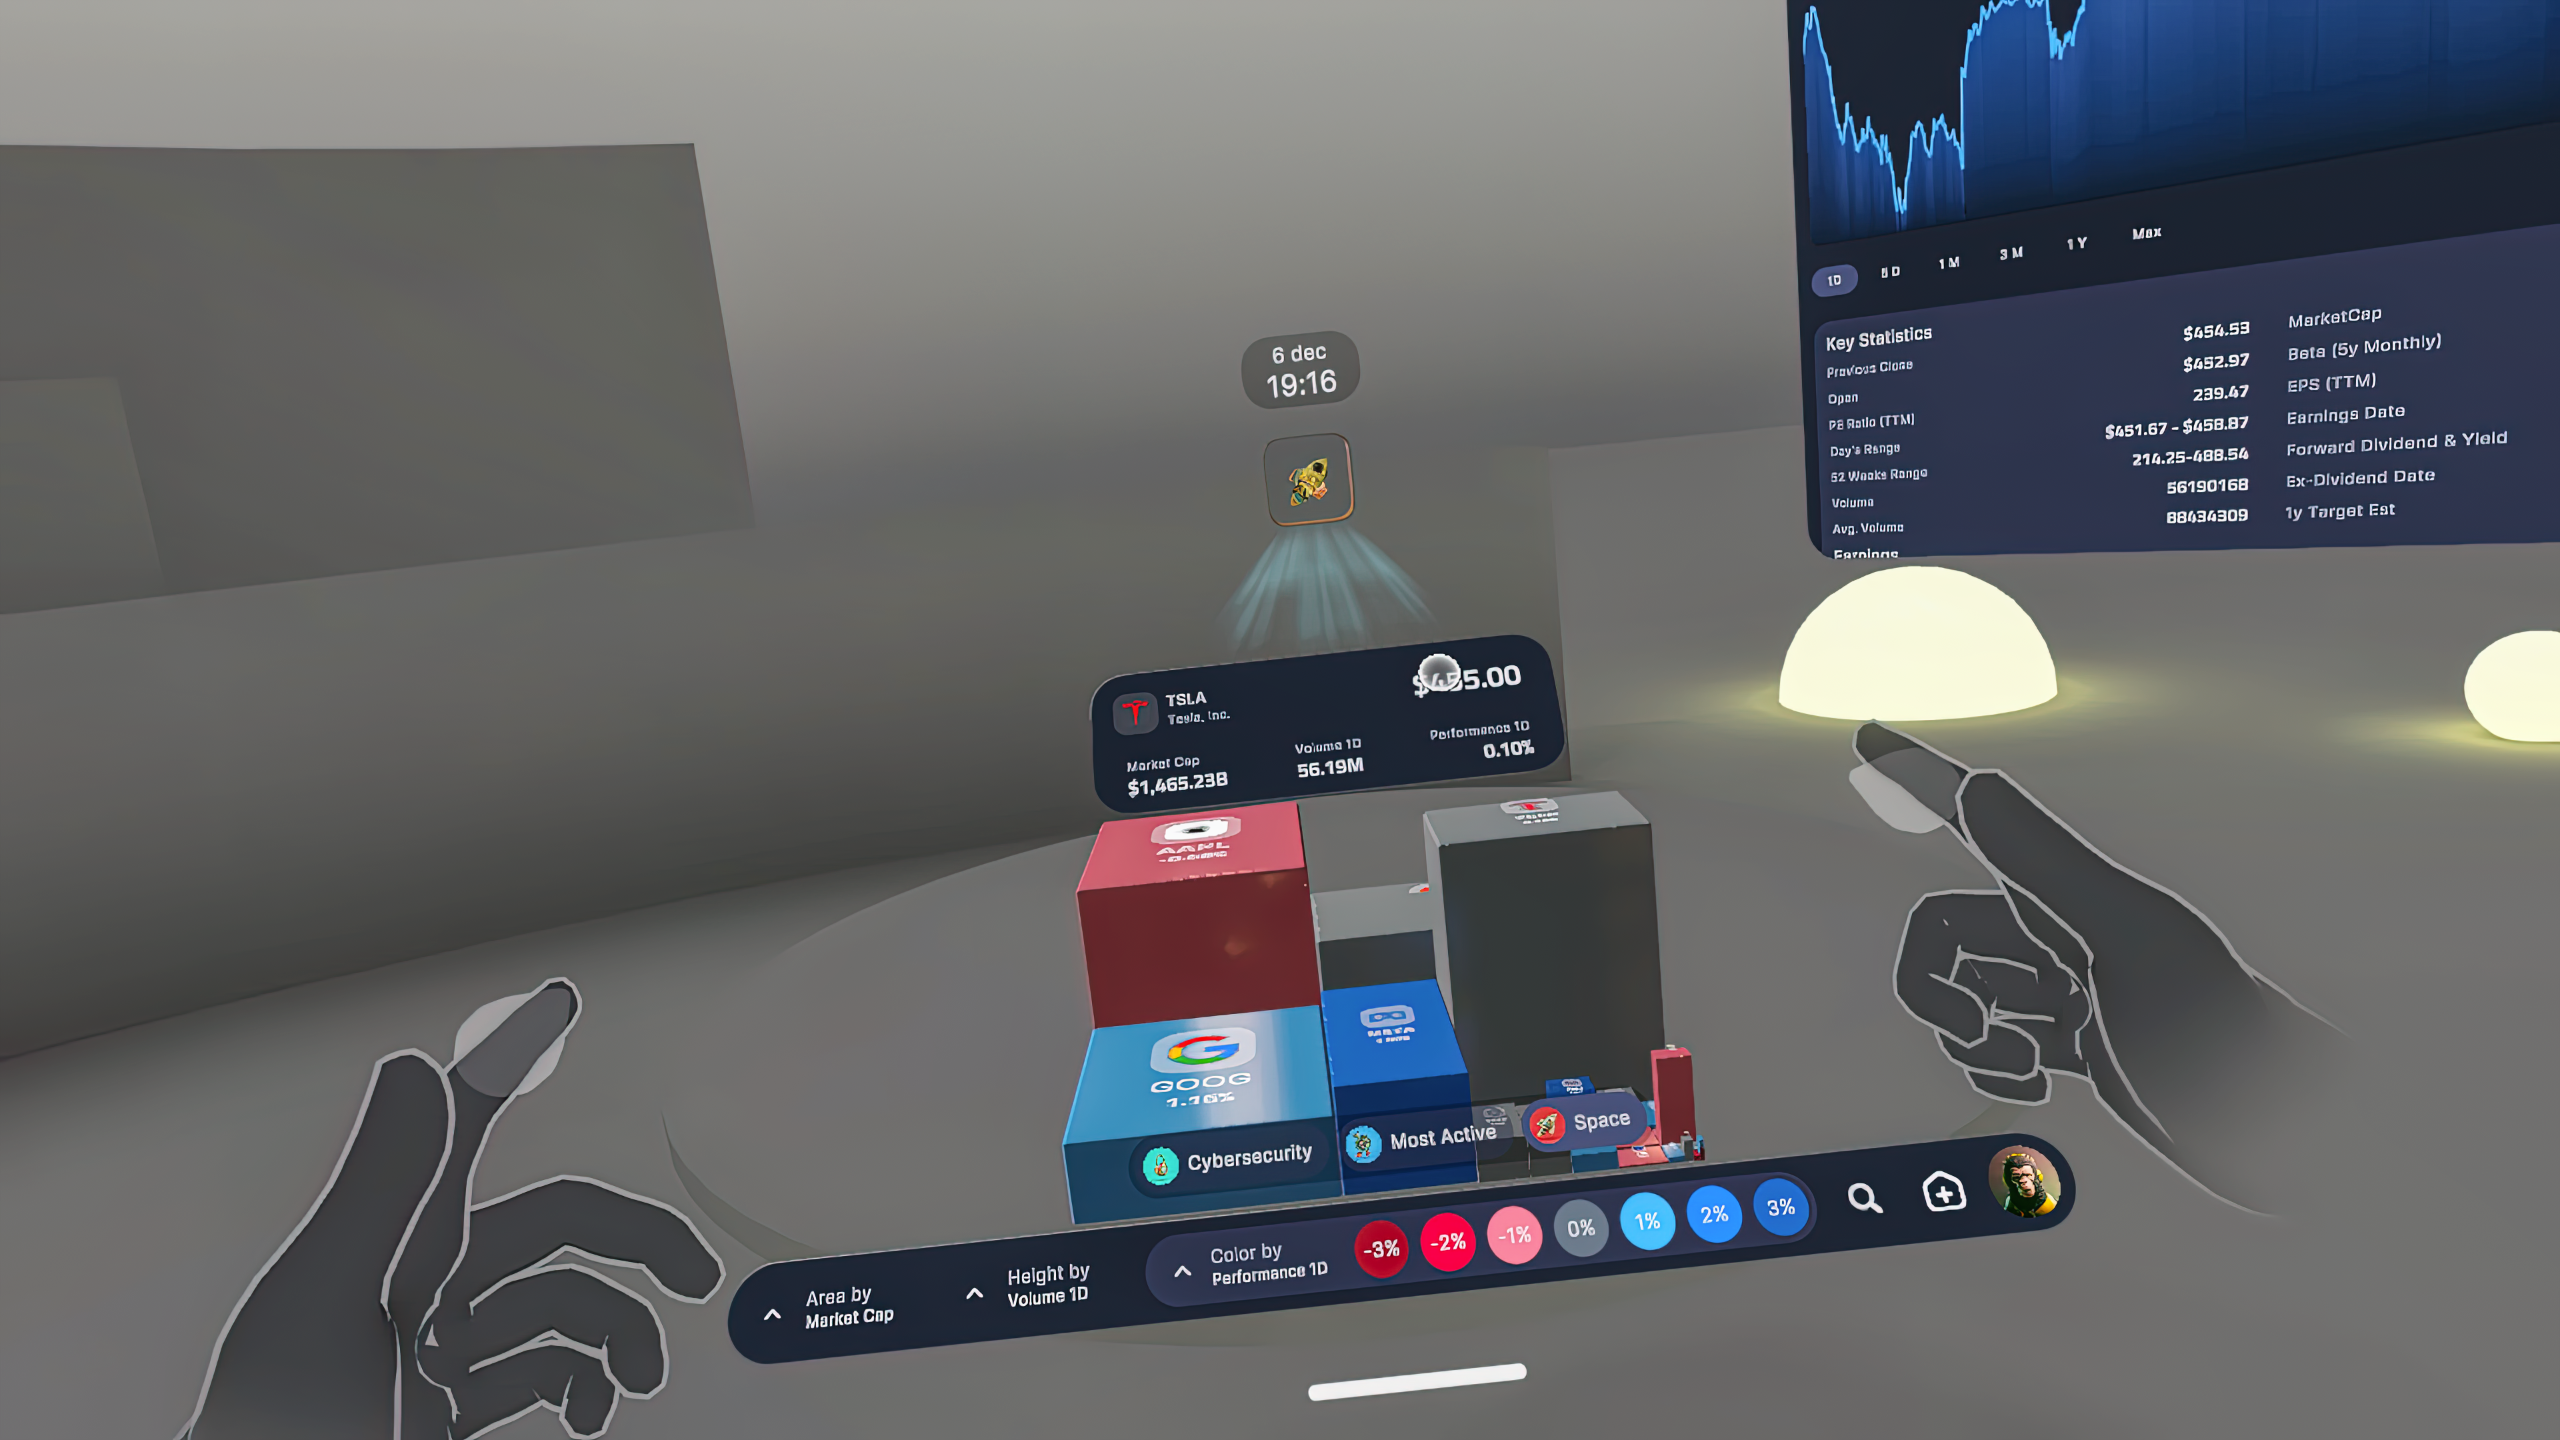
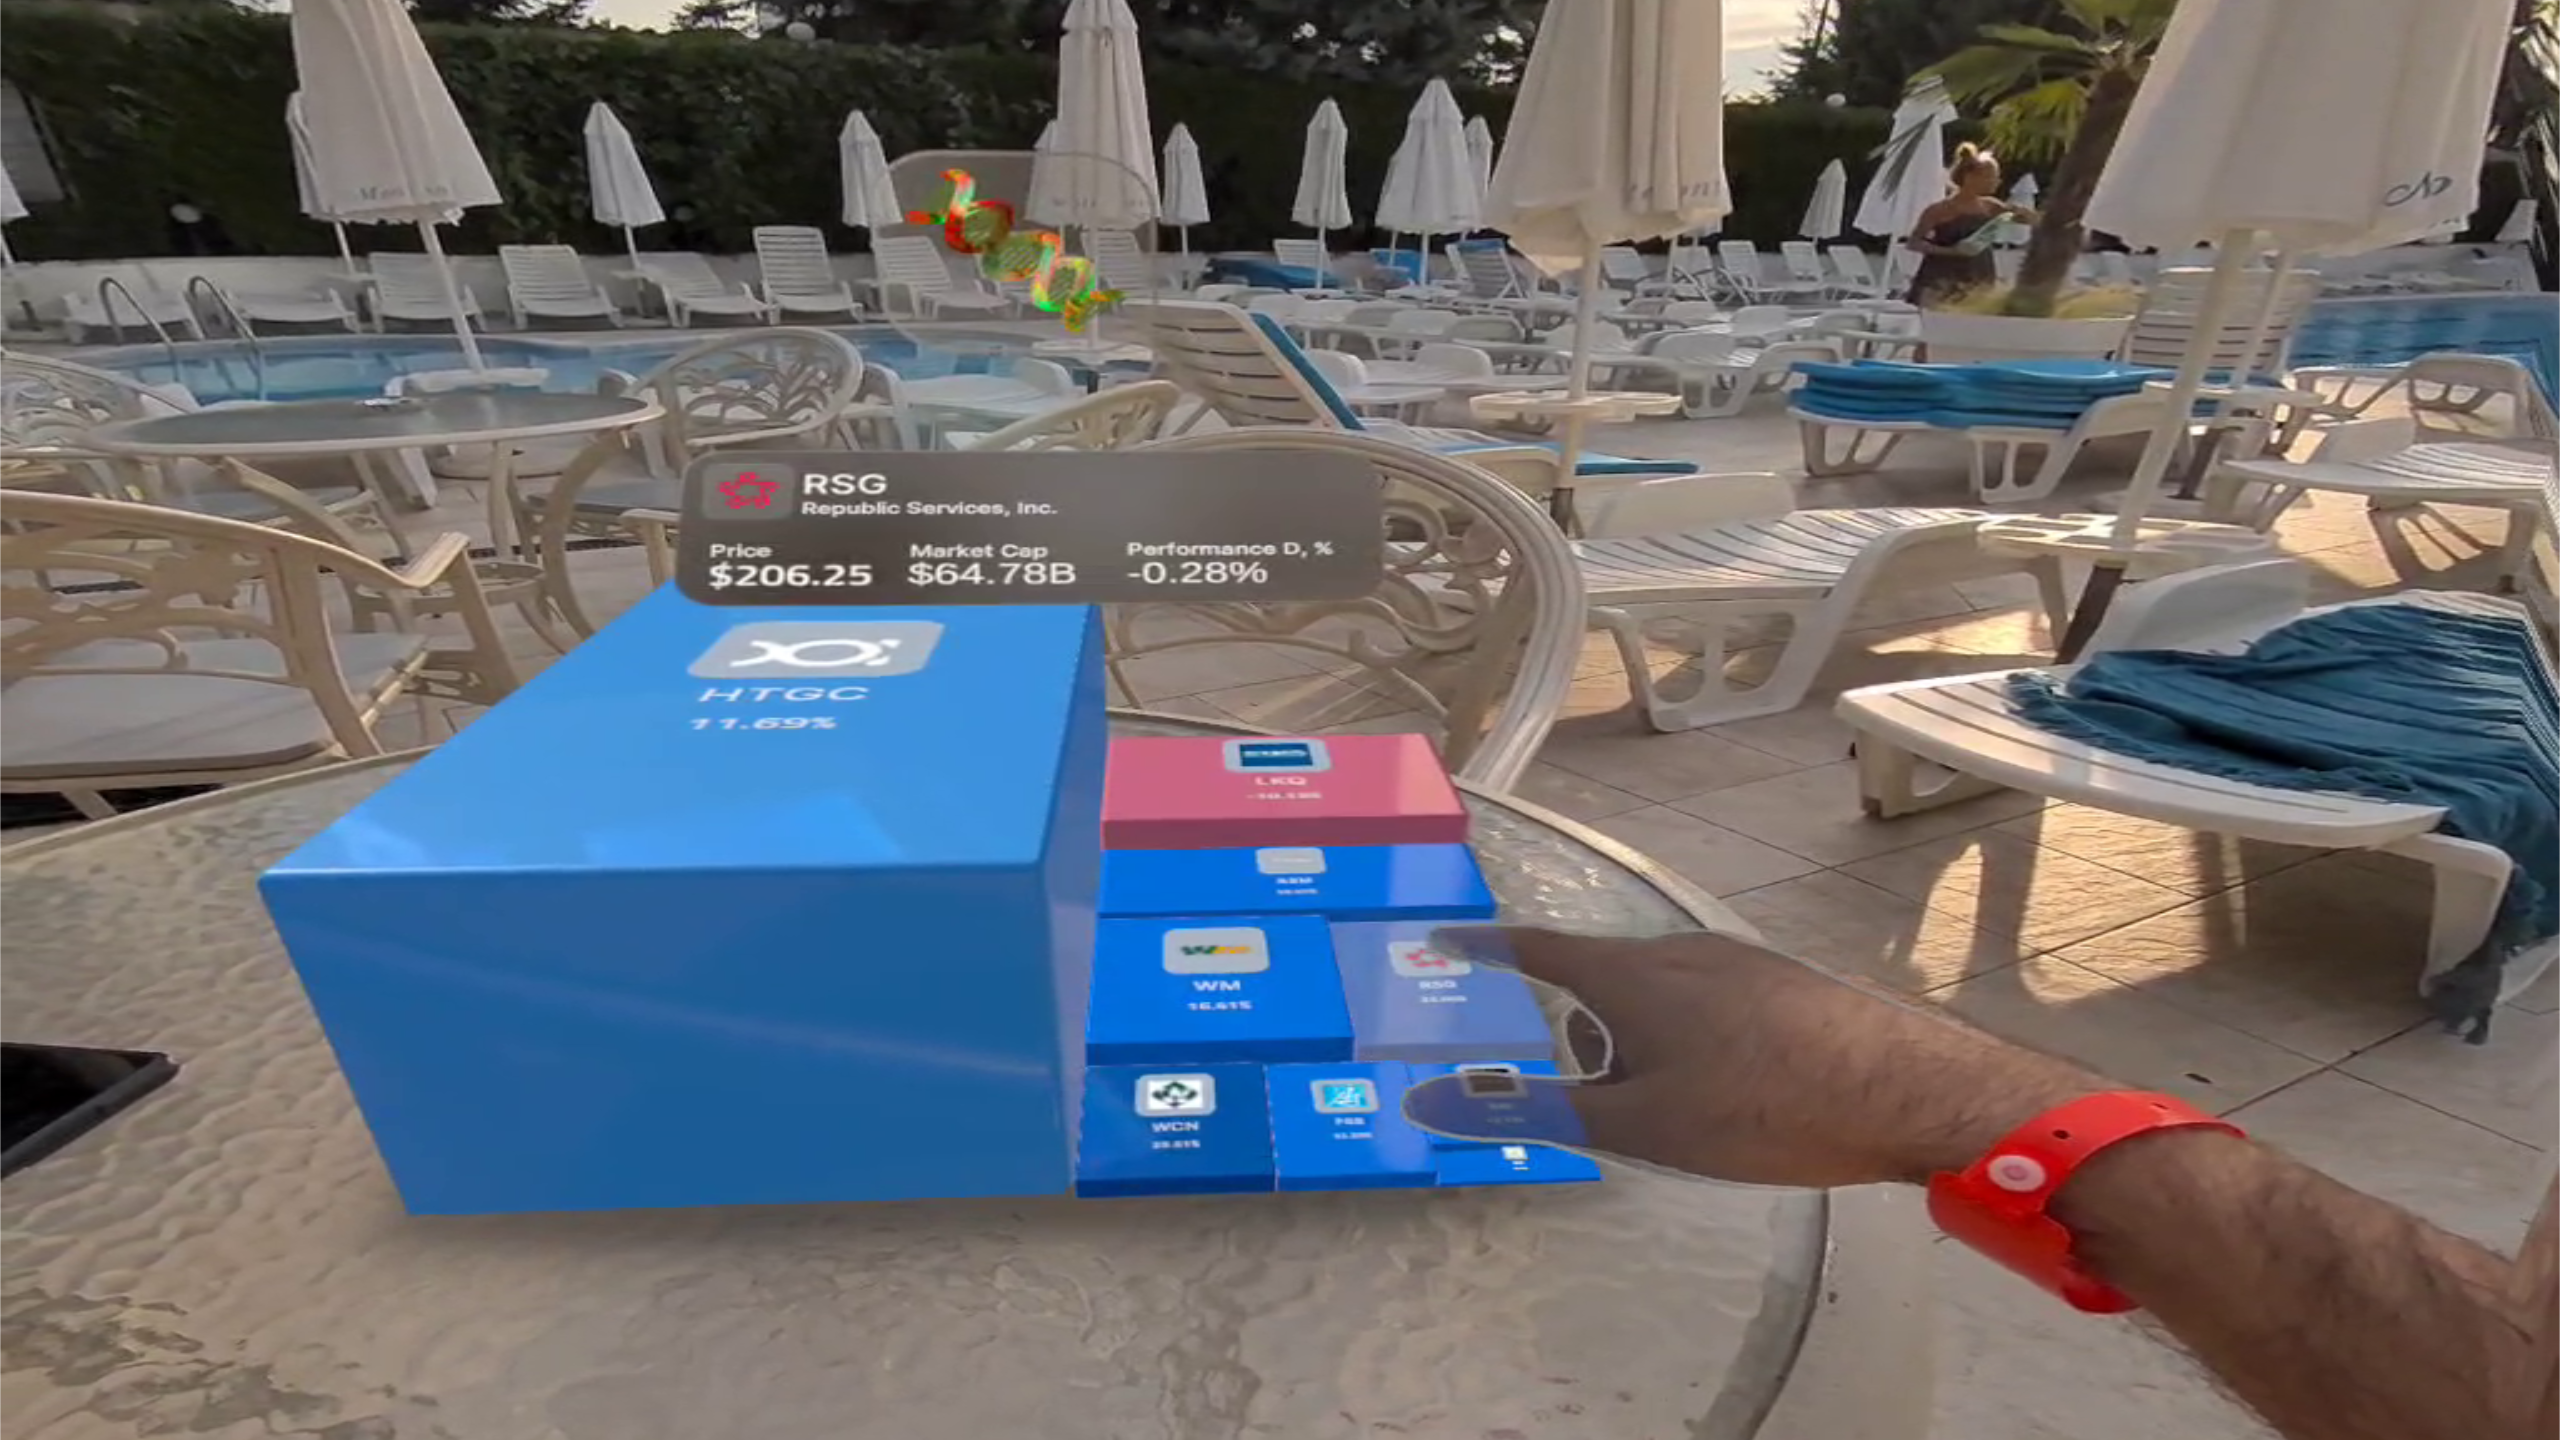
Holographic 3D cube visualizing key stock data in an immersive environment
-
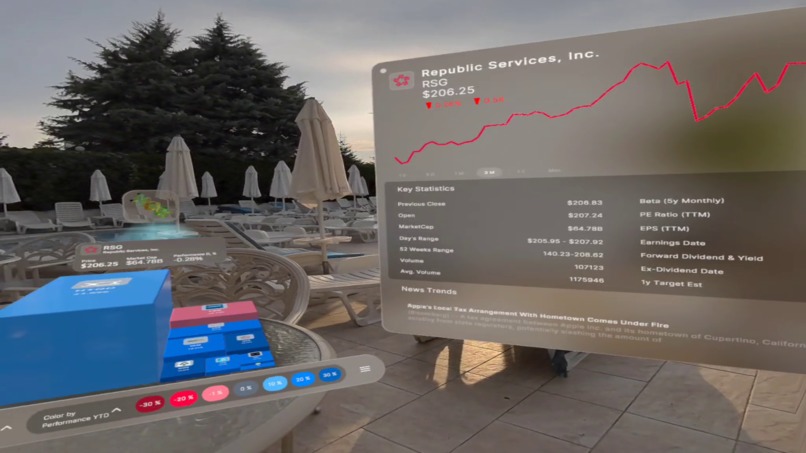
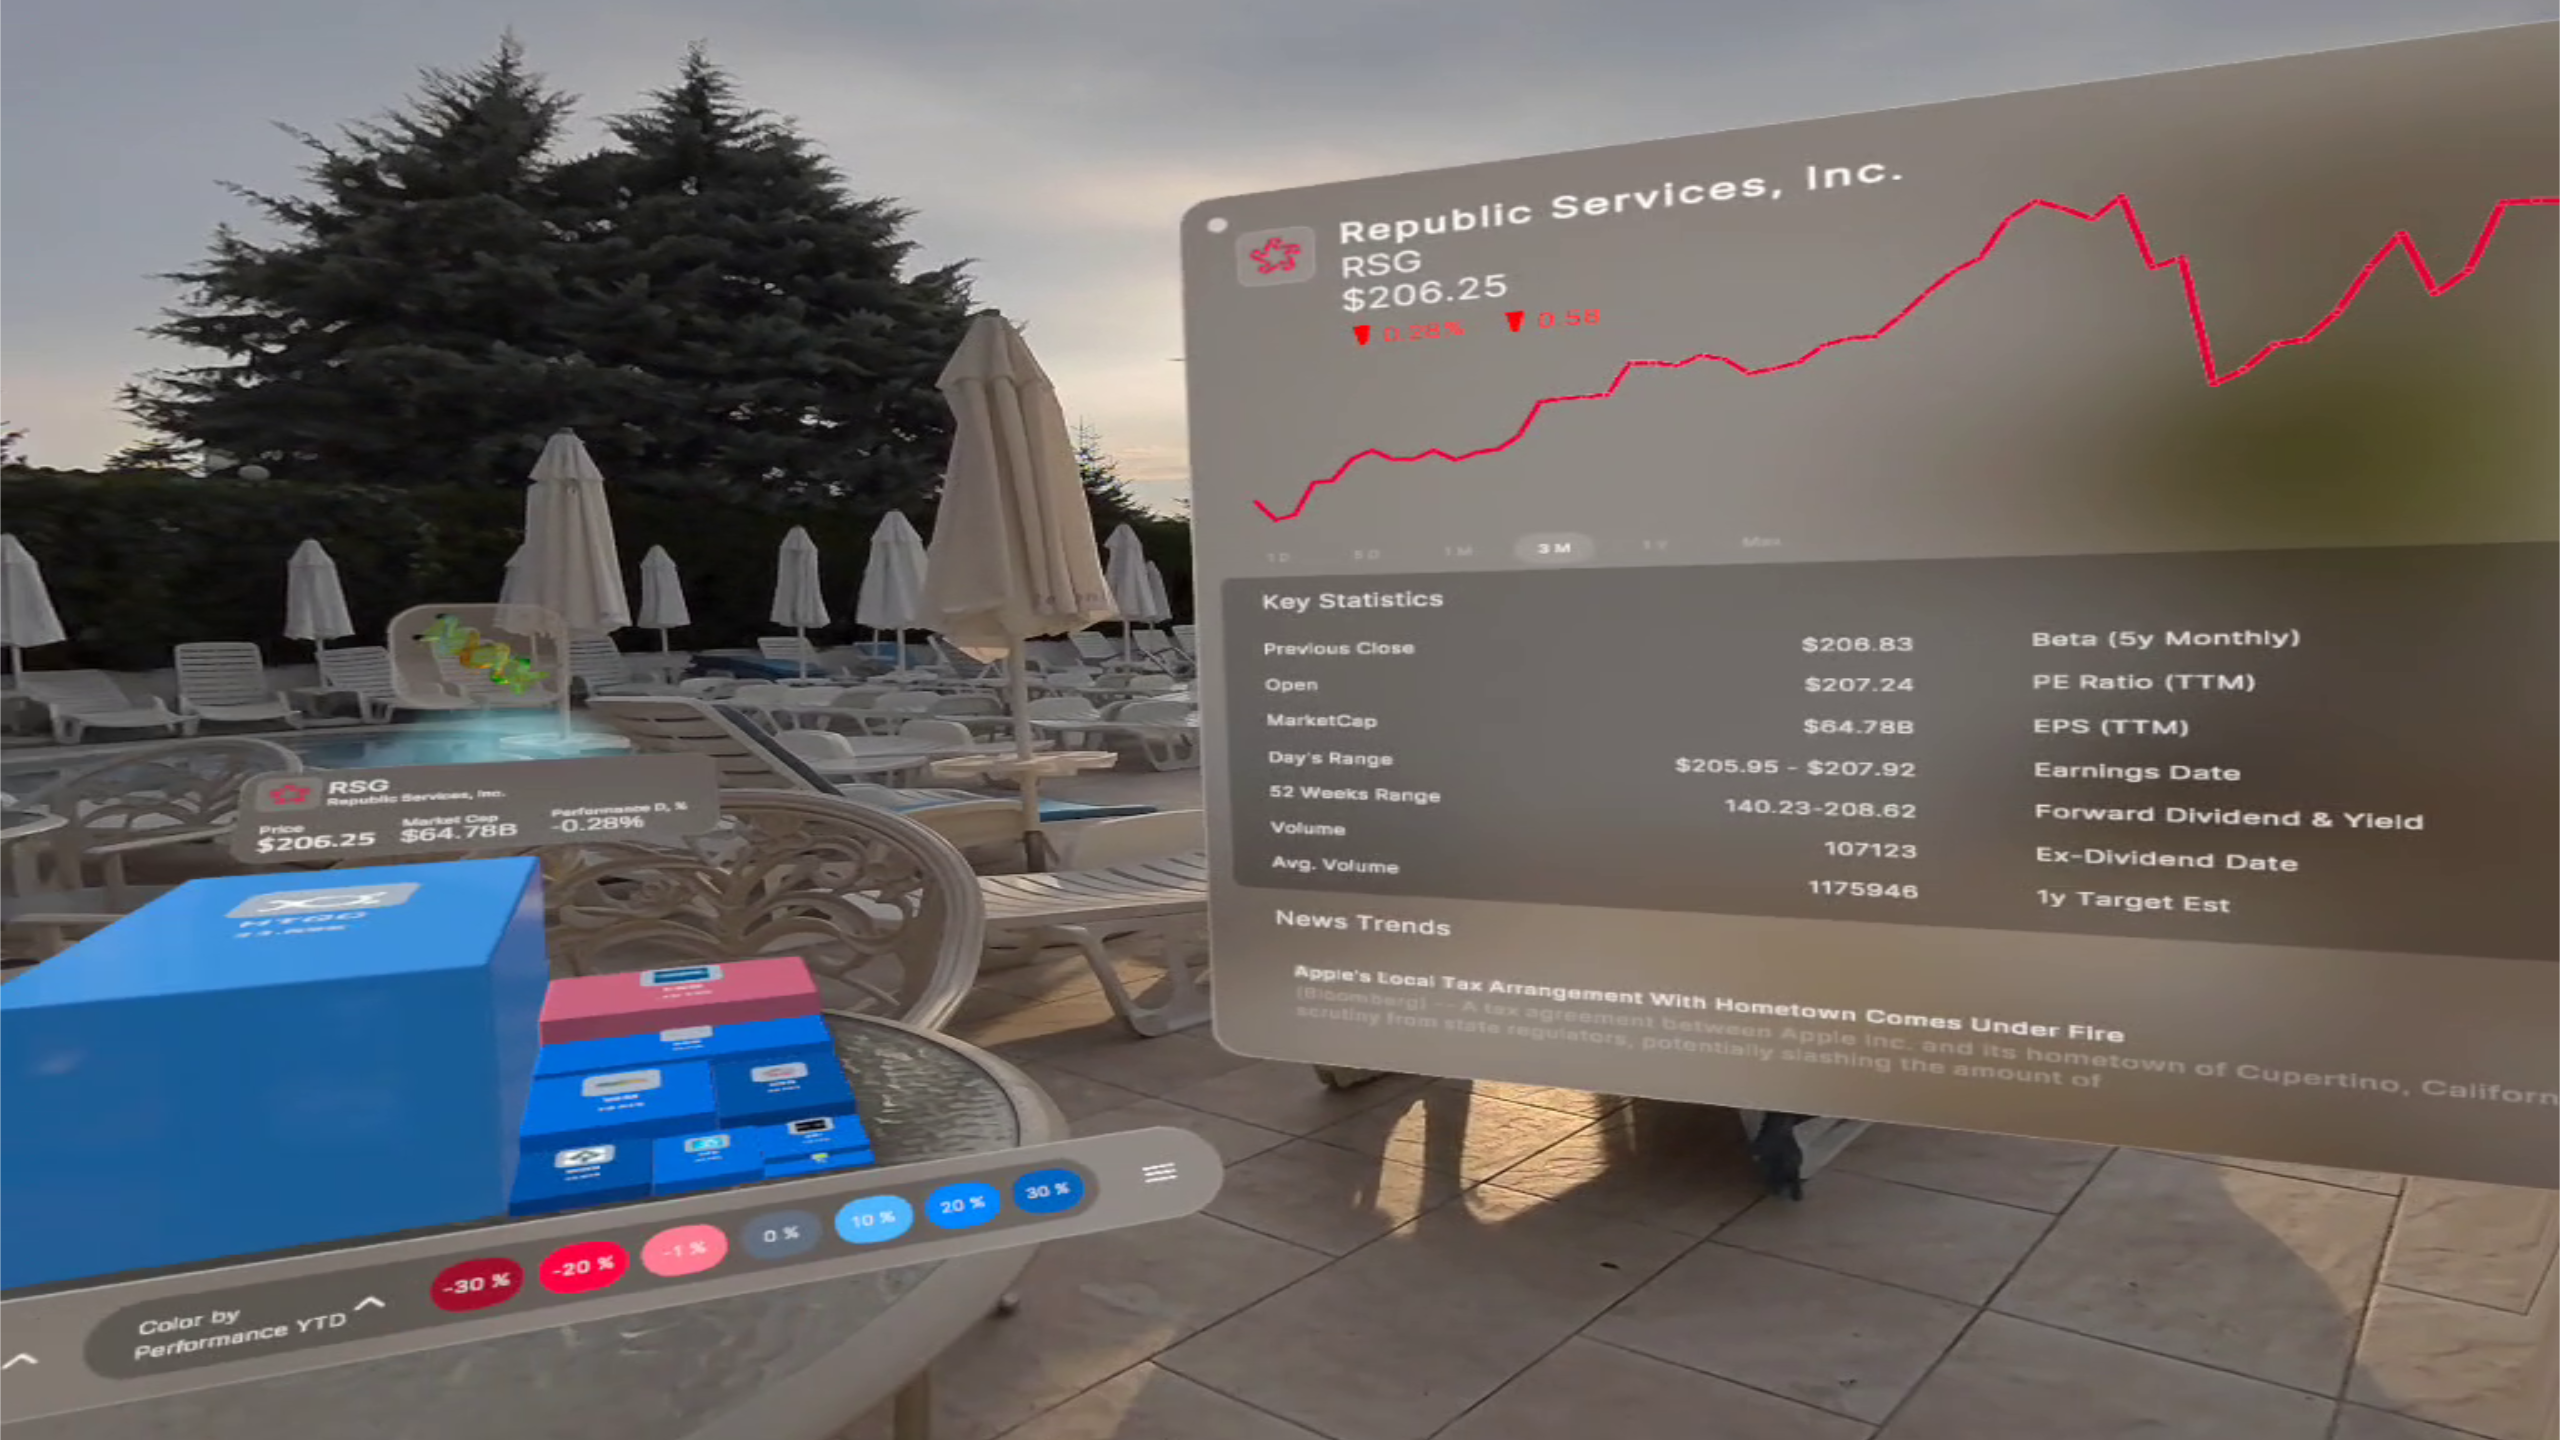
Holographic 3D cube displaying detailed information for RSG stock
-
Holographic 3D heatmap displaying stocks

XR Stock Heatmap: Walk Through the Market
The idea for this project came from a simple question: what if you could walk through the stock market? Traditional 2D charts hide trends and correlations. We wanted to bring financial data to life using XR, letting users explore, interact with, and feel the market in a fully immersive 3D space.
Built in Unity with the Meta Horizon Spatial SDK, the application uses real-time financial data from a paid FinancialModelingPrep subscription, ensuring accurate and up-to-date information. Stocks and sectors are visualized as 3D blocks where height and color show volatility and trading volume. Users can ** filter and highlight patterns**, uncovering market insights in ways impossible on flat screens.
Creating this experience taught us a lot about immersive UX design. The challenge was to present complex financial data clearly and intuitively, optimize performance for VR, and design gestures and interactions that feel natural in 360 degrees. Iterating on user feedback helped make the interface approachable even for XR newcomers.
Future improvements include AI-powered trend detection, risk alerts, and collaborative VR spaces where multiple users can explore the market together. We also plan to expand to crypto, commodities, and global indices, making the heatmap a comprehensive financial tool.
During the competition, updated builds improved performance, interactivity, and heatmap clarity, showcasing the unique value of immersive data visualization. Screenshots and demo videos highlight how XR transforms complex numbers into spatial, actionable insights.
By combining real financial data with immersive XR, this project turns abstract numbers into an experience you can step into, helping users understand the market like never before. It is not just a visualization; it is a new way to see, feel, and interact with finance.
Built With
- bulgarian
- english
- german
- swedish


Log in or sign up for Devpost to join the conversation.