-

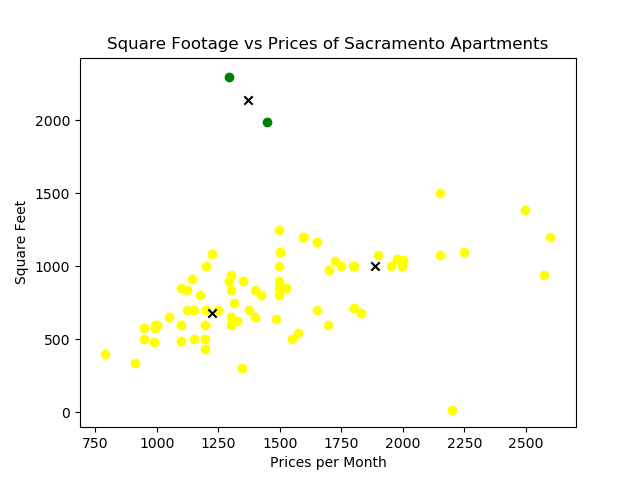
Square Footage vs Prices of Sacramento Apartments
-

Square Footage vs Prices of Sacramento Apartments, with extra points to show dynamic clustering

Inspiration
Despite having websites like Zillow that list for rent apartments, it is still difficult to determine an apartment’s value compared to the other options. Finding apartments can be very stressful and time consuming especially when coupled with work/school. That is why we created a program that helps clearly choose the right apartment for the user.
What it does
Our program data scrape information about apartments in a designated city, then takes two aspects and creates a scatter plot, each point being a different apartment. Using k-means clustering and silhouette analysis, we clearly identified apartments of more value above its peers. Additionally, we are storing the data using Google Firebase.
How we built it
We utilized UIPath’s web scraping tool and output the apartment data from Zillow into a CSV file that would then be read in by our program to create an array of data points. We then graphed each point and used K-means clustering to separate apartments into identifiable groups. (Silhouette analysis was used to dynamically decide the number of clusters, based on the data provided.) Afterward, we calculated the ratio between the two chosen aspects and identified which groups were of more or less value.
Challenges we ran into
Finding a method of data scraping was difficult as we could not find a fully automated solution that translated the data into a readable file type. By using UIPath, we were able to web scrape data that was easily converted into an input file for our program. The biggest challenge of all, however, was that none of us had prior experience outside of intro classes. We had to properly install every extension, program, library, etc. within the 24-hour time limit.
Accomplishments that we are proud of
Every technique and tool we used (data scraping, k-means scoring, UIPath, Firebase, etc.) was brand new to us. The fact that we created a working prototype that dynamically scaled its result was our biggest success.
What we learned
We learned how to data scrape, and use k-means scoring to separate data points into separate clusters. We were also able to dynamically choose the number of clusters using silhouette analysis. By learning how to use git, we were all able to collaborate effectively and have each member contribute.
What's next for Apartment Value Estimator
The next big step is to introduce more options for the x/y axis, which includes apartment ratings, number of beds, bathrooms, distance, etc. We would also introduce better data scraper to continually update each apartment’s data. Finally, we would incorporate more cities into our database.


Log in or sign up for Devpost to join the conversation.