-
-
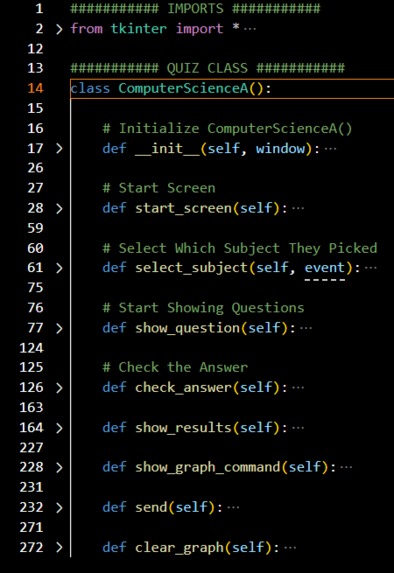
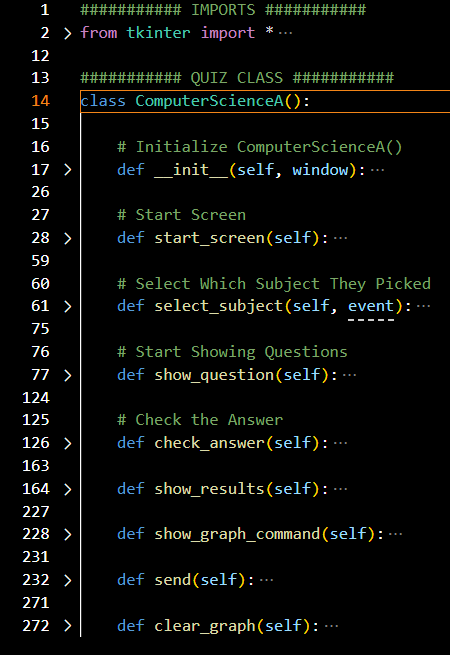
The quiz_ui.py file. This is the brain of the entire program.
-
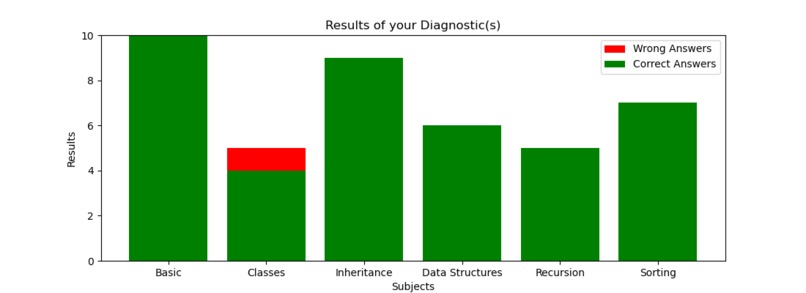
The ending graph.

Inspiration
My brother is in high school and he is taking the AP CSA test. He needed to learn so much on short notice and has a big book filled with topics. He already had past coding experience so some of the topics were familiar to him. I love making quizzes and why not make it something to help lots of people?
What it does
The AP CSA Diagnostic is a GUI (Graphical User Interface) allowing users to pick a topic regarding AP CSA and be quizzed on it. This program is made to be easily changed. Anything you could possibly need to change is all in CSV files editable in Excel sheets. After every topic is done, you will be able to view a graph with your wrong and correct answers. Anytime you complete a new topic, it will be added to the graph, not creating a new one. Also at the end, you can send the graph as a PNG file to your email and clear the diagnostic history to have a fresh start.
How we built it
I built this program using many amazing libraries in Python. For my CSV files and all other data analysis, I used Pandas. My GUI was created with Tkinter, a powerful library with many capabilities. Although Tkinter doesn't have many styling capabilities which resulted in my project not looking too good, it still works in helping people find out what they can work on next. The graph was created using matplotlib.pyplot, a library used to graph and display analytics. Sending emails was probably the easiest, although it required lots of importing. Using smtplib, os, and the email libraries, I was able to send a PNG file of the graph with the click of a button. Add all of these libraries together, you get an easy-to-use, understandable, and helpful program. Otherwise known as the AP CSA Diagnostic.
Challenges we ran into
Over the course of making this program, I ran into many problems. Among them was figuring out how to keep all of the subjects in a graph and updating it on the go, using Pandas to generalize every single part of this program, and keeping track of all the little things, like .get() or self.
Accomplishments that we're proud of
I am very proud of how the graphs for this program turned out. The formatting could be a lot better, but the programming and organization of the files helped make everything easier. That is why I love OOP (Object-Oriented-Programming)!
What we learned
I learned about matplotlib.pyplot and how it can be used to create so many new things. I learned how I could use Jupyter Notebooks to test out any code and single out the problem. I also learned That comments are very important for people viewing the file to understand how the program works.
What's next for the AP CSA Diagnostic
I look forward to the many future plans for the AP CSA Diagnostic, and that's not just for publicity. I plan on transferring this programming to a web app and maybe later even a mobile app. These could help a lot with formatting and other interactivities. Another big step I plan to take for this program is adding users. You wouldn't want somebody wiping out your diagnostic graphs to put theirs in. That's why I can create users and passwords to have everybody's diagnostics safely, separately stored for their use.

Log in or sign up for Devpost to join the conversation.