-
-
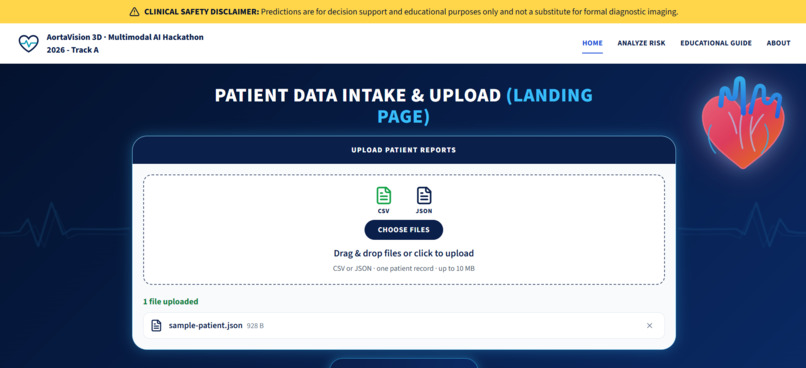
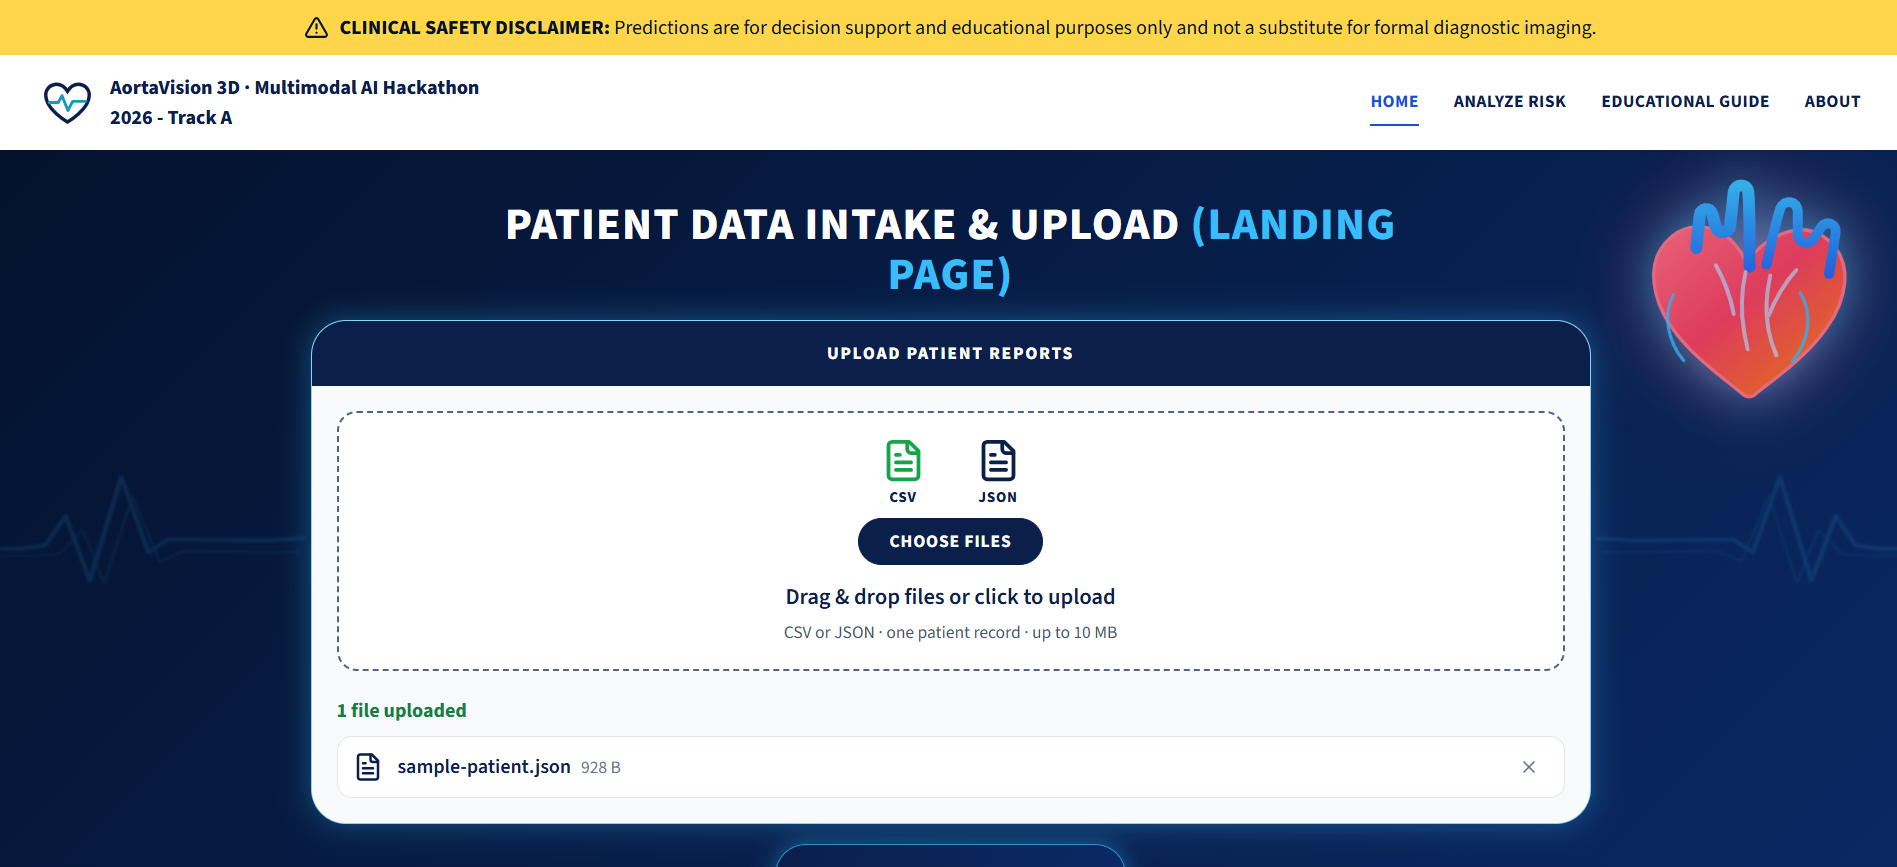
PATIENT DATA INTAKE & UPLOAD
-
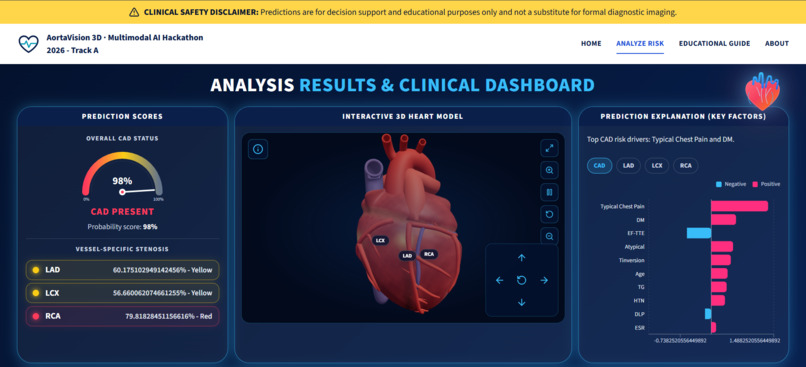
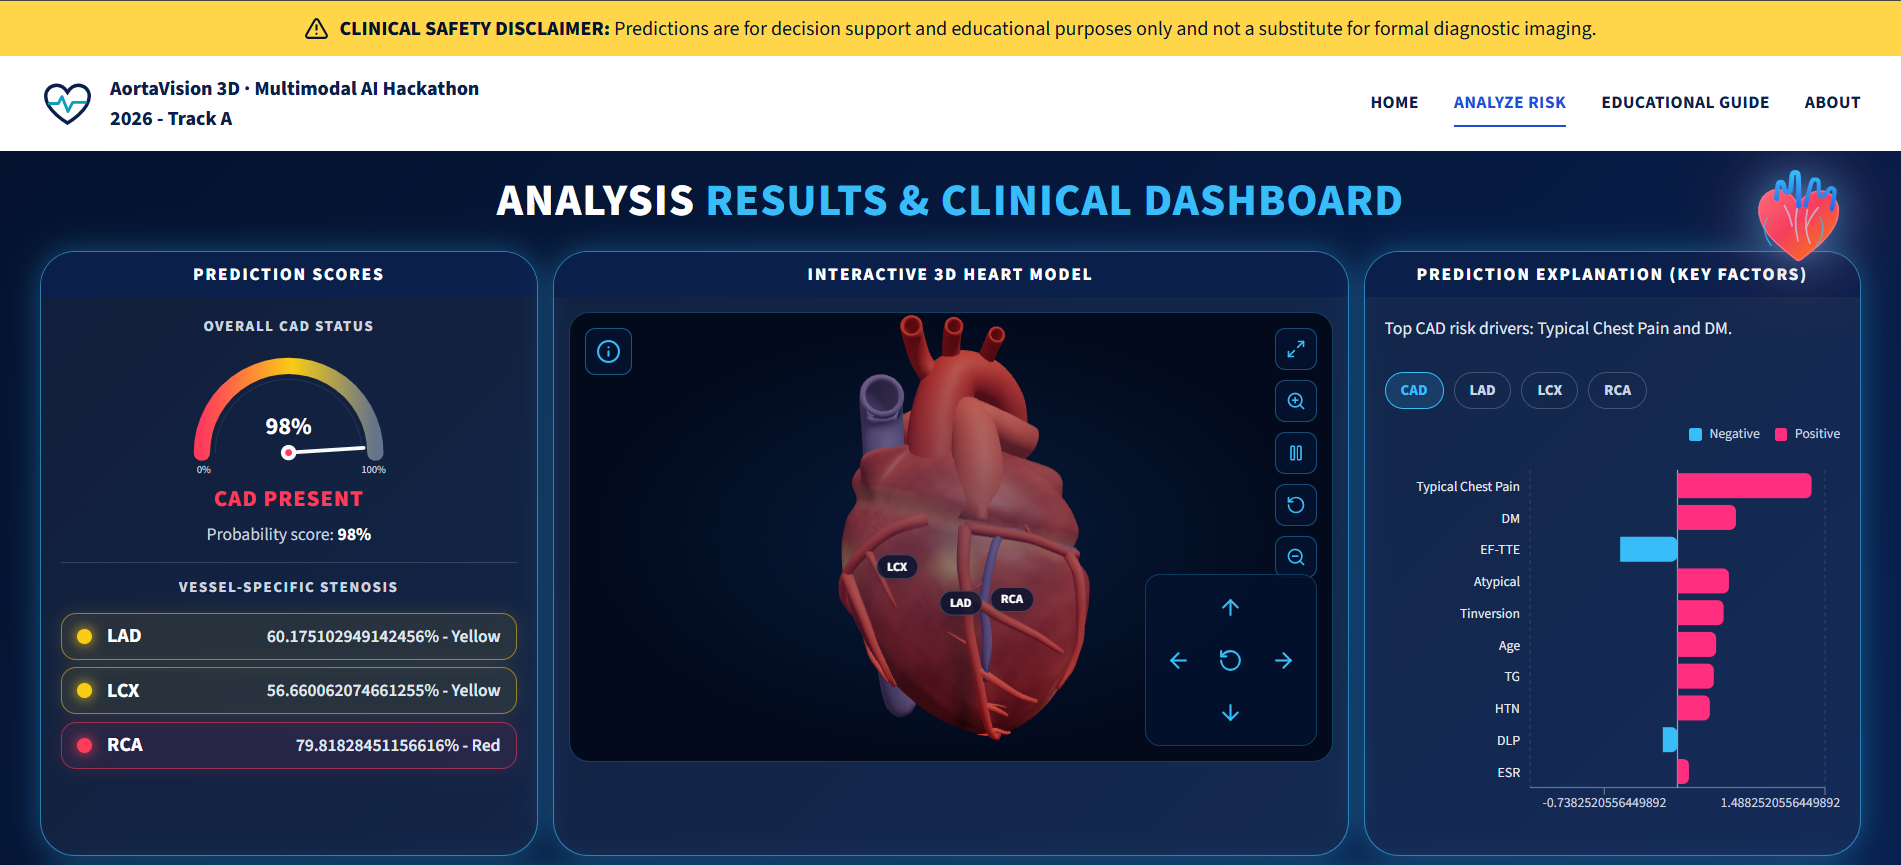
ANALYSIS RESULTS & CLINICAL DASHBOARD
-
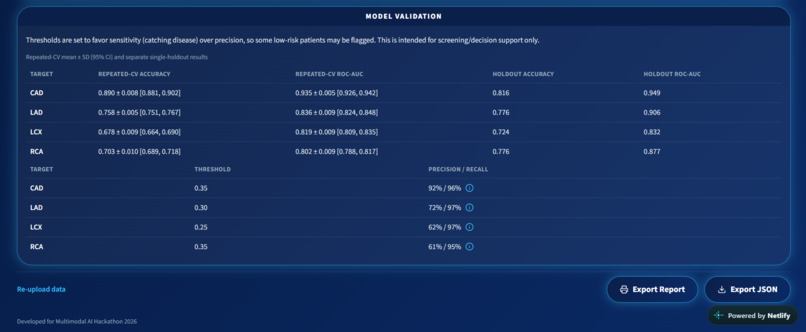
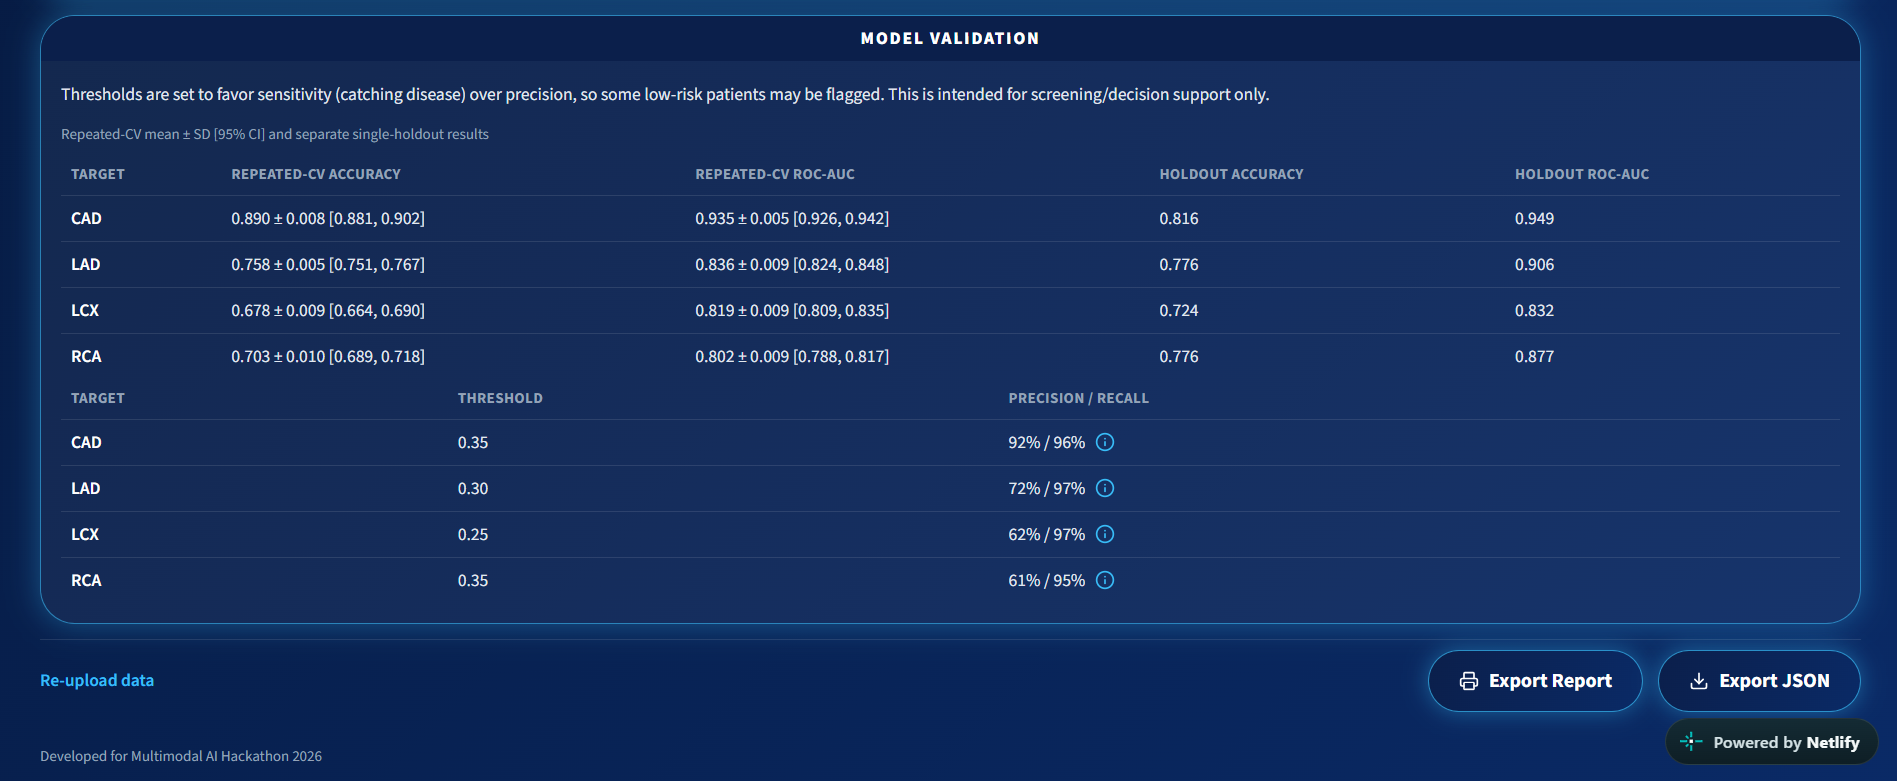
MODEL_VALIDATION
-
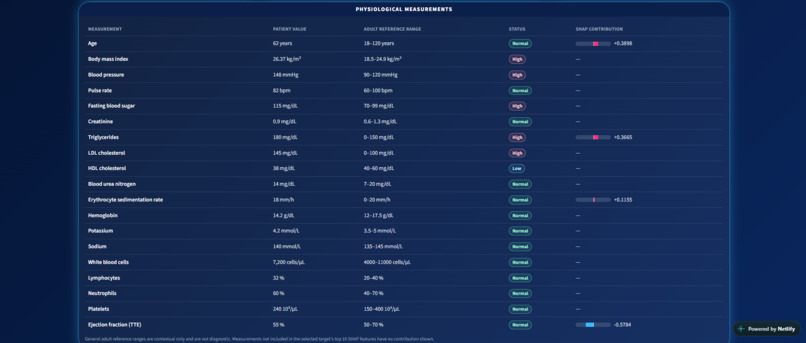
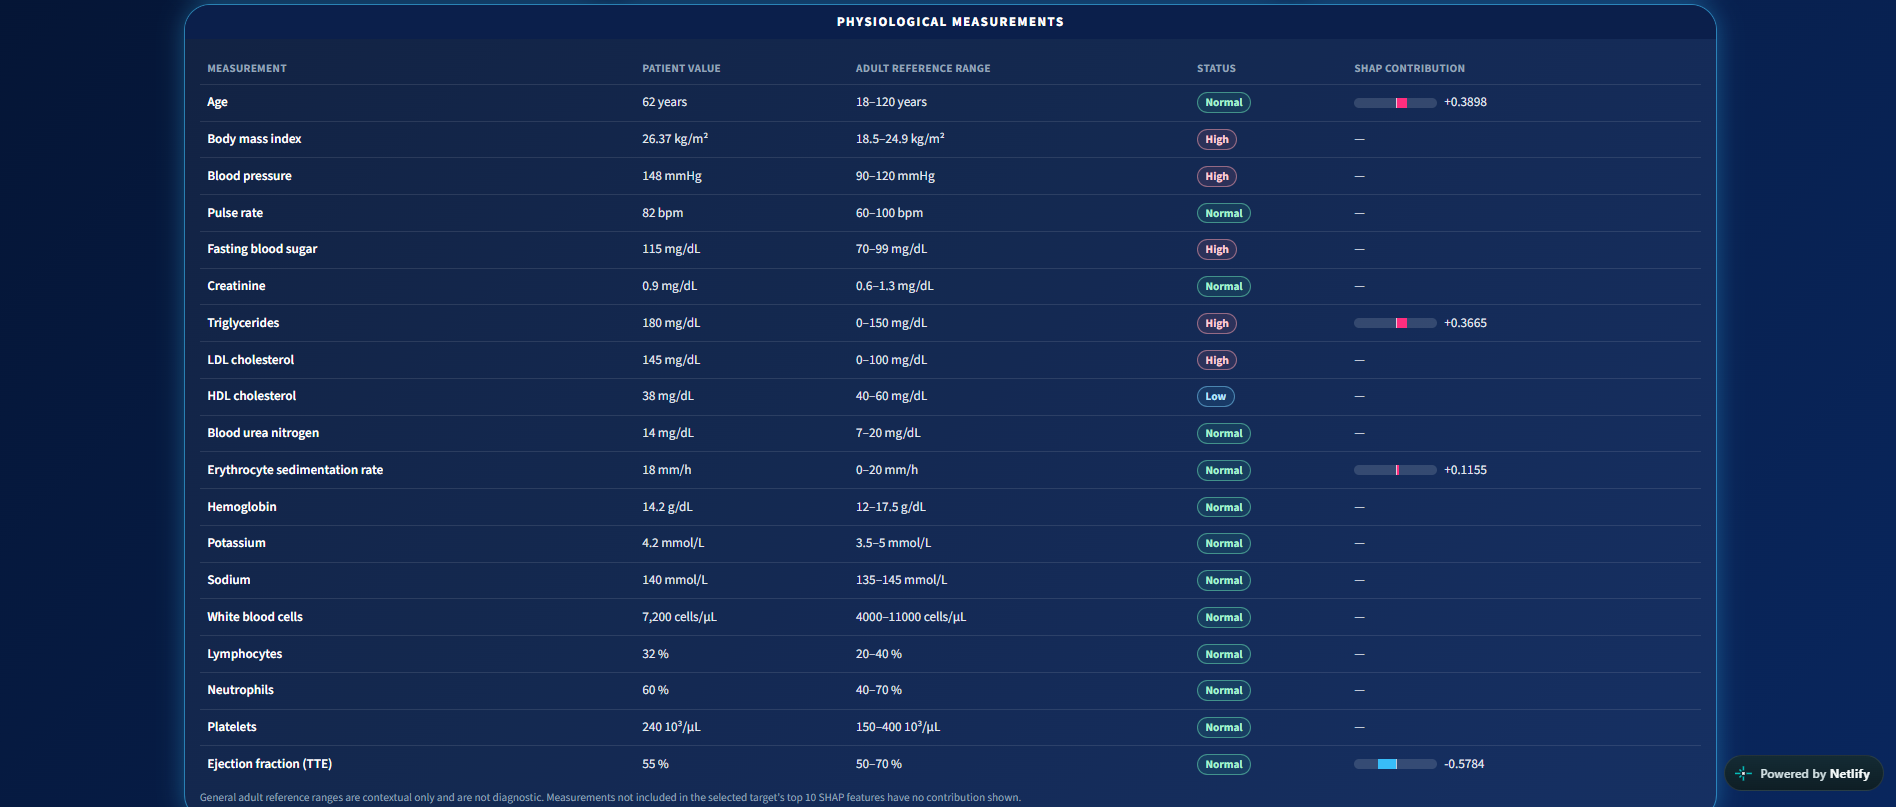
PHYSIOLOGICAL MEASUREMENTS
-
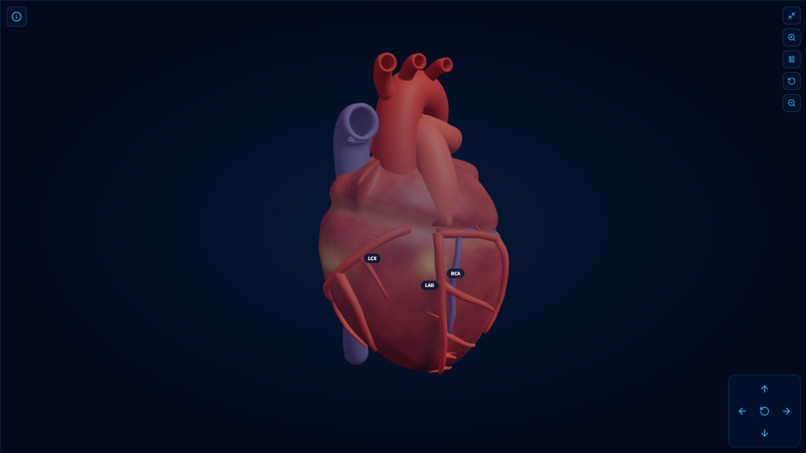
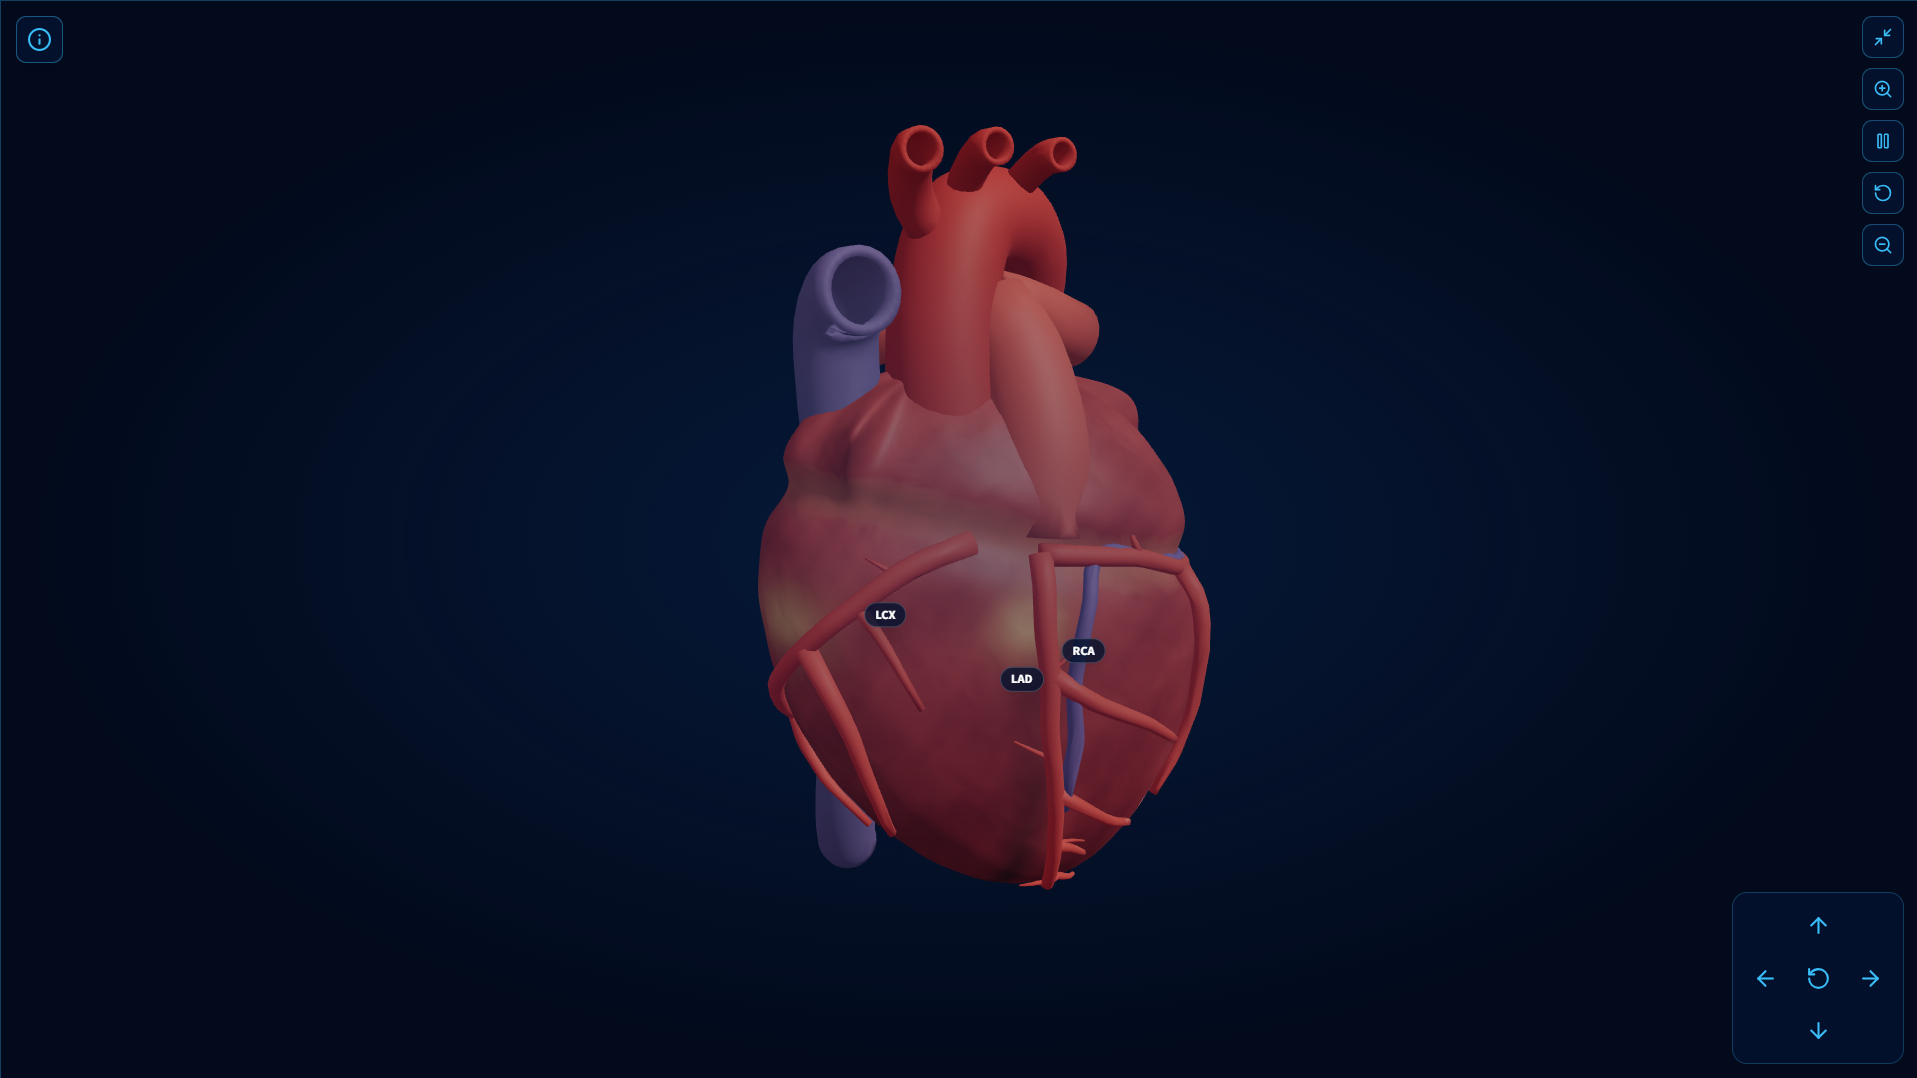
INTERACTIVE 3D HEART MODEL
-
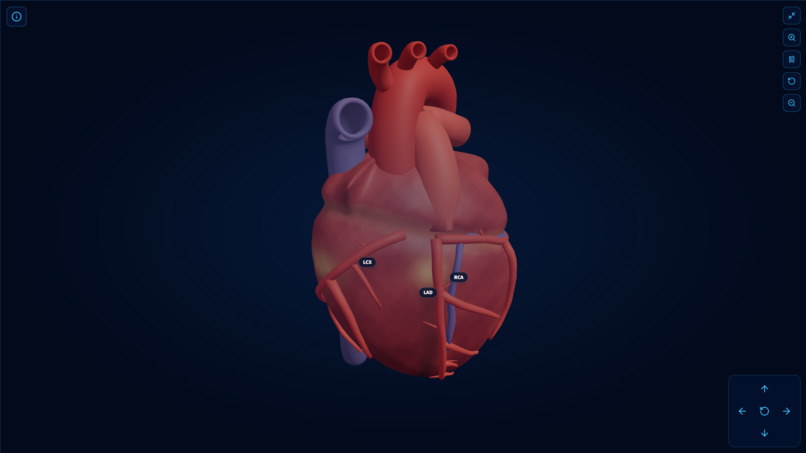
INTERACTIVE 3D HEART MODEL
-
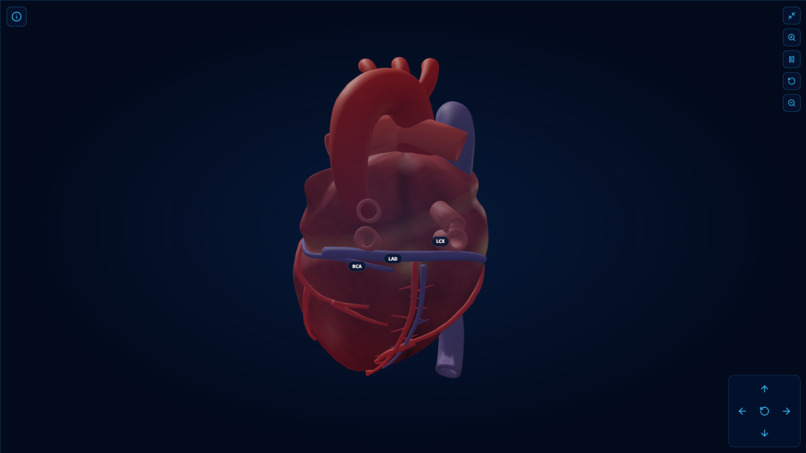
INTERACTIVE 3D HEART MODEL
-
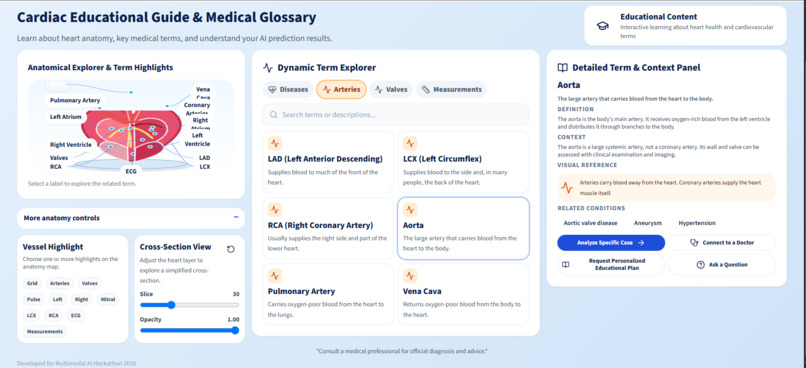
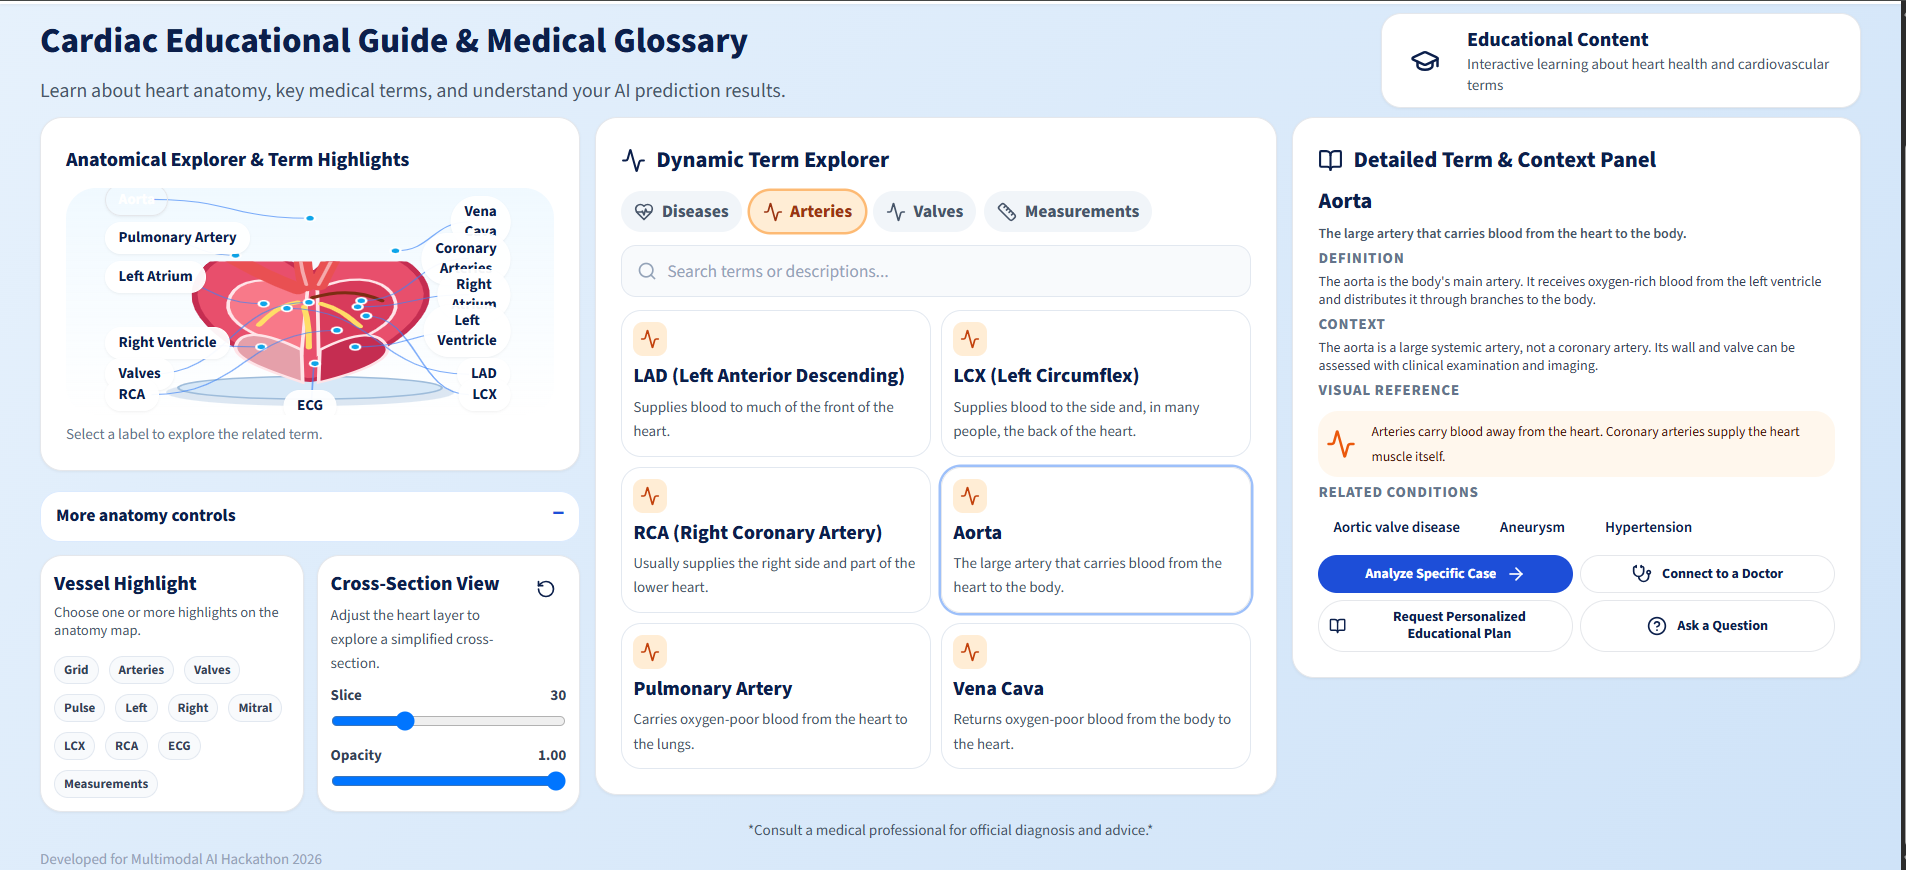
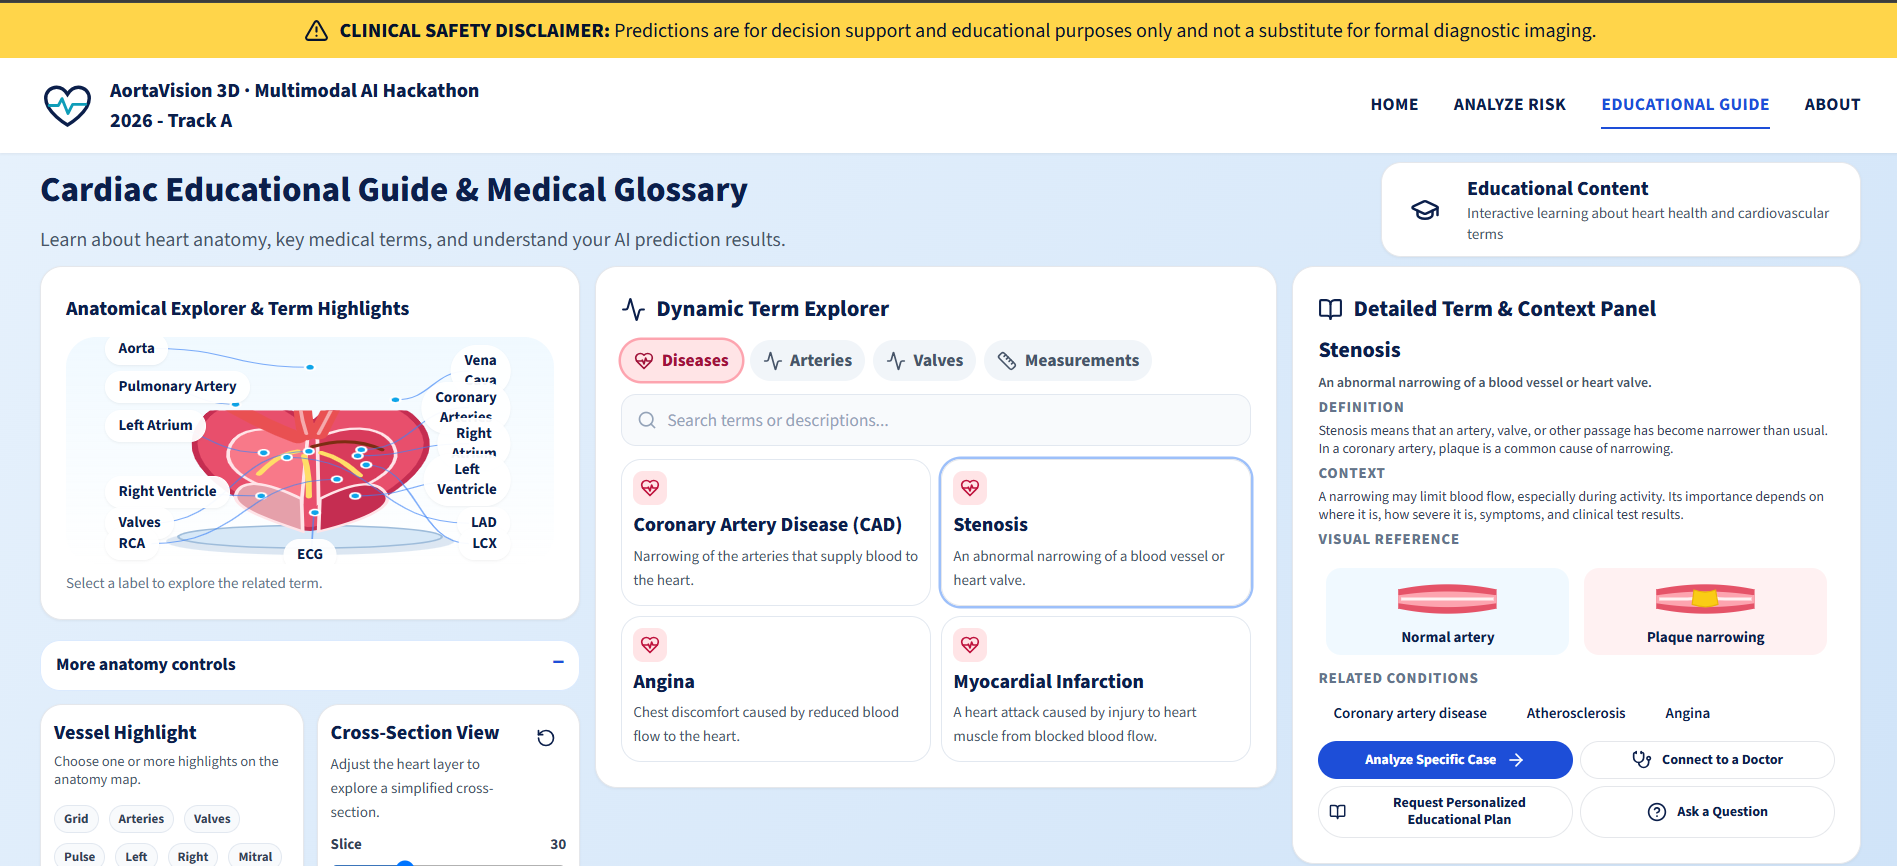
Cardiac Educational Guide & Medical Glossary
-
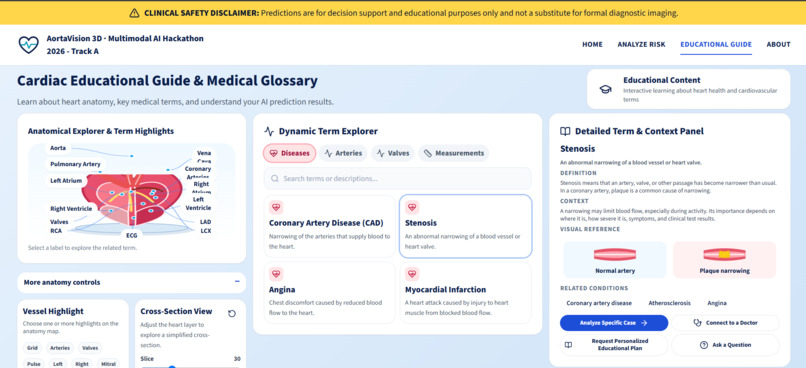
Cardiac Educational Guide & Medical Glossary
-
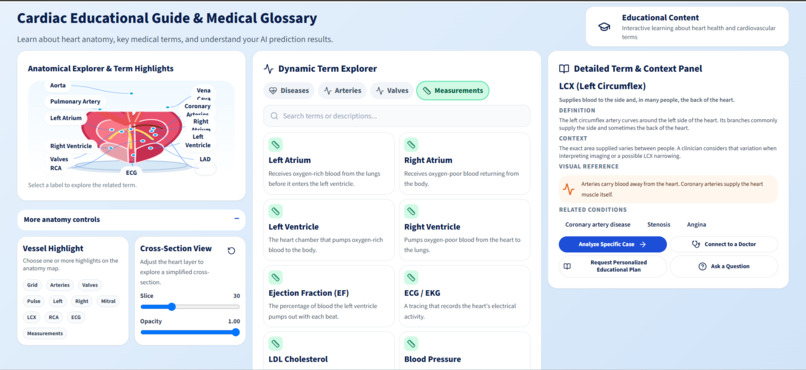
Cardiac Educational Guide & Medical Glossary
-
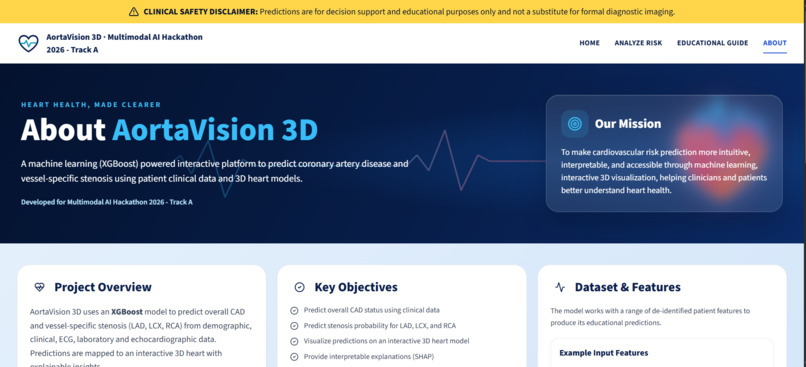
Cardiac Educational Guide & Medical Glossary
AortaVision 3D
Turning coronary risk percentages into something you can see, rotate and question.
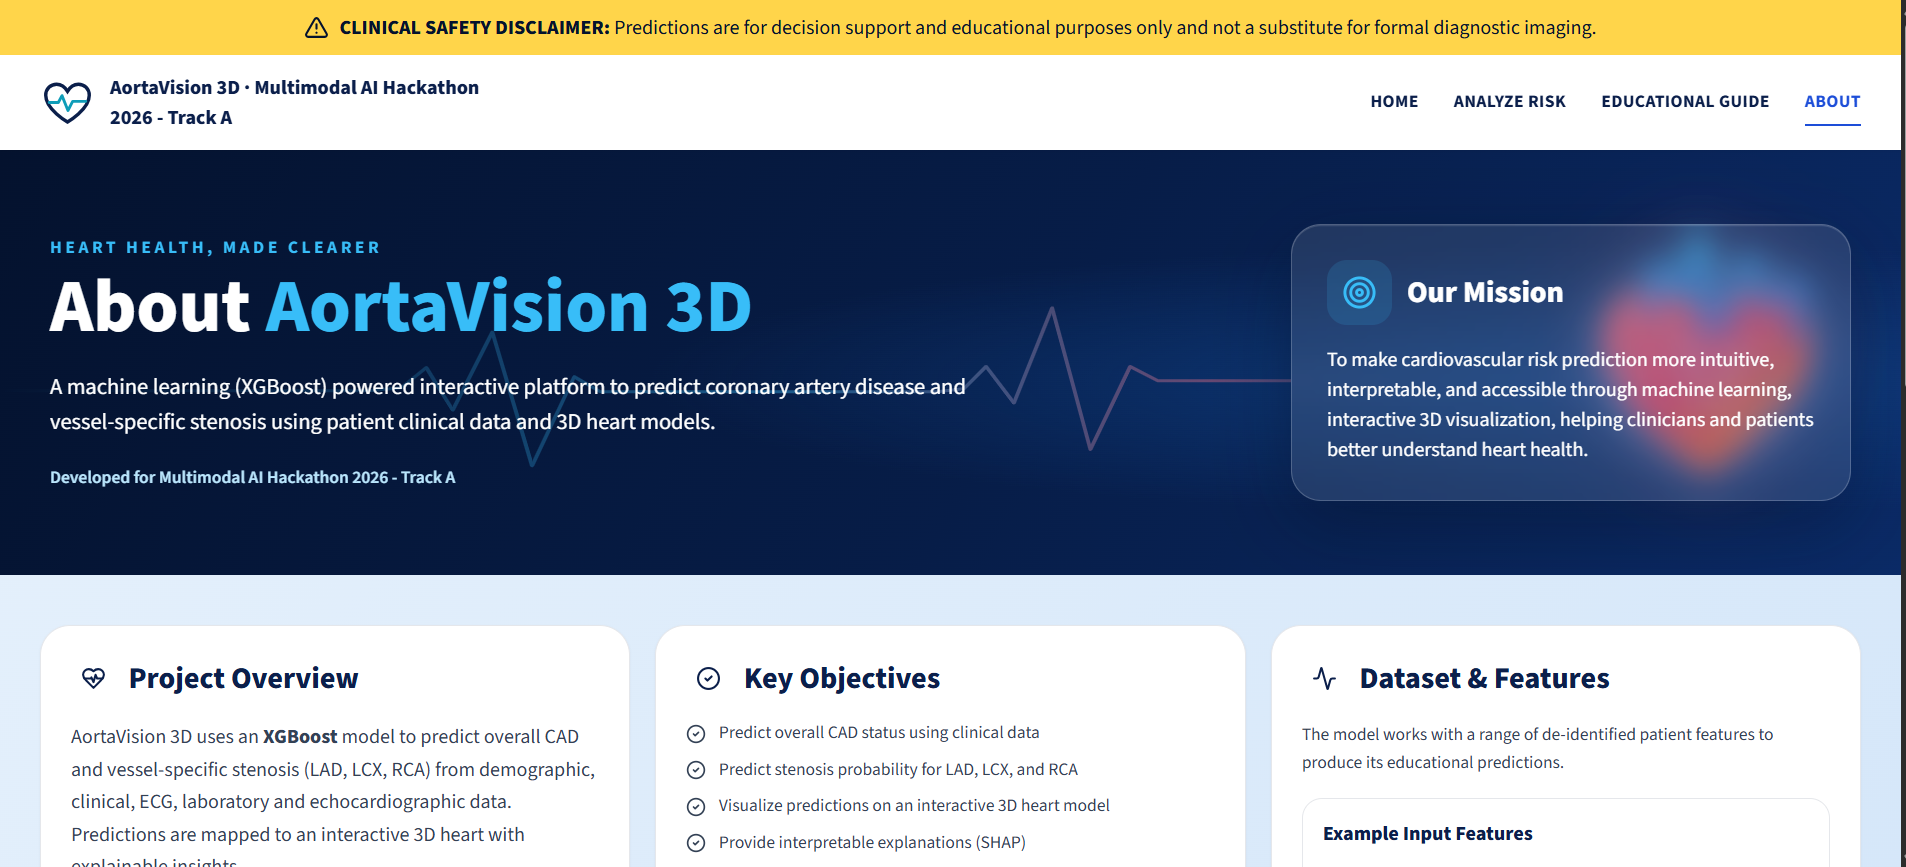
Clinical safety disclaimer: AortaVision 3D is a research prototype for decision support and educational purposes only. It is not a diagnostic device and is not a substitute for coronary angiography, CT angiography or a clinician's judgment. Artery positions in the 3D scene are schematic, not an imaging-based lesion map.
Inspiration
Cardiovascular disease is the leading cause of death worldwide, and coronary artery disease (CAD) is a major driver. Machine-learning models can already output a risk percentage, but a bare number like "LAD: 0.82" tells a clinician or a patient very little about where the problem is or why the model believes it.
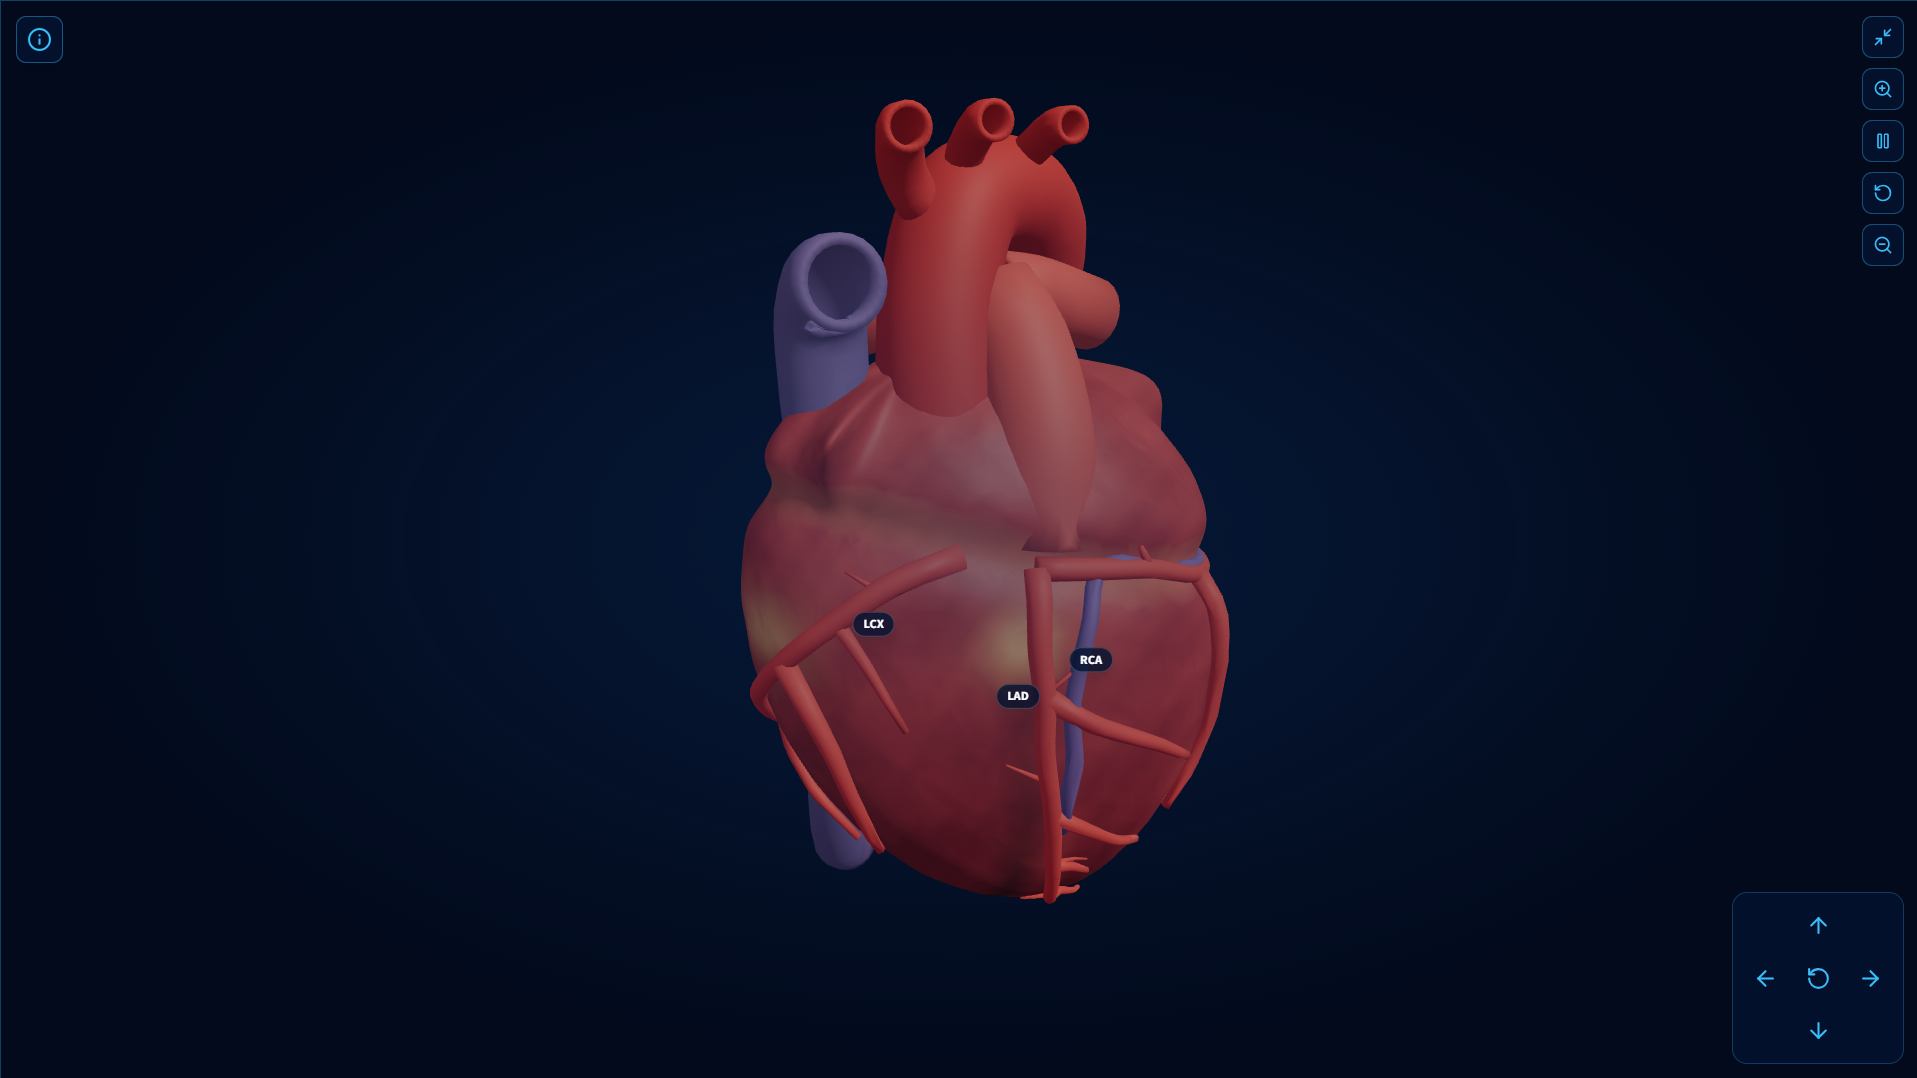
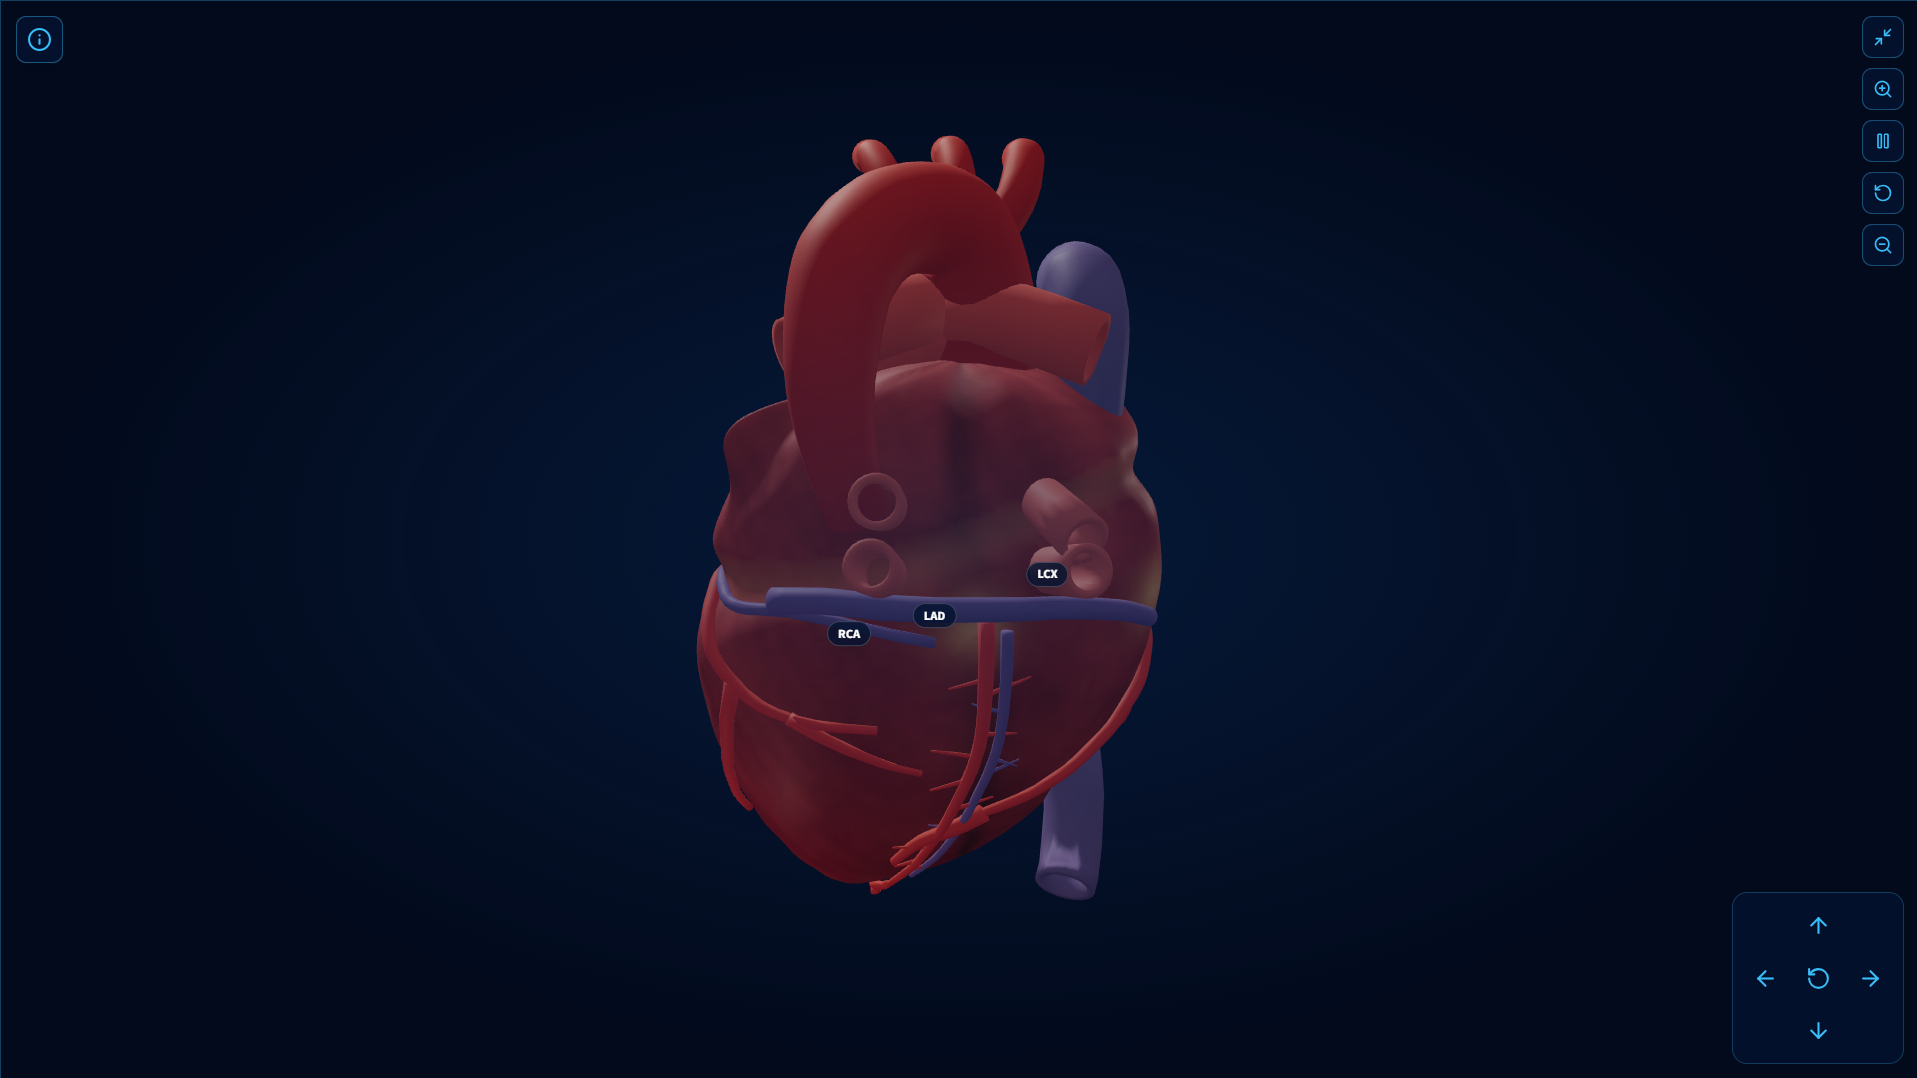
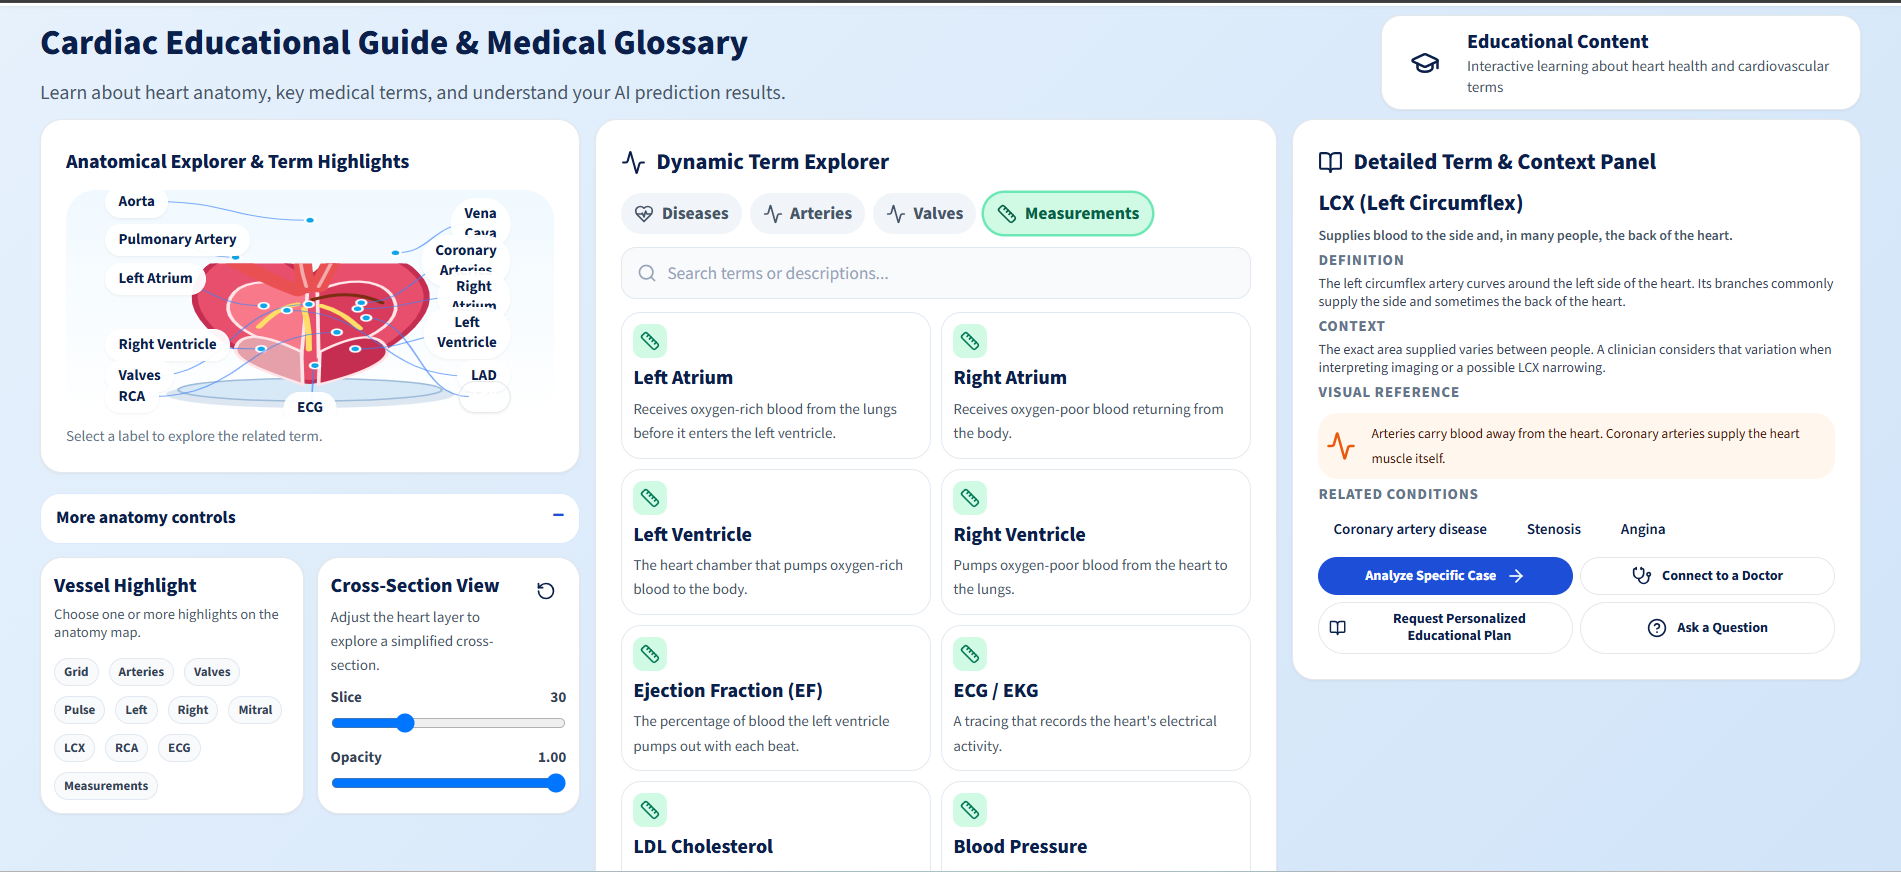
Coronary anatomy is spatial. The LAD feeds the front of the heart, the LCX feeds the side and back, and the RCA feeds the right side and bottom. A risk estimate that respects this geometry is far easier to reason about and discuss. We wanted to close three gaps with one tool:
- The "where" gap: show risk on the actual arteries instead of in a table.
- The "why" gap: show which patient measurements pushed each prediction up or down.
- The trust gap: be honest about uncertainty, limits and what the tool is not.
That became AortaVision 3D, our entry for Track A: Cardiovascular Risk Visualization & Prediction.
What it does
A user enters patient data by form, sample patient (High / Low / Borderline risk), CSV or JSON. The system then:
- Predicts overall CAD status and the stenosis probability of the LAD, LCX and RCA.
- Colors each coronary artery on an interactive 3D heart from green to yellow to red as the predicted probability rises.
- Lets you rotate, zoom, hover and click a vessel to pin its risk card and inspect it.
- Explains every prediction with SHAP: red bars raise risk, blue bars lower it, switchable per target (CAD / LAD / LCX / RCA).
- Shows a physiological breakdown: each measurement's value, its reference range and its contribution to the prediction.
- Reports validation metrics (accuracy, precision, recall, F1, ROC-AUC) next to the predictions.
- Keeps the safety disclaimer always visible: a persistent banner, a first-visit modal and a note on the printed report.
How we built it
System architecture
 Patient data (form / sample / CSV / JSON)
                |
                v
   React 18 + Vite frontend ---------------+
   (React Three Fiber 3D heart,            | POST /predict
    SHAP charts, physiological table)      v
                ^              FastAPI backend (port 8000)
                |              |- strict input validation (Pydantic schema)
   probabilities + SHAP        |- saved preprocessing pipeline (joblib)
                +------------- |- 4 XGBoost models (CAD, LAD, LCX, RCA)
                               +- SHAP TreeExplainer
| Layer | Technology |
|---|---|
| Frontend | React 18, Vite, Tailwind CSS, React Three Fiber / Three.js |
| 3D asset | Low-poly heart.glb (~150 KB), no post-processing, so it runs without a dedicated GPU |
| Backend | FastAPI, Pydantic schema validation, CORS, startup artifact checks |
| ML | XGBoost, scikit-learn, imbalanced-learn (SMOTE), SHAP |
| Reproducibility | Fixed seed (42), dataset SHA-256 hash, serialized preprocessor + model weights, check_metrics_consistency.py |
1. Dataset and preprocessing
We used the Extension of the Z-Alizadeh Sani dataset (UCI / Kaggle): 378 patients with demographic, clinical-examination, ECG, laboratory and echocardiographic features, plus ground-truth labels for overall CAD and LAD / LCX / RCA stenosis.
- Strict leakage prevention.
CAD,LAD,LCX,RCAandCathare never model inputs. The training code and the backend both assert this, and our audit reports no leakage in either raw or transformed features. - Cleaning. Fixed unambiguous label typos (
FmaletoFemale,mildtoMild) and removed a constant feature (Exertional CP). - Encoding. About 54 raw clinical inputs expand to 78 model features after one-hot encoding and scaling, all inside a single saved
preprocessor.joblibso training and inference are identical. - Class balance. CAD is imbalanced (291 positive vs 87 negative) while LCX and RCA are perfectly balanced (189 / 189). We applied SMOTE inside each training fold only, never before splitting.
2. Predictive modeling
We trained four independent binary XGBoost classifiers, one per target. After comparing several algorithms in our benchmark scripts, the regularized XGBoost configuration was the best overall trade-off between performance and overfitting:
- Shallow trees (
max_depth = 3), low learning rate (0.03), 300 estimators - Strong regularization (L1
reg_alpha = 1.0, L2reg_lambda = 5.0,gamma = 0.1,min_child_weight = 3) - Row and column subsampling (
0.8)
Validation methodology
- A deterministic, multi-label-balanced 80/20 holdout (302 train / 76 test) that was never used for model selection
- 5-fold stratified CV for model selection
- Repeated stratified CV (5 folds x 10 repeats) on the full dataset for our headline numbers, with preprocessing and SMOTE refit inside every fold
- Per-target decision thresholds tuned on training data only (e.g. 0.35 for CAD, 0.30 for LAD)
3. Explainability
For each prediction we run a SHAP TreeExplainer and return per-feature contributions to the frontend. Because our one-hot encoding splits some features into several columns, contributions are aggregated back to the original clinical variable so a clinician sees "Age" or "Typical Chest Pain" rather than an internal column name. These feed two views:
- SHAP bar chart, switchable per target
- Physiological table: measurement, patient value, reference range, contribution
4. 3D visual mapping
The heart is rendered with React Three Fiber. The LAD, LCX and RCA are separate named objects in the scene, and their material colors are driven directly by the /predict response. The same probability that appears in the dashboard card sets the color of the corresponding artery, so the model output and the anatomy stay consistent. Interaction is handled with orbit controls plus hover and click raycasting. Selecting a vessel pins its detail card and switches the SHAP view to that vessel.
5. Extensibility
The architecture is deliberately modular, matching Track A's requirement that new features, models or structures shouldn't need a redesign:
- A new clinical feature means updating the schema and preprocessor, then retraining
- A new target (for example, a vessel branch) means adding one model file and one 3D node
- The frontend reads results from a documented API contract (
BACKEND_CONTRACT.md)
Results
Our headline estimate is the repeated cross-validation result (5 x 10 folds, mean with 95% interval over repeat-level means). The single holdout split is reported as a secondary result, because with only 76 rows a few patients move the numbers noticeably.
| Target | CV ROC-AUC | CV F1 | CV Recall | CV Accuracy | Holdout ROC-AUC | Holdout F1 |
|---|---|---|---|---|---|---|
| CAD | 0.935 [0.926, 0.942] | 0.931 | 0.956 | 0.890 | 0.949 | 0.868 |
| LAD | 0.836 [0.824, 0.848] | 0.833 | 0.957 | 0.758 | 0.906 | 0.841 |
| LCX | 0.819 [0.809, 0.835] | 0.743 | 0.930 | 0.678 | 0.832 | 0.759 |
| RCA | 0.802 [0.788, 0.817] | 0.758 | 0.932 | 0.703 | 0.877 | 0.809 |
Calibration quality is reported through the Brier score. Repeated-CV values are 0.082 for CAD, 0.167 for LAD, 0.175 for LCX and 0.185 for RCA.
What the numbers say
- CAD and LAD are predicted well. CAD reaches a CV ROC-AUC of about $0.935$.
- LCX and RCA are harder, with ROC-AUC near $0.80$ to $0.82$. This makes sense because their stenosis is more weakly reflected in routine clinical features.
- Recall is deliberately high (above 0.93 in CV for every target). In a screening and decision-support setting, a missed stenosis is costlier than a false alarm, so we chose thresholds that favor sensitivity. The trade-off is lower precision and accuracy on LCX and RCA.
We also quantified how fragile single-split numbers are. Across 20 different holdout seeds, CAD ROC-AUC averaged $0.959 \pm 0.019$, and LCX averaged $0.888 \pm 0.034$.
Metrics used
$$\text{Precision}=\frac{TP}{TP+FP},\quad \text{Recall}=\frac{TP}{TP+FN},\quad F_1=\frac{2\,\text{Precision}\cdot\text{Recall}}{\text{Precision}+\text{Recall}}$$
Each artery's displayed color is a direct function of its predicted probability $\hat{p}_v$ for vessel $v \in {\text{LAD}, \text{LCX}, \text{RCA}}$:
$$\hat{p}_v = \sigma!\left(f_v(\mathbf{x})\right) = \frac{1}{1+e^{-f_v(\mathbf{x})}}$$
where $f_v$ is the boosted-tree ensemble for vessel $v$ and $\mathbf{x}$ is the preprocessed patient vector. SHAP decomposes the log-odds additively:
$$f_v(\mathbf{x}) = \phi_0 + \sum_{j=1}^{M} \phi_j$$
so every bar in the dashboard is one $\phi_j$ and together they sum exactly to the model's output.
What we learned
- Leakage is the easiest way to fool yourself. Fitting scalers or SMOTE before splitting, or keeping
Cathin the inputs, produces beautiful but meaningless scores. Moving every fitted step inside the CV fold changed our numbers, and made them honest. - A single holdout split is not a result. On 76 rows the holdout swung widely depending on the seed. Repeated CV with confidence intervals gave a much more trustworthy picture, so we report both.
- Overfitting needs measuring, not guessing. We tracked the train-to-CV AUC gap per target and tested several regularization settings. None beat the production configuration by more than one standard deviation, so we kept the model and documented the experiments rather than chasing noise.
- Explainability is a product feature. Aggregating one-hot SHAP values back to clinical variables made the dashboard readable for non-ML users.
- Design for honesty. A medical-adjacent tool should state its limits loudly. The disclaimer is part of the UI, not a footnote.
Challenges we faced
- Small, single-center data. 378 patients can't support claims about other hospitals or populations. We report resampling intervals, not external-validation intervals, and say so.
- Overfitting on LAD, LCX and RCA. Their train-to-CV AUC gaps exceeded 0.10. We tested stronger L2, shallower trees and heavier subsampling, and found that gap reduction came at the cost of CV AUC.
- Recall vs. precision. Choosing thresholds for high sensitivity makes LCX and RCA predictions fire more often. We made this explicit in the metrics view rather than hiding it.
- Mapping tabular features to 3D anatomy. The dataset has no imaging, and
Region RWMAis not a lesion coordinate. So the 3D heart shows vessel-level risk, not lesion location, and we label the geometry as schematic. - Keeping the 3D scene light. The requirement was responsive interaction without a dedicated GPU. We used a ~150 KB low-poly GLB with no post-processing.
- Keeping metrics consistent across files. As experiments piled up, we wrote a consistency-check script so the README, metadata and metric CSVs can't silently disagree.
Limitations and honest caveats
- Trained on one dataset from one center; performance elsewhere is unknown.
- Predictions are probabilities from clinical features, not imaging findings. They cannot localize a lesion.
- The 3D anatomy is schematic. Color encodes vessel-level probability only.
- LCX and RCA performance is moderate; treat those outputs with extra caution.
- Not clinically validated and not for patient care decisions.
What's next
- External validation on independent cohorts
- Probability calibration (isotonic / sigmoid) and uncertainty intervals on each vessel
- Integration of CT angiography or echo imaging to move from vessel-level to segment-level mapping
- A richer anatomical model (BodyParts3D torso, coronary branches such as diagonals and obtuse marginals)
- Counterfactual "what-if" sliders, e.g. how risk changes if LDL or blood pressure improves
- Multi-language support and a clinician-friendly PDF report
Try it
Prerequisites: Python 3.10+, Node.js 18+, no GPU required.
# Backend (port 8000)
cd backend
python -m venv .venv && source .venv/bin/activate   # Windows: .venv\Scripts\activate
pip install -r requirements.txt
uvicorn main:app --reload --port 8000

# Frontend (port 5173)
cd frontend
cp .env.example .env
npm install
npm run dev
Open http://localhost:5173, accept the disclaimer, pick a sample patient and click Analyze.
- GitHub: https://github.com/Abishek-kk/AortaVision-3D
- Demo video: https://youtu.be/zUAk5TRVFlQ?si=iRCgu60ho9crHoPd -Test_data_set:https://drive.google.com/drive/folders/1pkSi1s7Asv6VUxtzEmuS_1Ni-Wotv_y_?usp=sharing
Built with
Python · XGBoost · scikit-learn · imbalanced-learn · SHAP · FastAPI · Pydantic · React · Vite · Tailwind CSS · React Three Fiber · Three.js · glTF/GLB · Z-Alizadeh Sani dataset (UCI)
Team Accelerate
ABISHEK.K, GAURI, GAURIKA
Built With
- ai
- javascript
- ml
- notebook
- python
- react

Log in or sign up for Devpost to join the conversation.