-
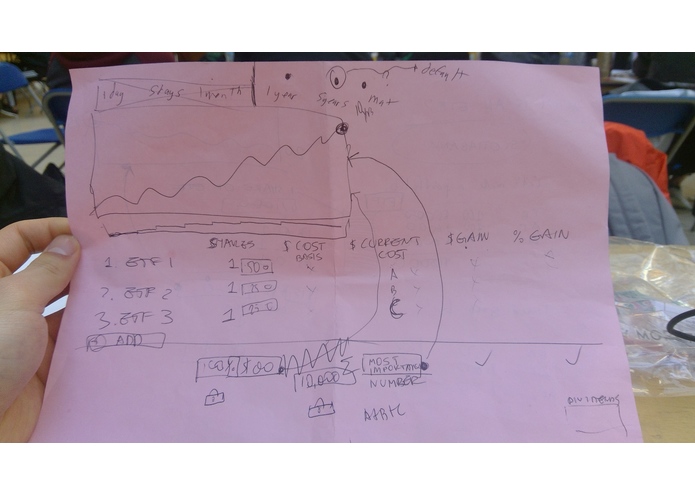
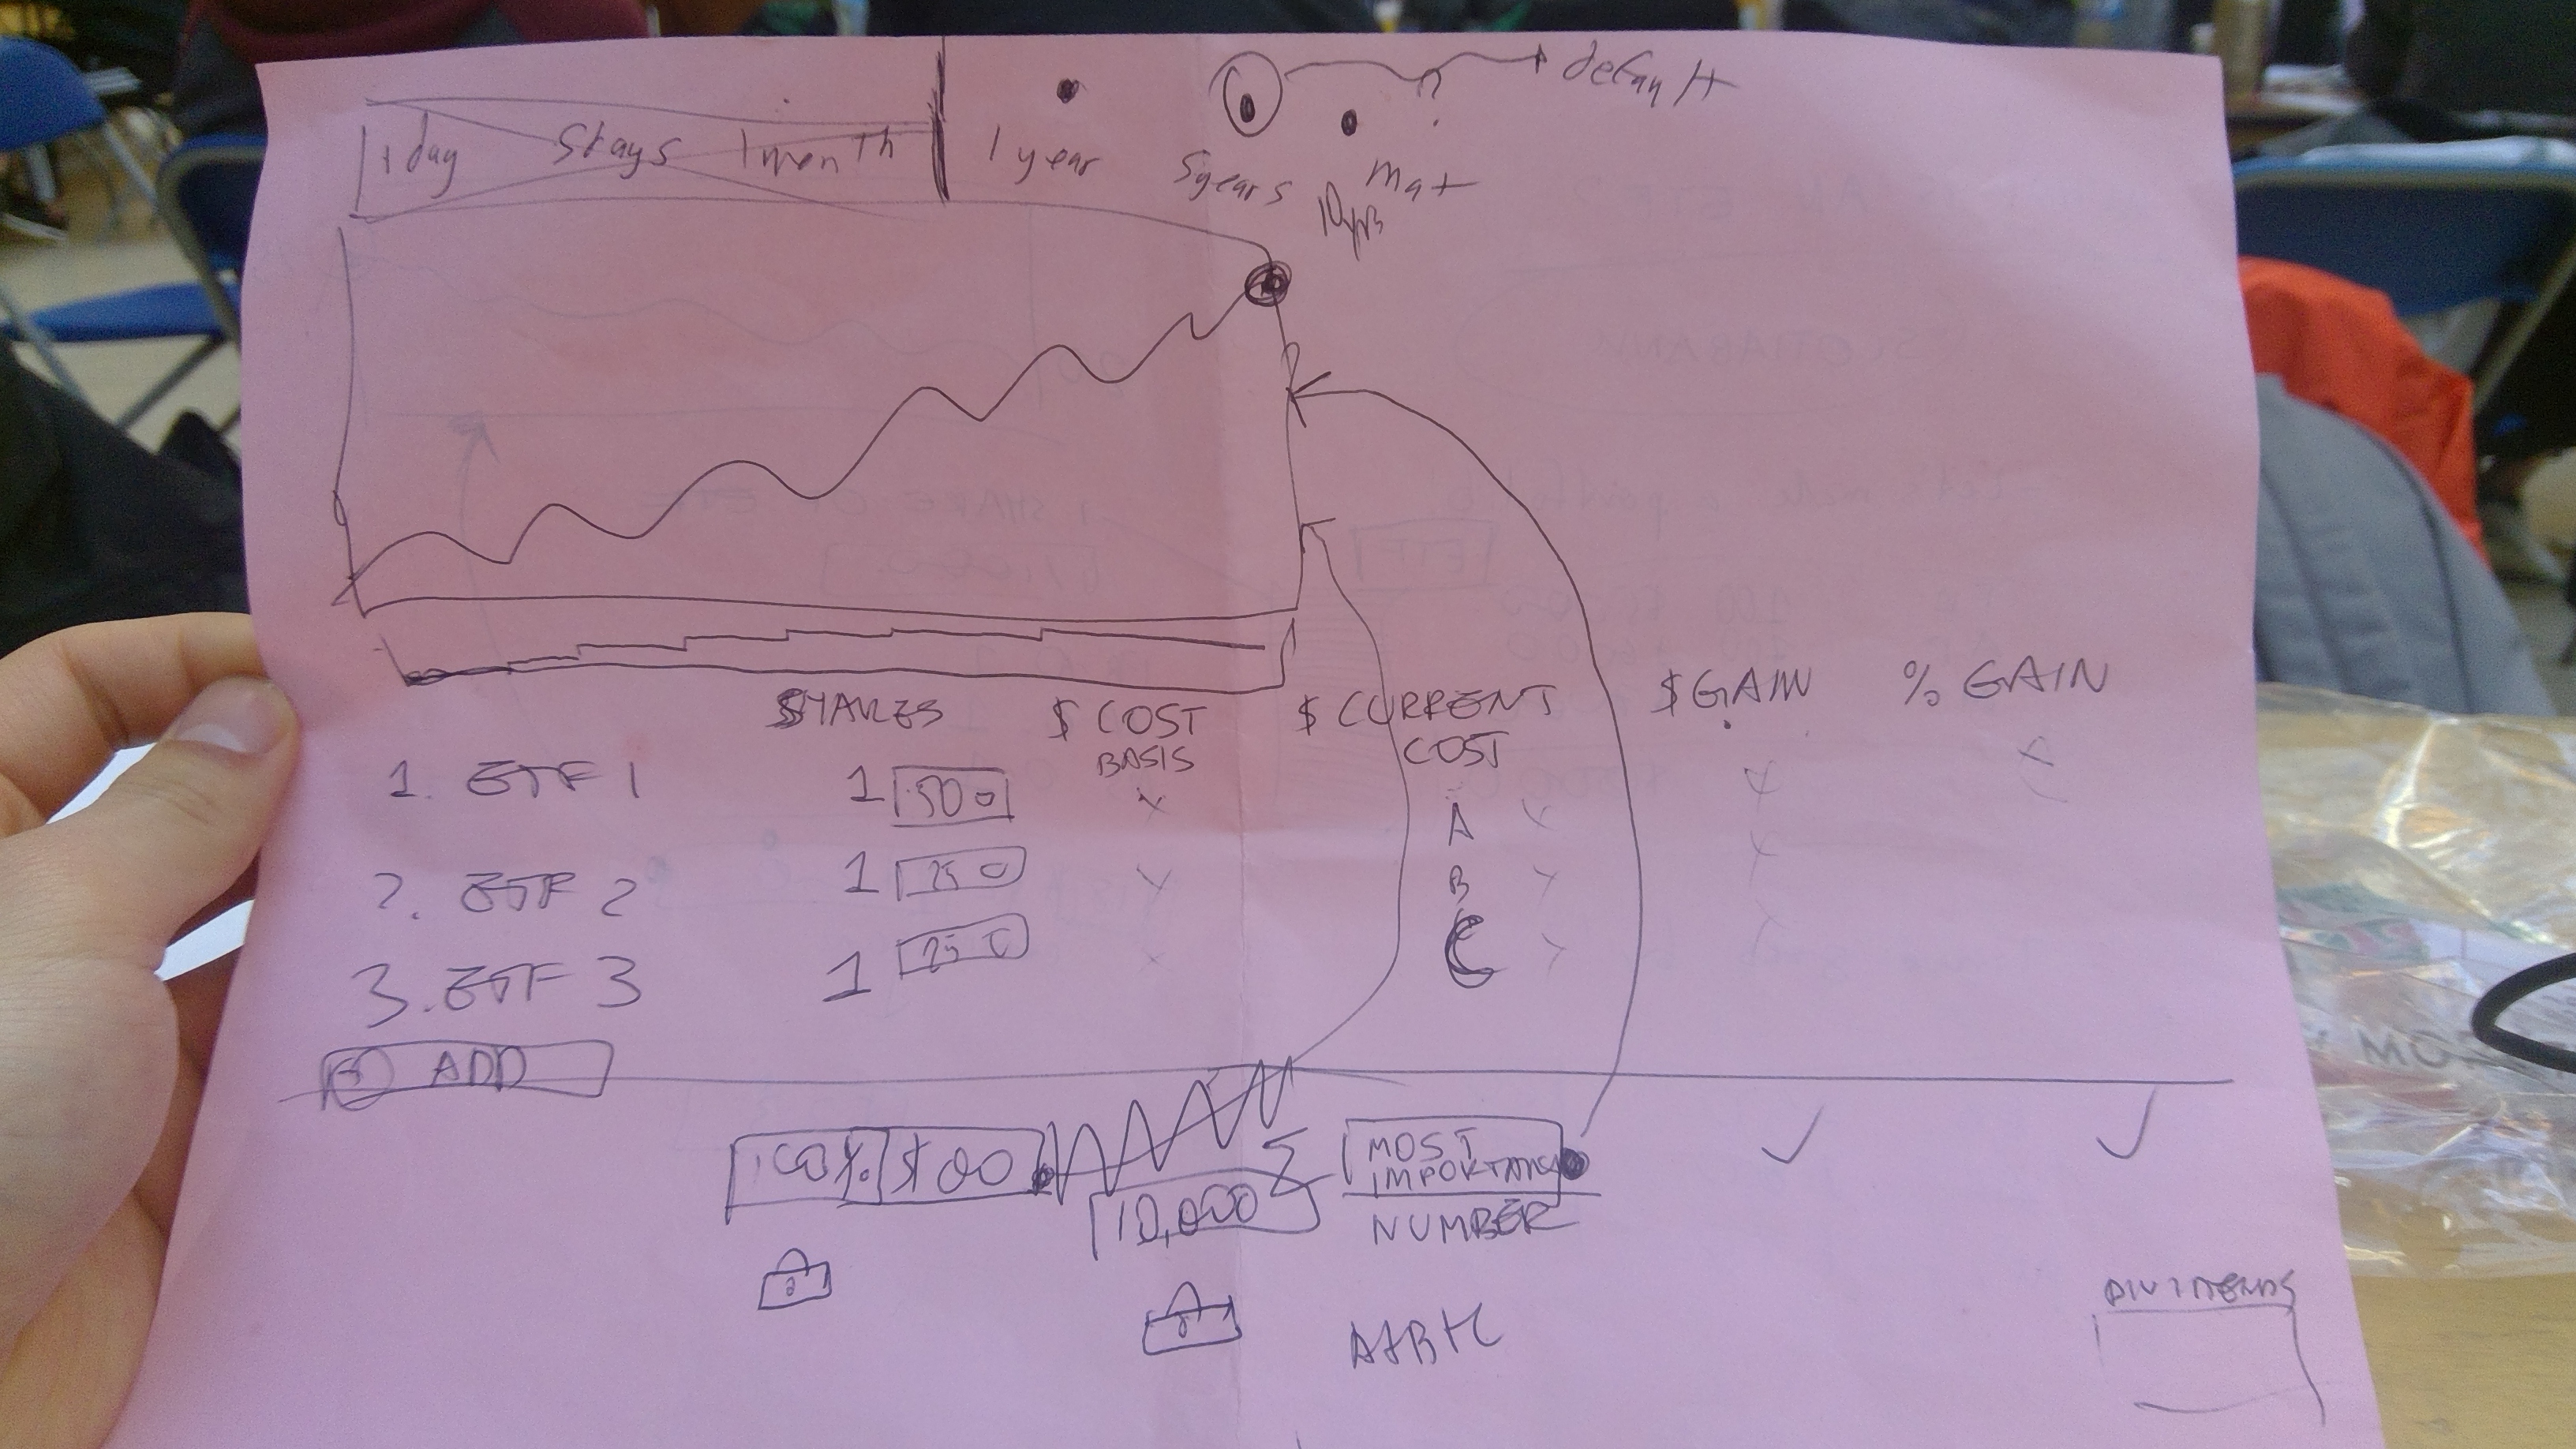
Draft of Final Product
-
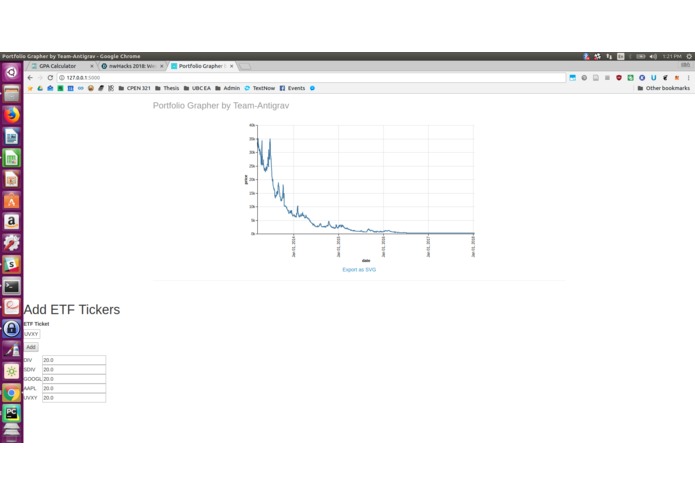
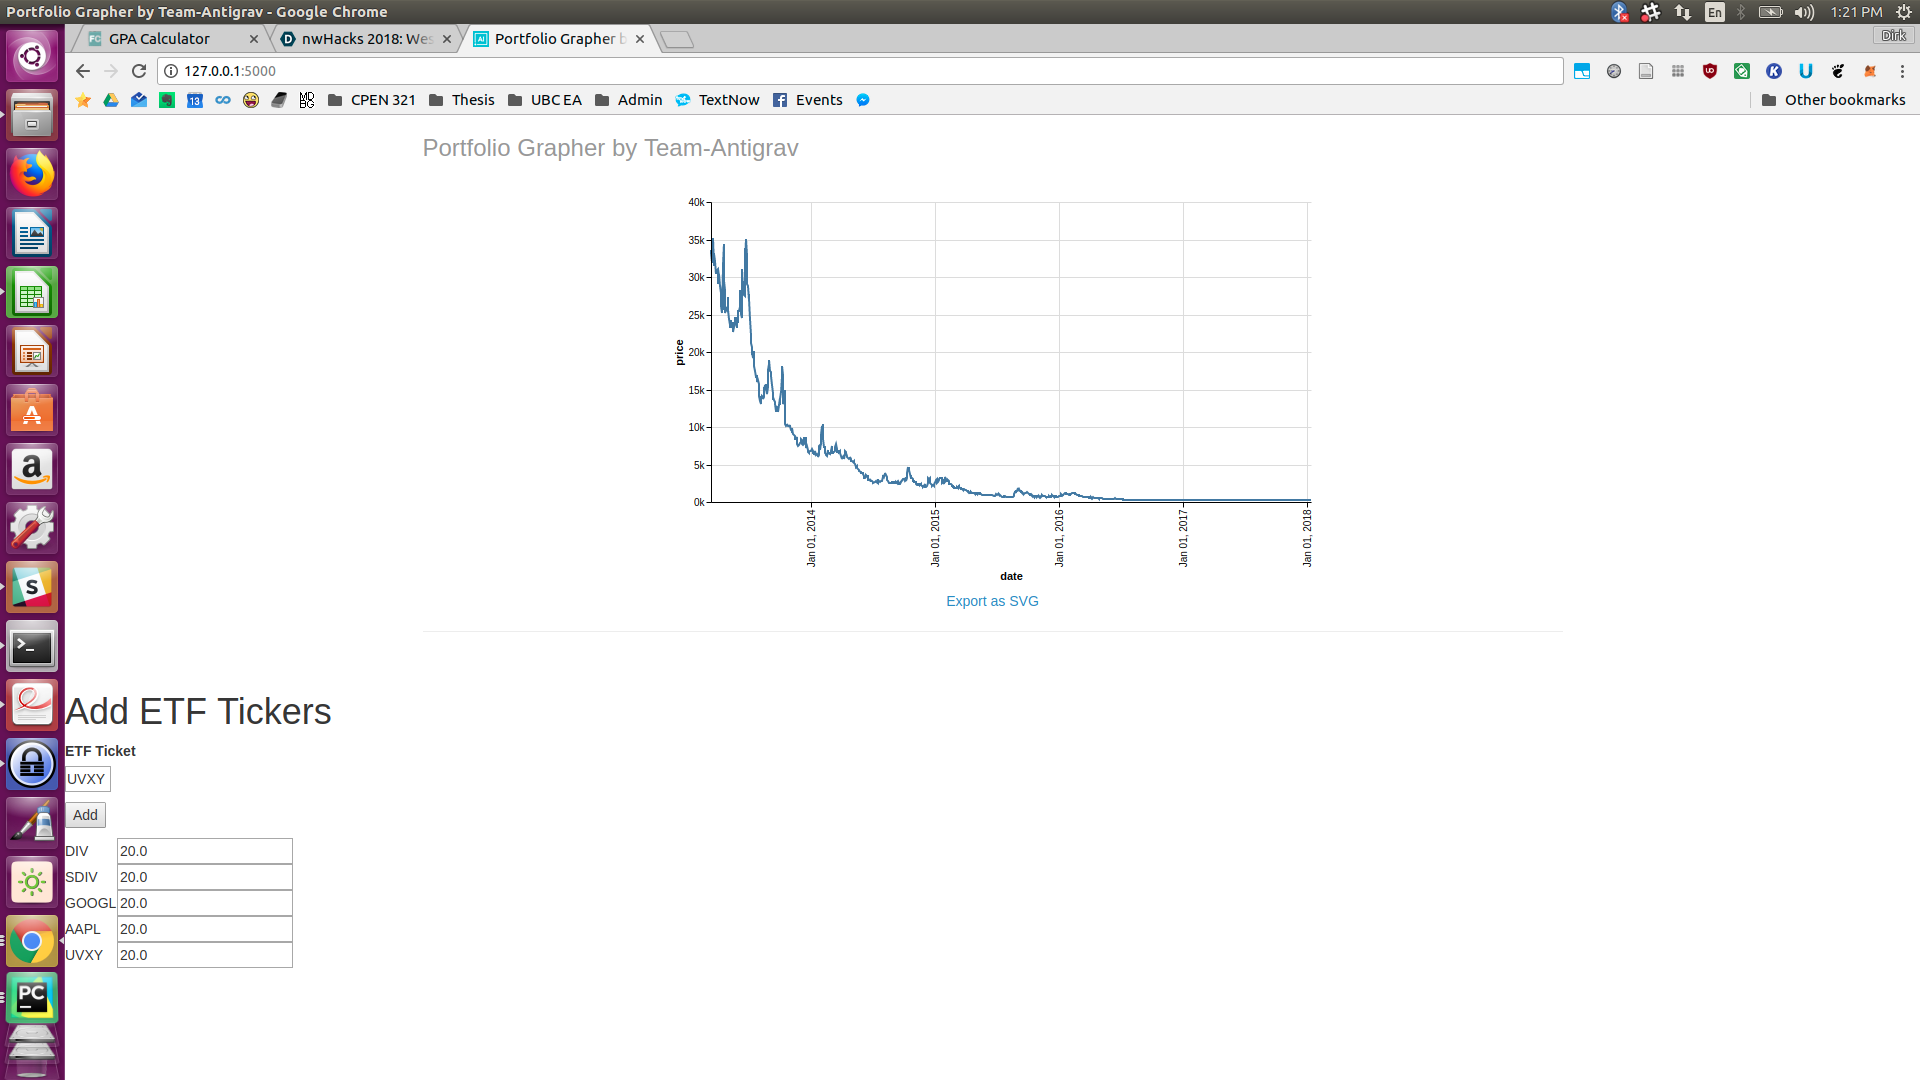
Working Application
Inspiration
Antigravity Investments, a San Francisco based startup, was looking for assistance on their flask-based web application. They developed technology that enables effective, low-cost investment management for the charitable sector which can drive millions to billions for dollars to social causes. They are the first firm to provide automated investing services to the charitable sector. We were intrigued by their technology that allows them to replace trillion-dollar financial products such as mutual funds and exchange-traded funds (ETF) with code and were glad to give it a shot!
What it does
The app is a backtest that displays financial performance data for a portfolio consisting of one or more ETFs with different weights. Time is on the x axis and price is on the y axis. Rather than a predictor, the application displays how an ETF portfolio would have performed over the past X years, going as far as the data will go. When more than one ETF is selected, the starting point on the line graph is the earliest day all the data is available, at which point, the adjusted ETF closing data for each ETF is added and plotted. This process is repeated with each available day. The application will also take into account the cumulative dividend for all ETFs. The necessary backend code for computing closing prices and gains/losses is the difference between the most recent and oldest adjusted closing prices. is available but not yet represented on the front-end.
How I built it
We used a stack consisting of python, flask, html, javascript, a venv, and github.
Challenges I ran into
Many
Accomplishments that I'm proud of
Everything
What I learned
Lots
What's next for antigrav portfolio grapher
???

Log in or sign up for Devpost to join the conversation.