Inspiration🔭
As a team of physicists studying optics🔦 and astrophysics🚀, we wanted a project topic to mix our knowledge as well as to include our interests. While loosely thinking about how to link astrophysics and climate change, the idea💡 occurred: (We later discovered a paper had been published in Nature about this same topic!)
What we planned
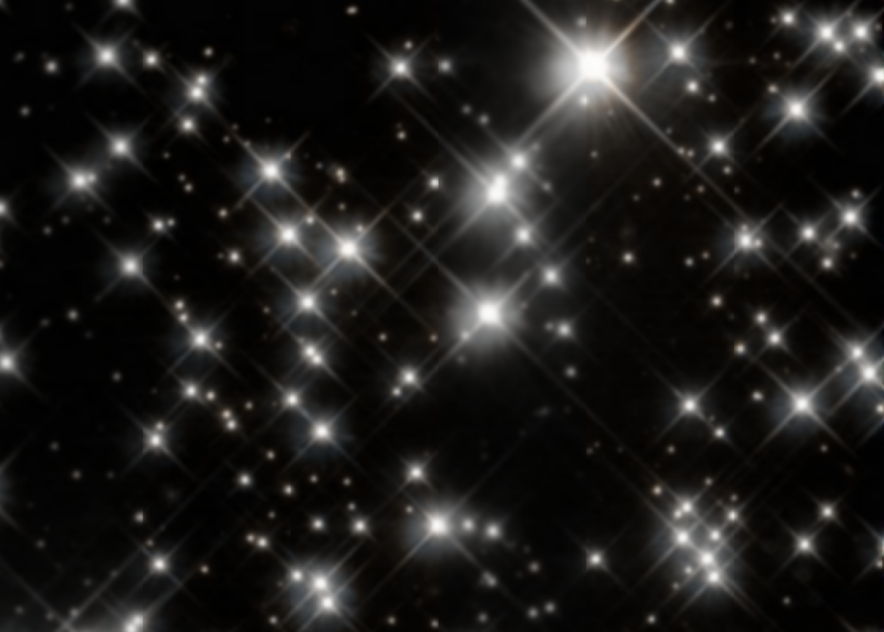
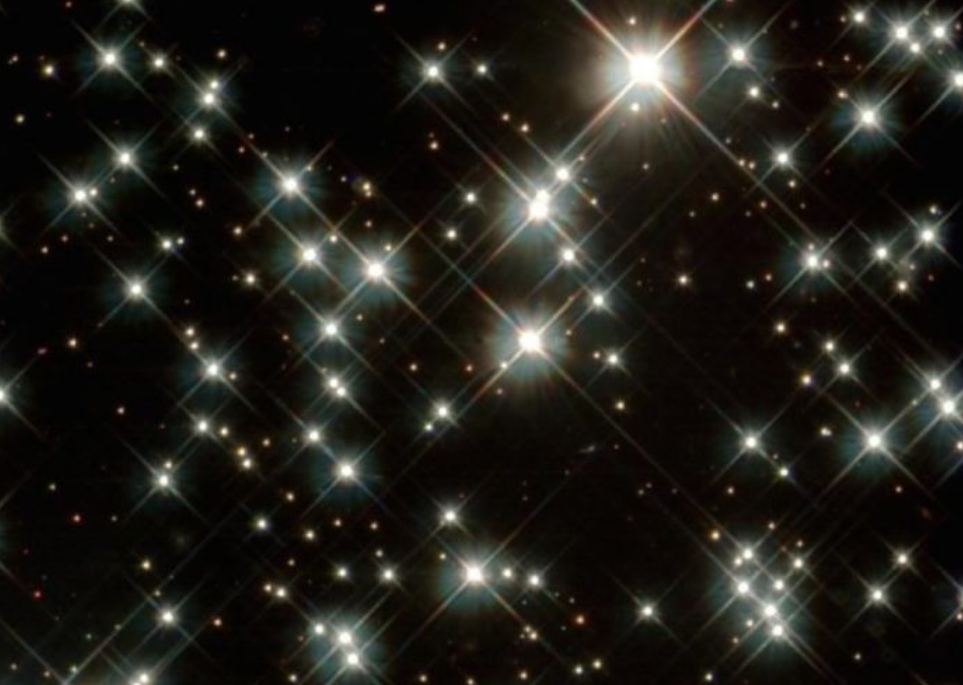
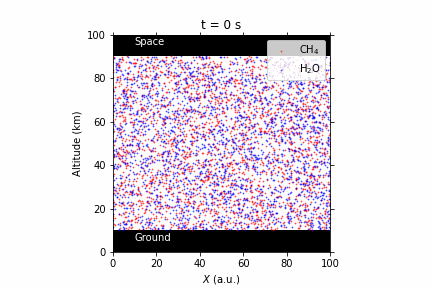
With predicted data for carbon dioxide, methane and water vapour concentration rise due to climate change, we wanted to simulate a small section of the lower atmosphere (troposphere). Considering this data, we could have a grid of a spatial profile of refractive indexes, which could allow us to analyze the travel of a starlight through the atmosphere to our observatories. With the different absorption and transmission rates throughout the grid, the change of flux could be calculated. We had planned to have a comparaison of an image of the night sky today, and one for the year 2100, where flux would be reduced.
VS what we were actually able to do..
We ended up only considering the effect of water vapour concentration, since we didn't end up having the time to calculate absorption and transmission at every point in the refractive index grid. We also show the impact of a lower resolution on observations of the sky, basing our methods on the refractive index grid.
How we built it
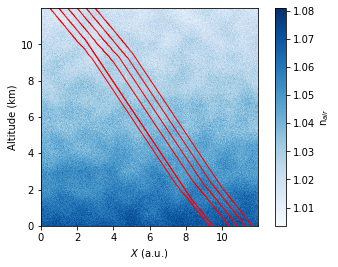
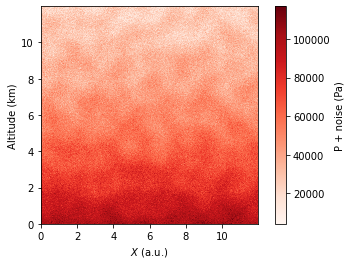
The first step was to establish both a 1D pressure profile and a temperature profile in function of the altitude. These profiles are then extended on a 2D grid, where we add local Gaussian noise as well as some turbulence to the pressure profile, to more closely ressemble a realistic atmosphere. With an equation which depends on the temperature, the pressure as well as the water vapour concentration, we can make a new grid: the refractive indexes for different positions. We then continued with ray tracing, which allows us to track the path a light beam will take when hitting different pixels in our grid, in an iterative manner.
Challenges we ran into
1) Building and working with a dynamical model of the atmosphere.
2)Building an efficient algorithm for ray tracing in a refractive index grid. We had to choose limit our analysis, as considering Fresnel refraction and critical angles added layers that were too complex for our time period.
Accomplishments that we're proud of
We're proud to have adapted our plan throughout the 24 hours to have a more realistic model, while also keeping it interesting enough that it is worth to be studied.
What's next for Another impact of climate change: astronomical observations
Continue on the steps we didn't have time to complete, and follow up on the Nature paper 😉


Log in or sign up for Devpost to join the conversation.