-
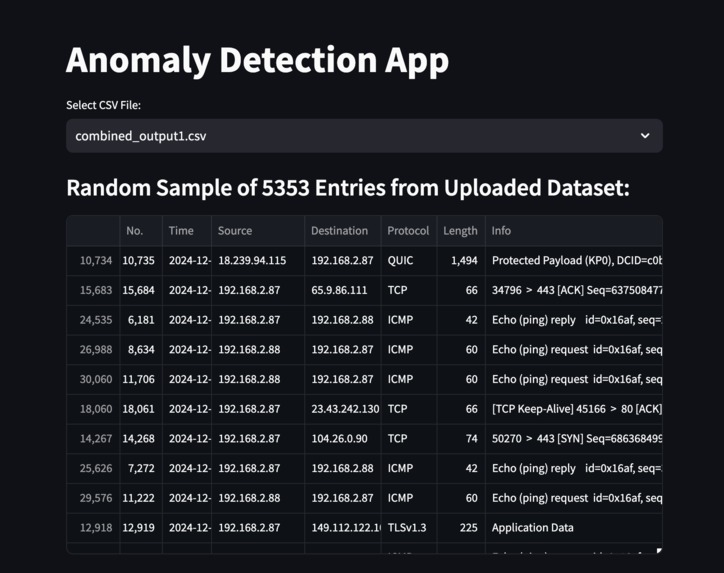
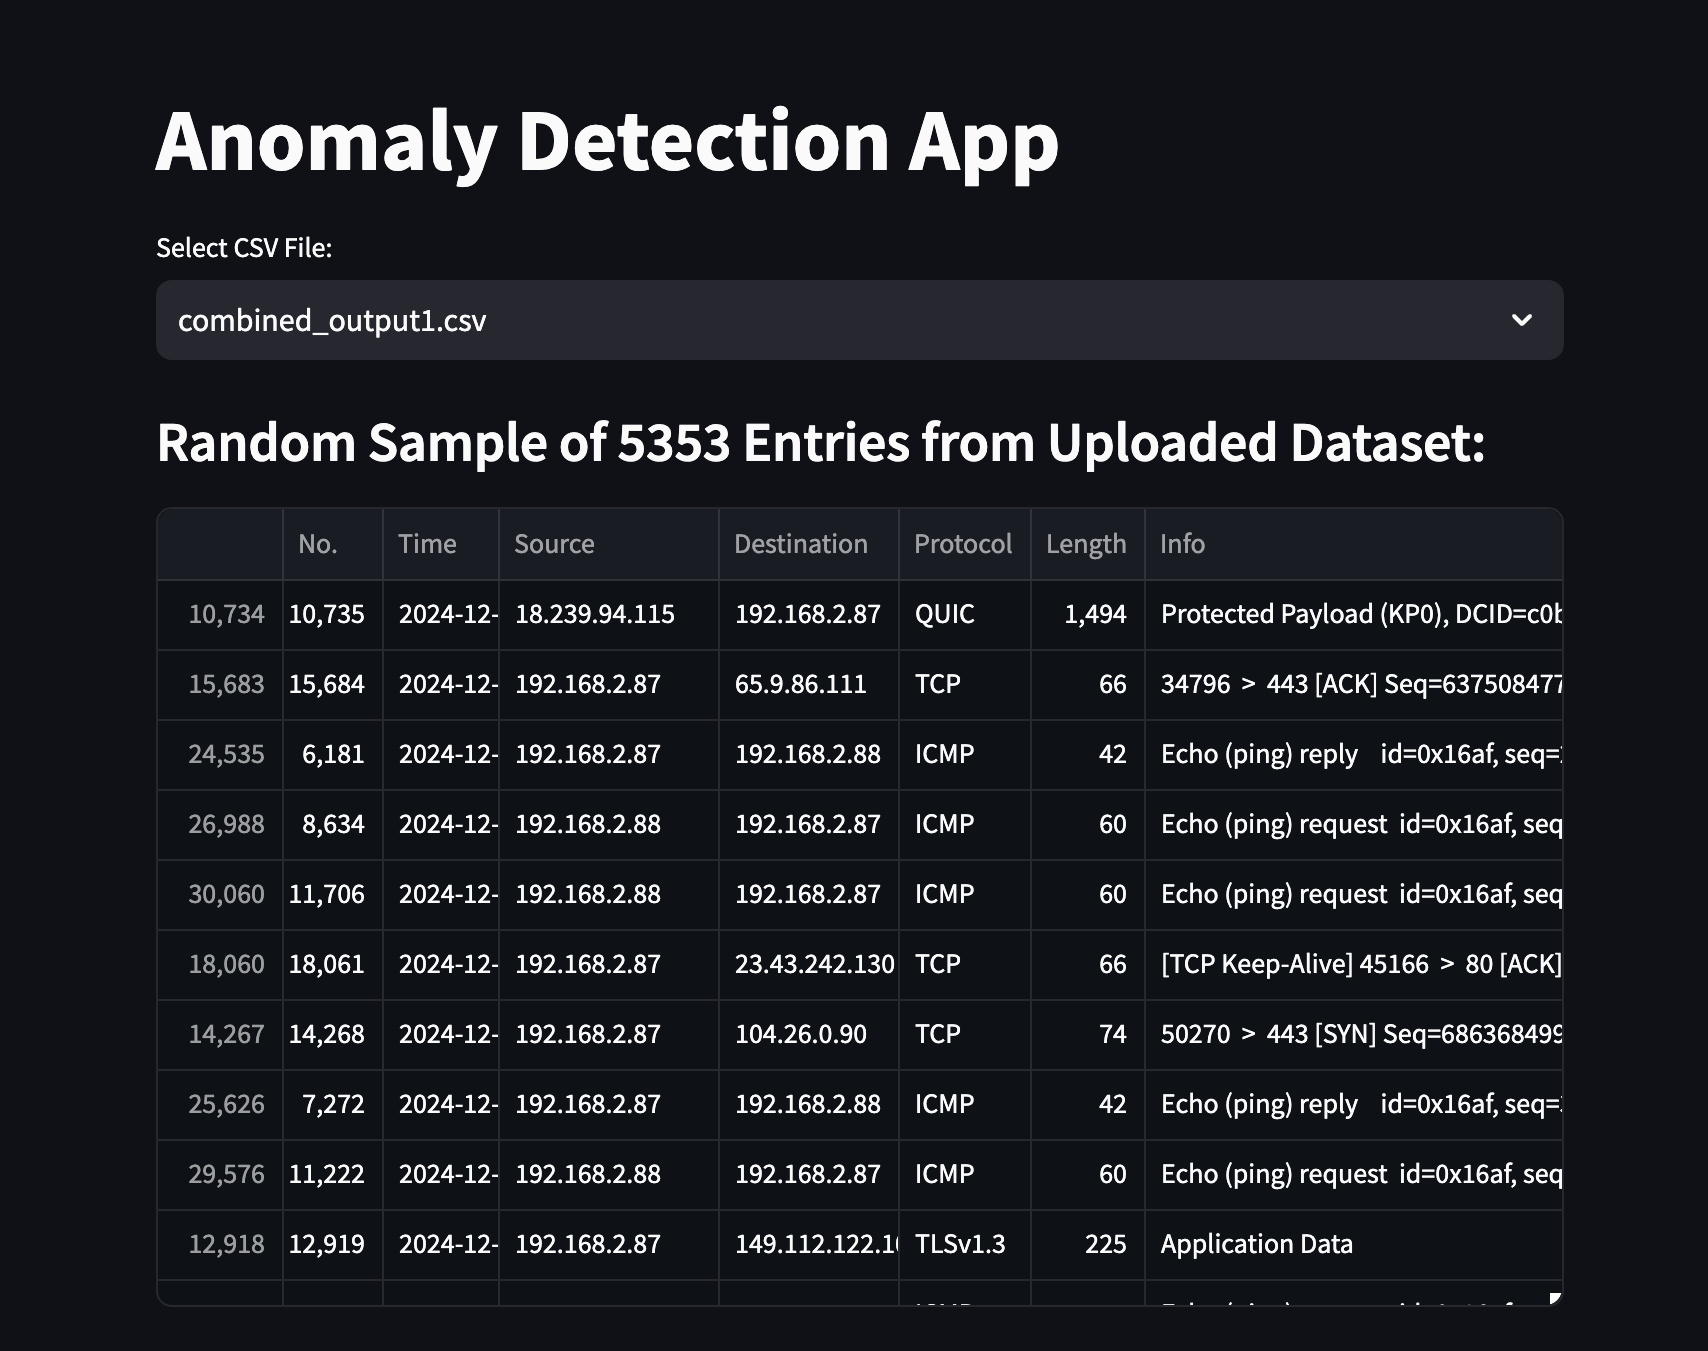
Integrated with streamlit to visualise results.
-
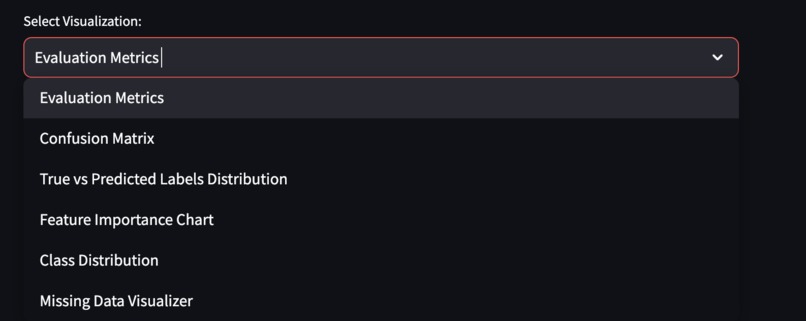
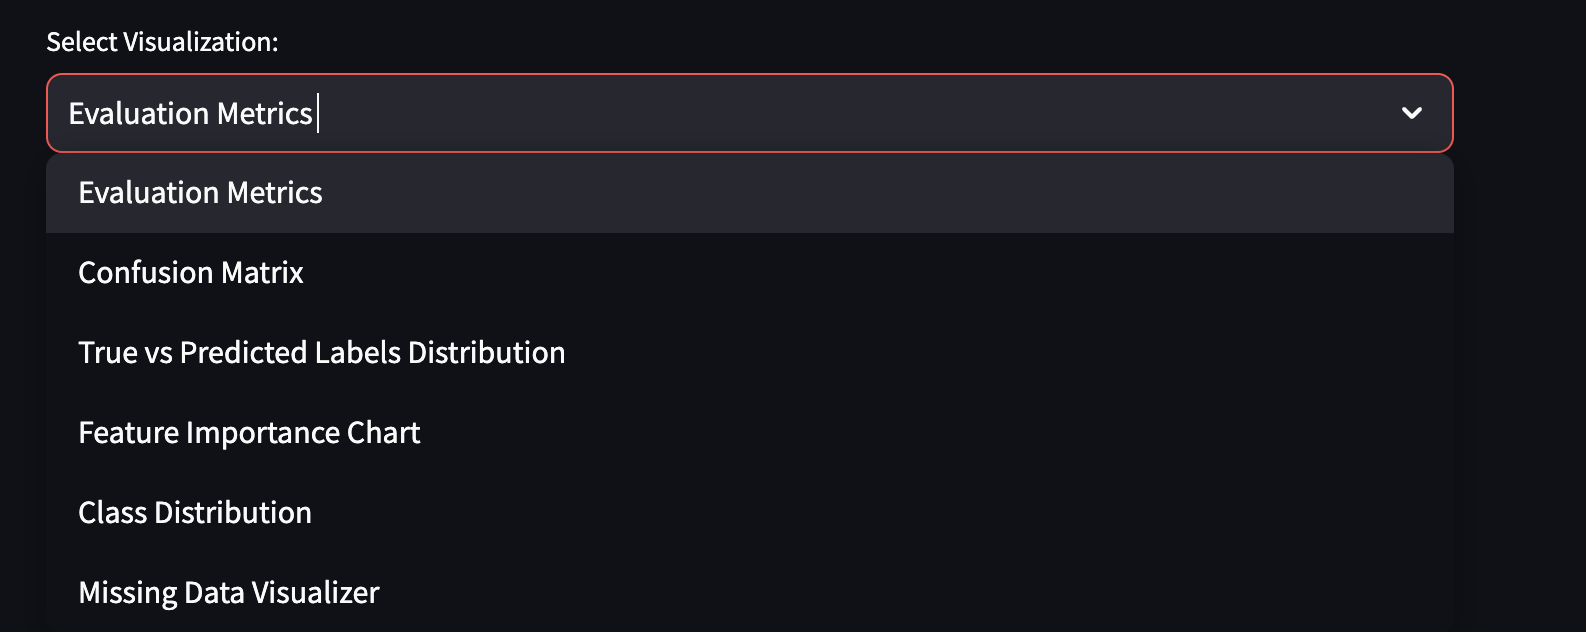
Selection of different visual evaluation tools.
-

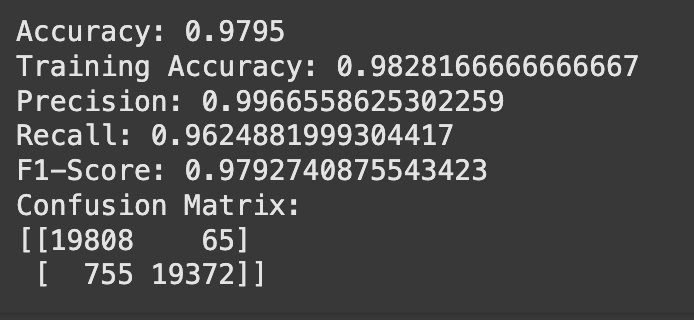
Evaluation metrics summary of model on train-test data.
-
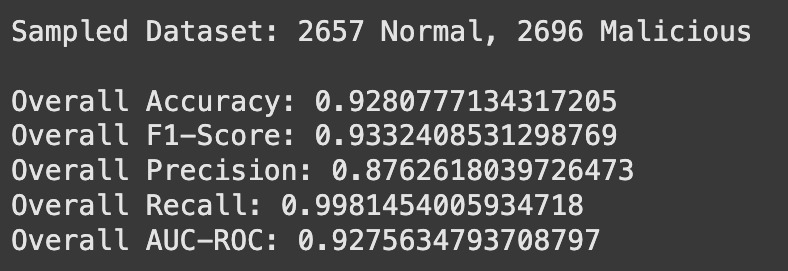
Evaluation metrics summary of model on "new" test data.
-
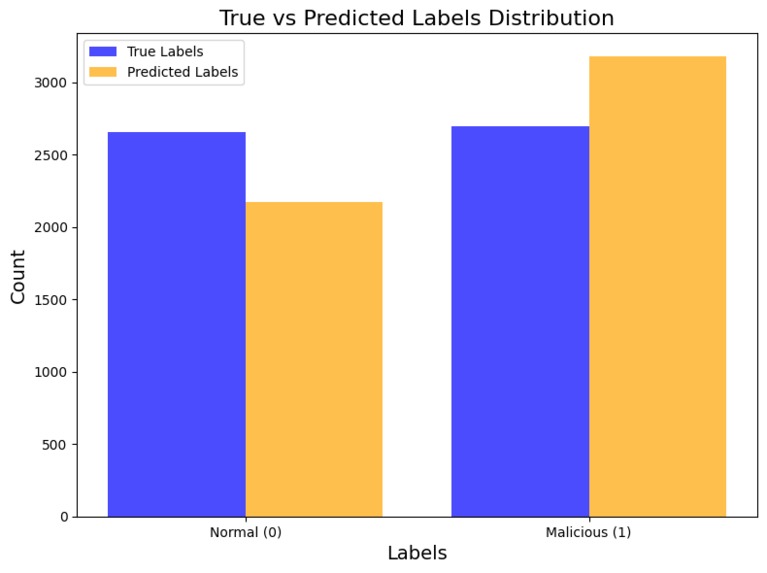
Shows how the true and predicted labels compare, highlighting model accuracy and bias.
-
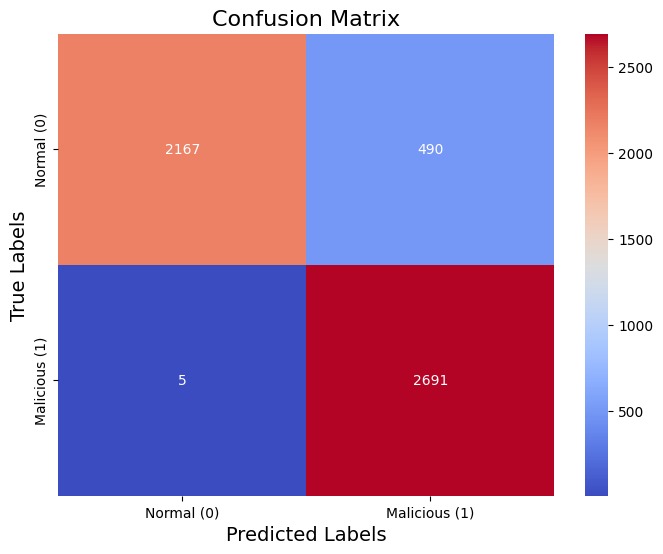
Displays the performance of the classification model, emphasizing false positives and false negatives.
-
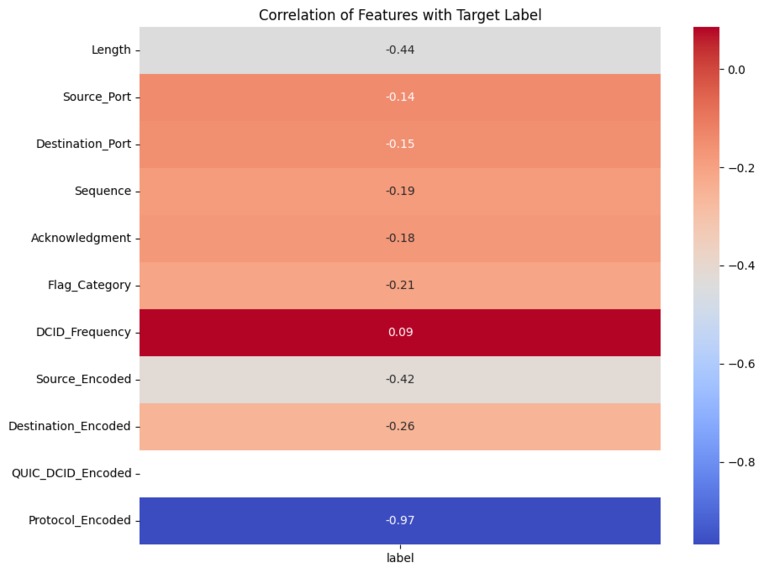
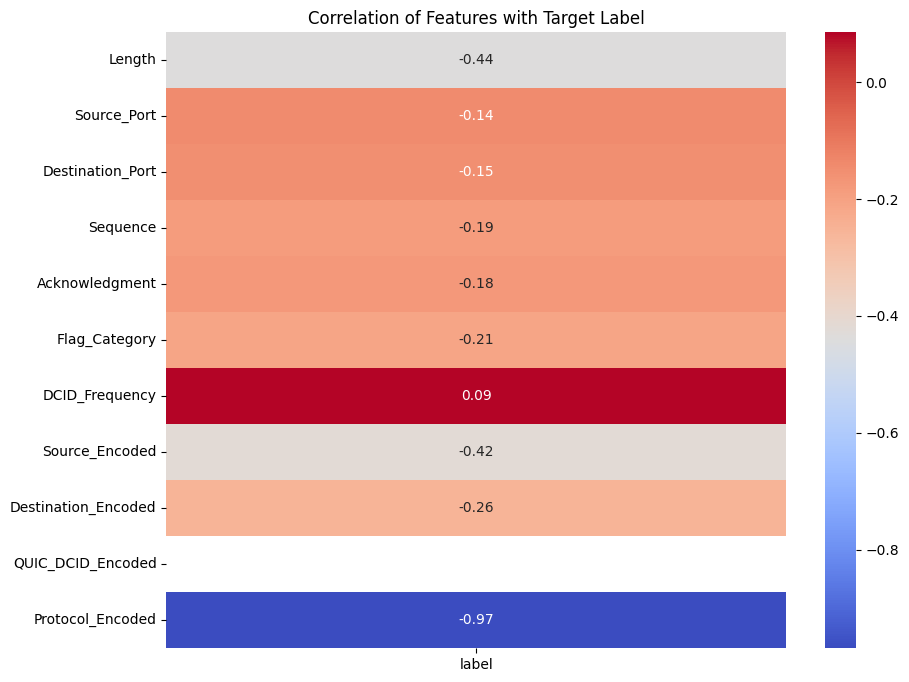
Highlights the correlation of features with the target label, showing the strongest predictors of malicious or normal traffic.
-
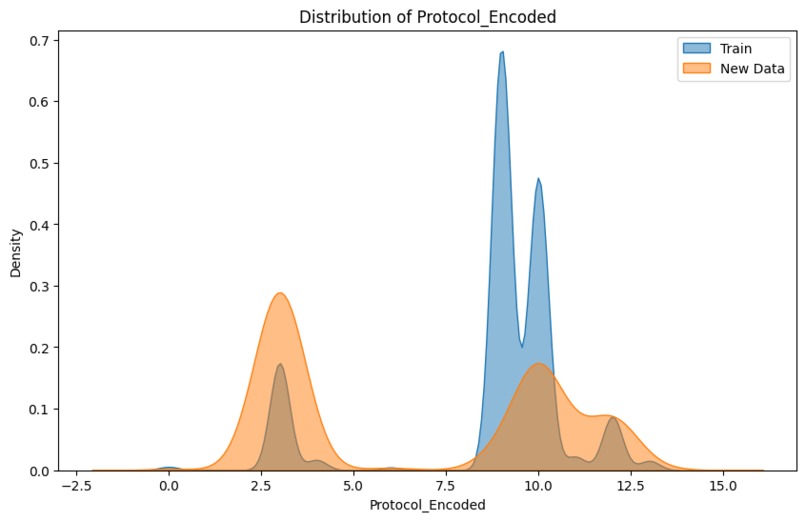
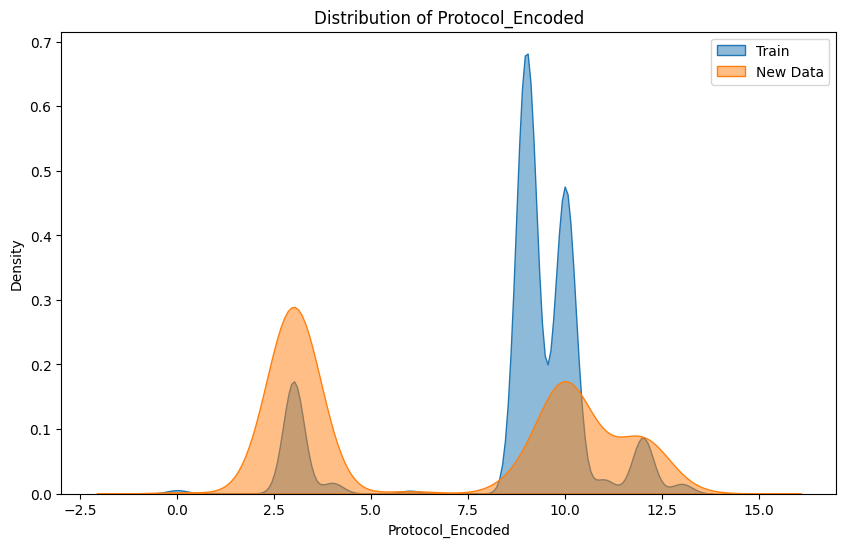
Compares the Protocol_Encoded distributions in training and new data, reflecting protocol usage patterns.
-
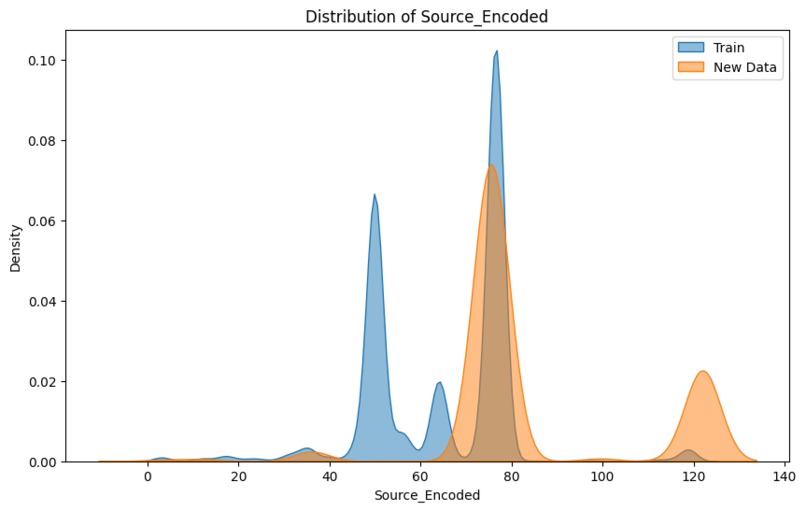
Visualizes the distribution shift in Source_Encoded between training and new data.
-

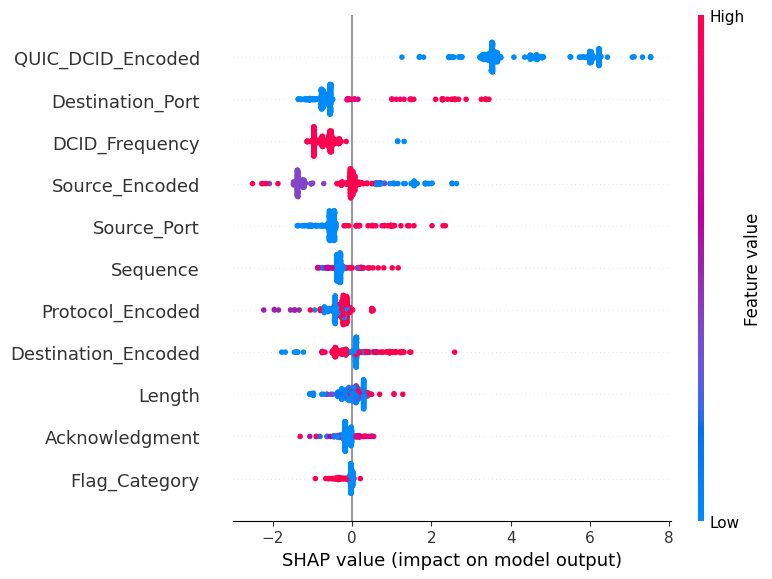
SHAP plot to highlight each feature's individual importance/contribution.


Inspiration
We always wondered how hackers manage to bypass systems and gain unauthorized access. It intrigued us to explore how cybersecurity professionals identify and classify these malicious activities. The quest to understand the factors that play a critical role in detecting attacks inspired us to build Anomalyze—a tool aimed at identifying malicious activity and distinguishing it from normal network traffic. This project became an opportunity to uncover patterns, distributions, and the intricate details involved in tracking attackers.
What it does
Anomalyze evaluates network connections using 13 critical features such as source and destination IPs, packet lengths, frequencies, and protocols. By analyzing these factors, the tool learns patterns in normal and malicious network traffic to classify them effectively. To ensure the highest sensitivity, our model is designed to prioritize security, even if it means flagging normal connections as malicious, to minimize false negatives and avoid overlooking potentially harmful activity.
How I built it
To bring Anomalyze to life, we simulated multiple types of attacks, including Distributed Denial-of-Service (DDoS), Remote Access Trojan (RAT), Man-in-the-Middle (MITM) attacks, and IP spoofing. These simulations helped us create a dataset of over 300,000 entries with detailed information about each connection.
Using this dataset, we trained a voting classifier that combines the strengths of LightGBM and Random Forest. To ensure high performance, we cross-validated the model, conducted hyperparameter tuning, and evaluated it on metrics like accuracy, precision, recall, and F1 score. Finally, the model was tested against new simulated attacks to verify its robustness and sensitivity.
Challenges I ran into
One of the key challenges we faced was that the training data captured specific distributions for features like packet length and frequency, while the test data exhibited significant deviations. To address this, we implemented data augmentation techniques such as adding noise and shuffling categorical values, making the model more adaptable to unseen data. Another significant challenge was realizing that our simulated attacks did not always represent real-world scenarios. Features like source and destination IPs, as well as packet lengths, lacked the variability seen in actual attacks. This mismatch led to false negatives, which we identified and mitigated using tools like SHAP and permutation importance to adjust the model and retrain it for improved performance.
Accomplishments that I'm proud of
Anomalyze successfully minimizes false negatives, ensuring high sensitivity to potentially harmful activity. We incorporated advanced tools like SHAP and permutation importance to gain a detailed understanding of each feature’s role in explaining the target, enhancing our model’s interpretability. Additionally, the model achieved high accuracy and balanced performance across other metrics like precision, recall, and F1 score, reflecting its robustness.
What I learned
This project gave us a deeper understanding of the importance of feature engineering in building effective classification models. It also taught us how to leverage SHAP and permutation importance to investigate and visualize feature contributions, providing valuable insights into model behavior. Moreover, we learned the importance of simulating real-world variability to improve the generalization of the model and the critical role that features such as protocols and port numbers play in detecting malicious activity.
Key Takeaways/Analysis of Findings
We observed that protocols emerged as one of the most critical factors in predicting malicious activity, as attackers rarely employ a diverse set of protocols, relying instead on a few well-known ones that support their malicious operations. This aligns with the theory that attackers prioritize stealth and efficiency, often choosing protocols that enable rapid exploitation while minimizing their chances of detection. For example, malicious traffic often avoids standard secure protocols like HTTPS in favor of less-regulated ones.
Higher source IP addresses (Source_Encoded) were generally associated with normal traffic, while higher destination IP addresses (Destination_Encoded) were also linked to normal activity. This supports the theory that normal network behavior typically involves a wide range of IPs at both source and destination ends, such as connections from dynamic IP pools of legitimate users to cloud servers or service endpoints. Malicious traffic, on the other hand, tends to concentrate on specific IP blocks or use low-range, less-dynamic IP addresses, as attackers often leverage compromised devices or fixed systems for their operations.
Packet length showed a significant relationship with the target label, with shorter packets being more indicative of malicious traffic. This aligns with known attack patterns where attackers send minimal data (e.g., ping floods or request-based attacks) to probe systems or exploit vulnerabilities while avoiding detection by large data transfers that might raise suspicion.
Port numbers also provided key insights, with higher port numbers frequently associated with malicious activity. This observation fits theoretical expectations, as lower ports are typically reserved for system or application-level processes, such as HTTP (port 80) or SMTP (port 25), which are less likely to be misused directly in attacks. Conversely, higher ports are often used in malicious operations to disguise traffic or communicate with compromised systems, especially during attacks like botnet communications.
QUIC_DCID_Encoded emerged as another highly significant feature. This likely reflects the fact that attackers often use unusual or irregular identifiers in their QUIC-based connections to bypass traditional inspection mechanisms. This aligns with the theory that attackers exploit the flexibility of modern protocols to introduce variability, making their activity harder to classify based on predefined rules.
These findings reinforce the theoretical understanding of malicious behavior in networks: attackers exploit predictable behaviors (e.g., using limited protocols, higher ports, or fixed identifiers) to achieve their objectives while trying to evade detection mechanisms. By leveraging these theoretical foundations, the model successfully prioritizes features that distinguish normal from malicious traffic.
What's next for Anomalyze
What’s Next for Anomalyze
Looking ahead, we aim to enhance Anomalyze by refining its outputs to include probabilities instead of binary classifications (0 or 1). Providing a probability score for each connection's likelihood of being malicious would give network administrators greater flexibility in determining thresholds for action based on their specific risk tolerance. This could make the tool more adaptive to real-world scenarios where the severity of a misclassification varies.
Another significant area of improvement is addressing the high rate of false positives. While our model is deliberately sensitive to minimize false negatives, we recognize that excessive false positives can overwhelm analysts and reduce trust in the system. To tackle this, we plan to train the model with a more diverse dataset that incorporates greater variability in key features such as packet length, frequency, and protocol usage. By exposing the model to more real-world-like distributions, we hope it will better understand and generalize the underlying patterns in malicious versus normal traffic.
Additionally, integrating feature-level explainability into real-time predictions could allow users to understand why a specific connection was flagged, helping them make informed decisions about handling flagged connections. We also plan to explore the integration of additional context, such as geographical or temporal data, to improve the model's ability to detect sophisticated attack patterns.
These enhancements will make Anomalyze not only more accurate and adaptable but also a practical tool that can provide actionable insights to better secure networks in an ever-evolving threat landscape.

Log in or sign up for Devpost to join the conversation.