Inspiration
Most forecasting models learn from normal markets. Then a crash comes, the world looks like nothing in the training data, and the model fails exactly when people need it most.
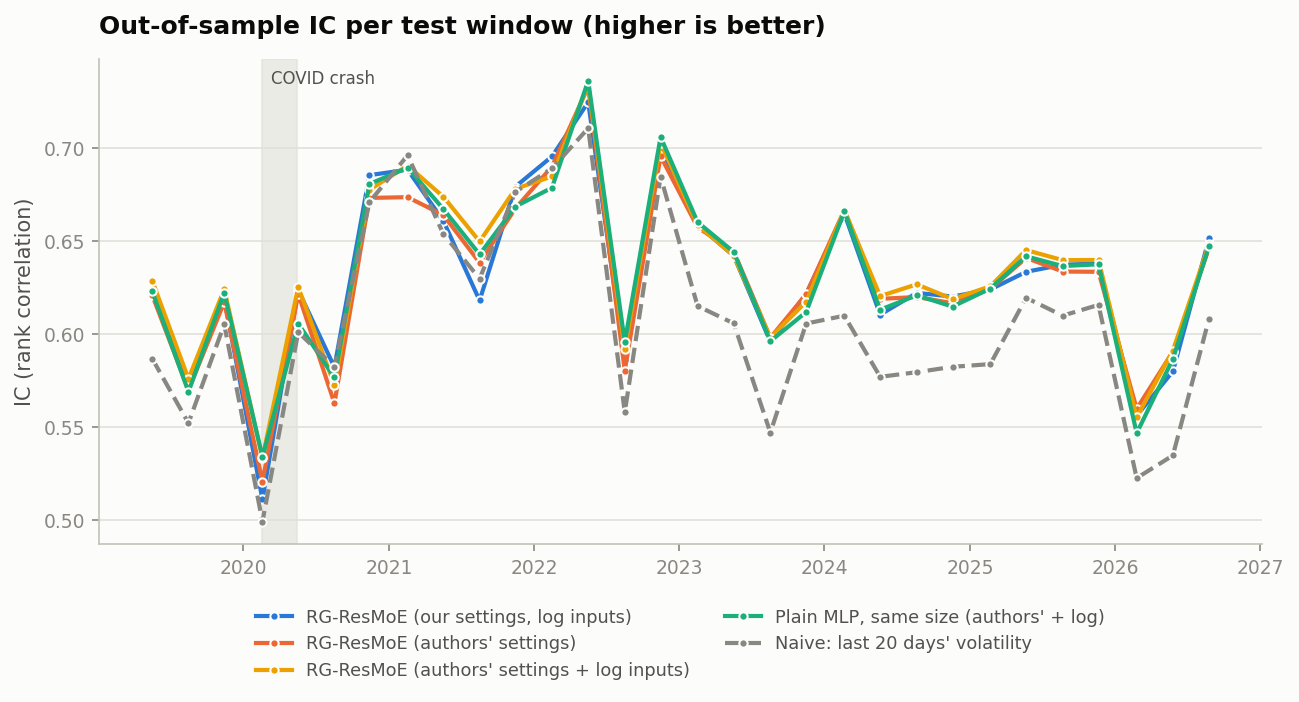
We wanted to see this happen, not just read about it. We picked RG-ResMoE, a 2026 research model for forecasting volatility (Ye & Borde, arXiv:2608.12251), and replayed it through the COVID crash. It broke, in a way we could measure. That raised the question behind the whole project: can we make a volatility model that holds up in a crash, and an app that shows people how far to trust it?
What it does
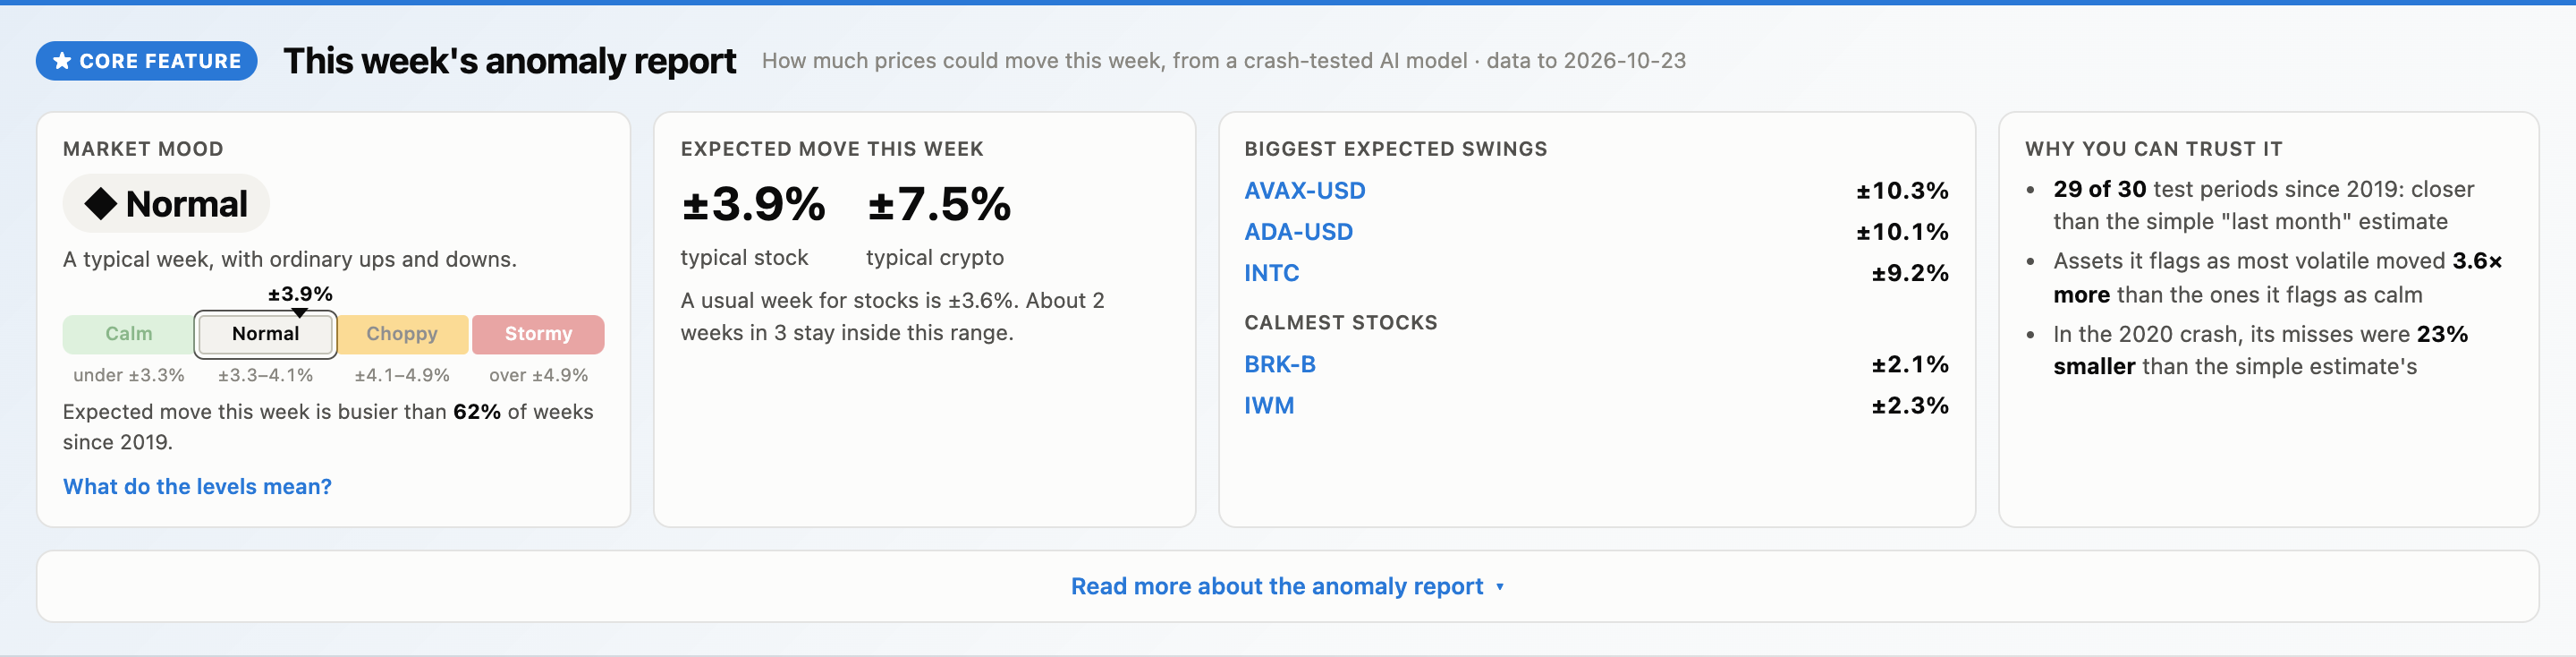
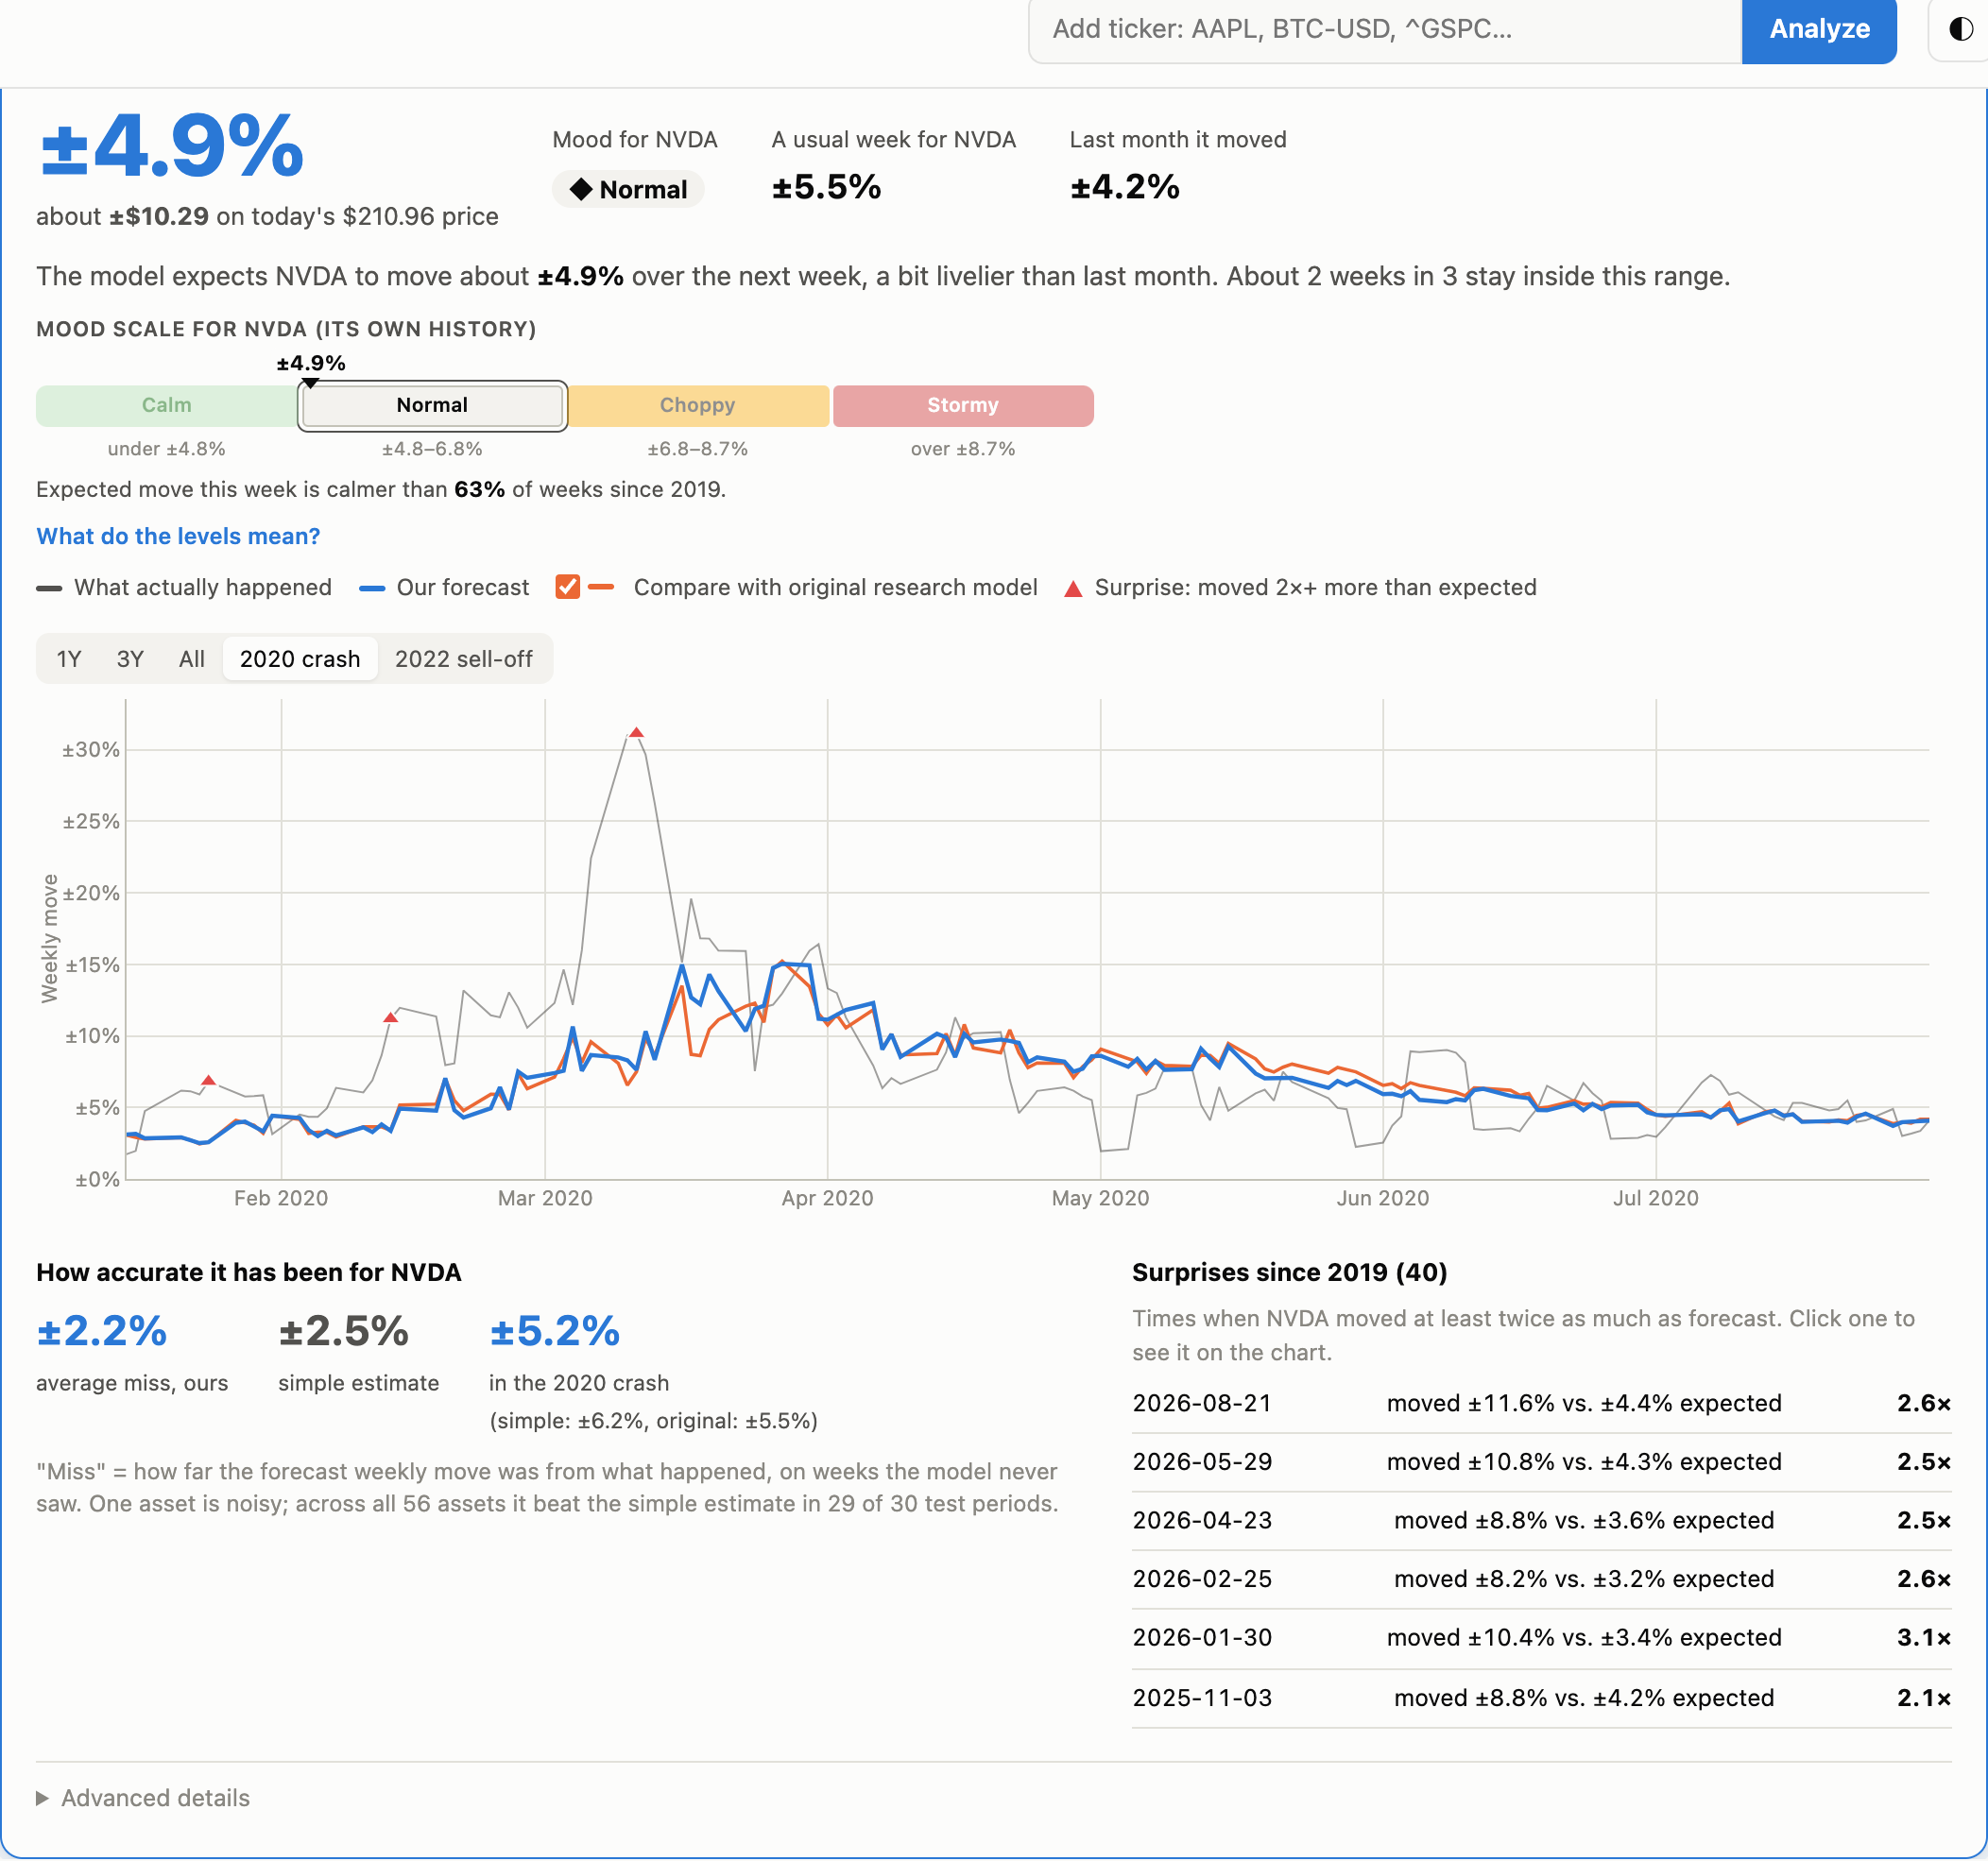
Anomality is a weekly anomaly report for 56 stocks, ETFs and crypto assets. It answers one question in plain units: how much could prices move this week? For example, "±3.9% this week" or "about ±\$10.29 on today's \$210.96 price".
- Market mood: Calm, Normal, Choppy or Stormy, with a scale showing what each level meant historically and when the market was last there.
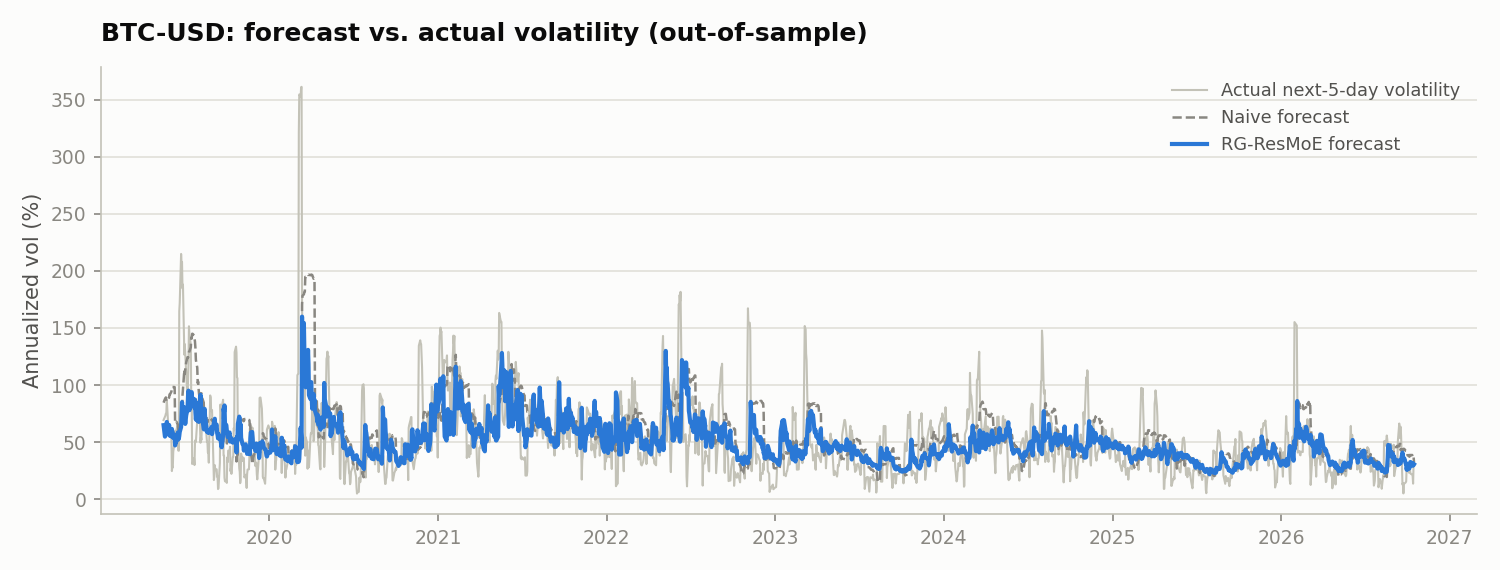
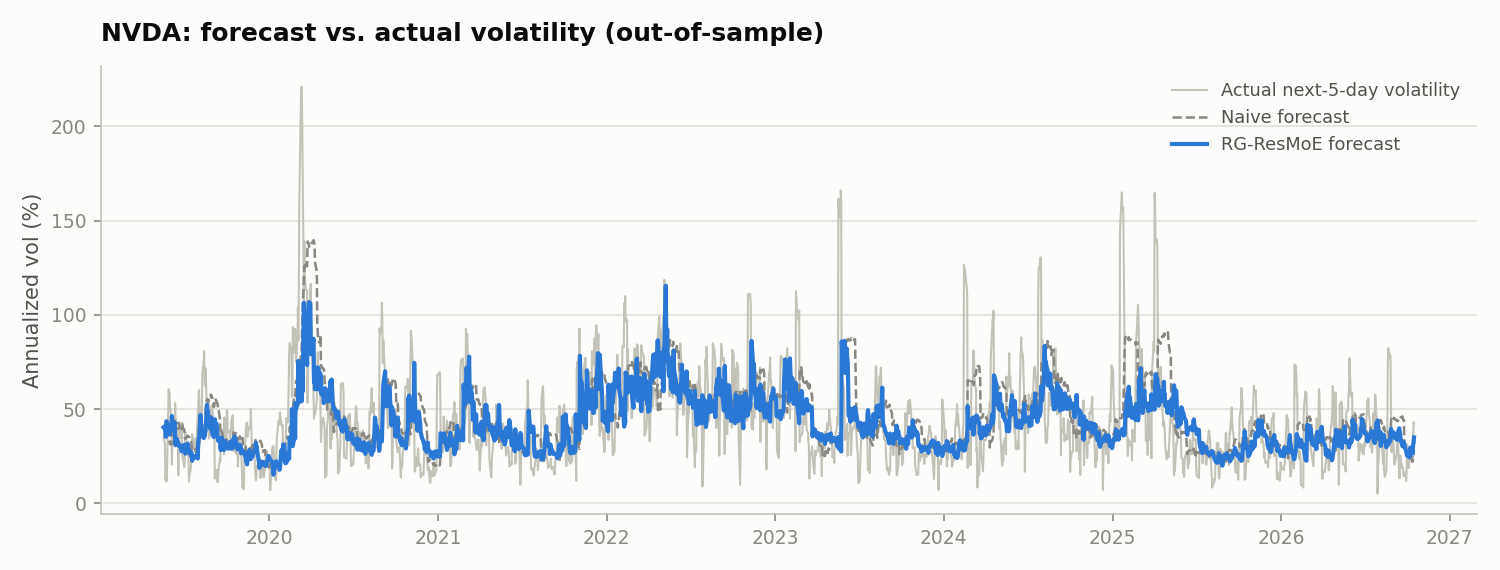
- Every asset: its expected move, its forecast vs. what actually happened since 2019, and its surprise weeks (when it moved at least 2× its forecast).
- Historical Time Machine: pick any past day and see what the system knew at that day's close, kept separate from what happened next.
- Alerts and drift detection: each alert shows the measured value, the threshold and the time windows behind it.
- AI analyst (Gemini): explains the backend's numbers in plain English. It's not allowed to invent its own.
- Voice reports (ElevenLabs): reads the analyst's report aloud.
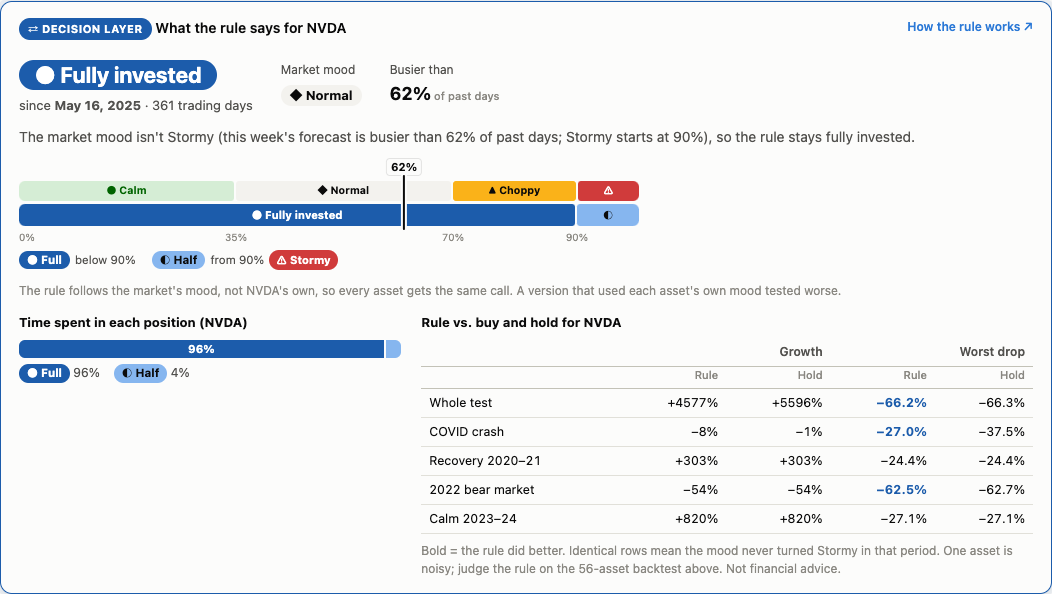
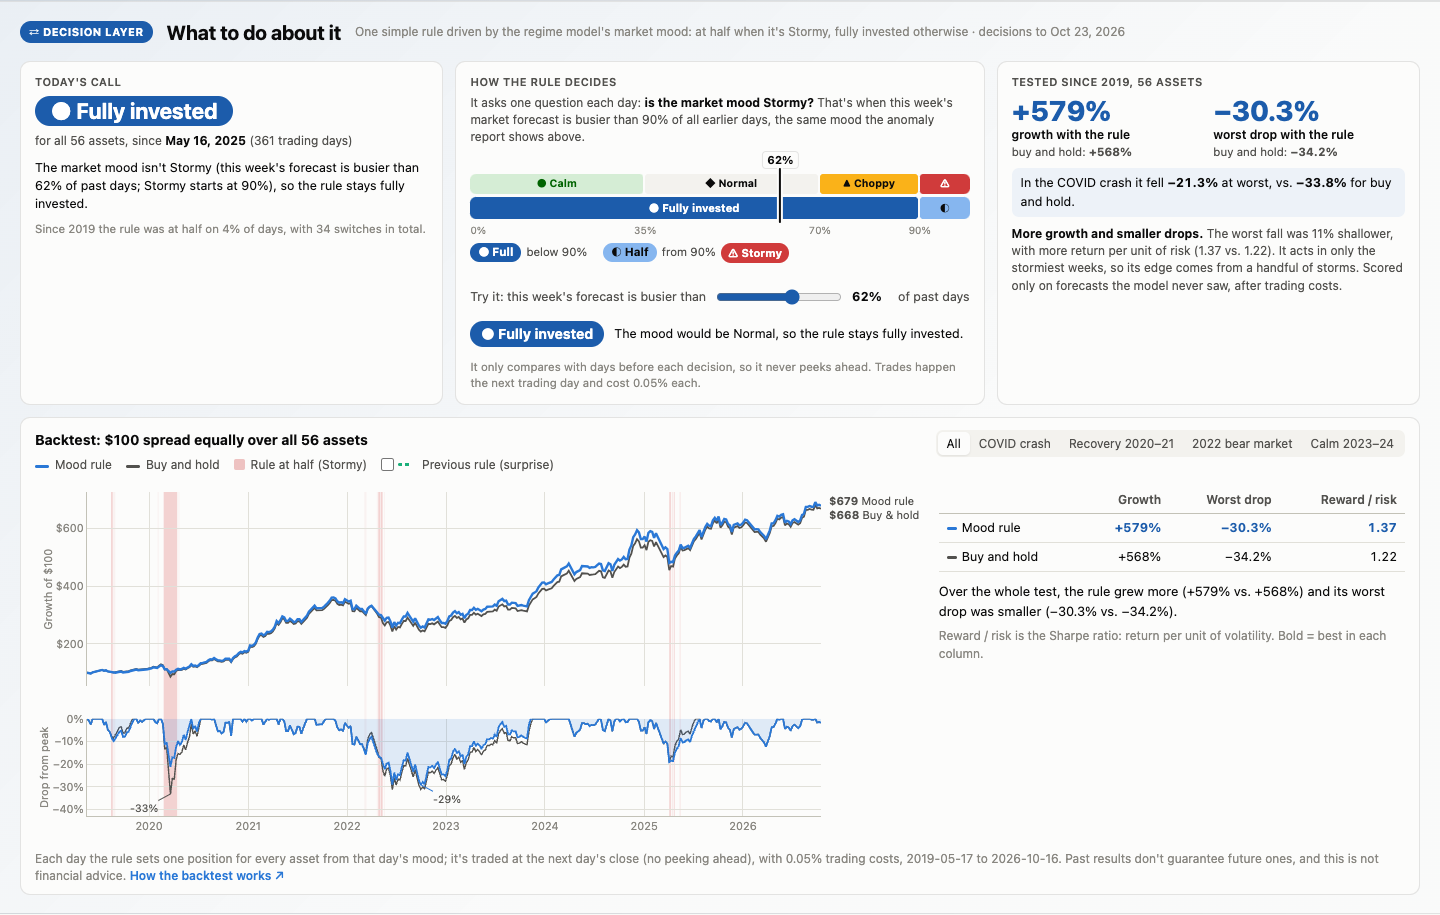
- Decision layer: one simple rule, hold every asset at half when the mood is Stormy, backtested after costs.
It forecasts how much prices may move, not which direction.
How we built it
Data. Daily prices from Yahoo Finance for 56 assets, May 2017 – October 2026, cleaned for time zones, splits, dividends and unfinished trading days. A 10-year snapshot ships with the repo, so the app still works offline.
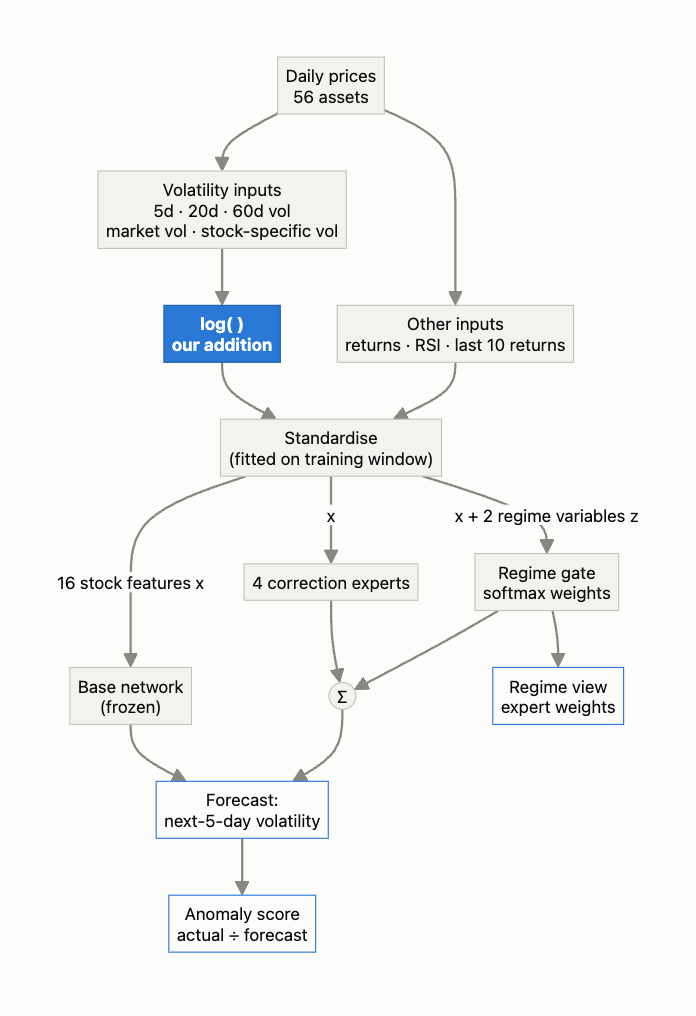
Model. RG-ResMoE has a base network that forecasts next-week volatility, plus four "expert" networks that add corrections. A regime gate decides how much to trust each expert, based on two market regime variables $z$:
$$ \hat{\sigma} = f_{\text{base}}(x) + \sum_{k=1}^{4} \pi_k(x, z)\, f_k(x), \qquad \pi(x,z) = \operatorname{softmax}\big(g(x, z)\big) $$
The whole model has only 3,177 weights, and retraining the full 7-year backtest takes 12 minutes on a laptop.
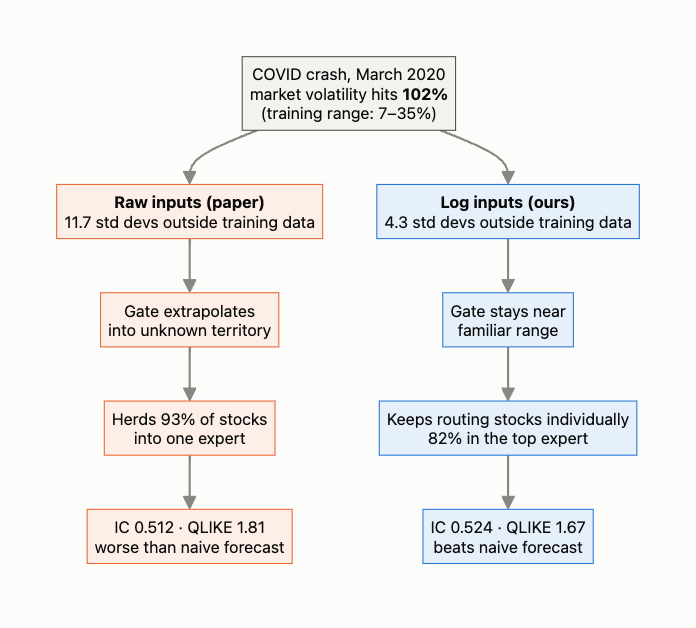
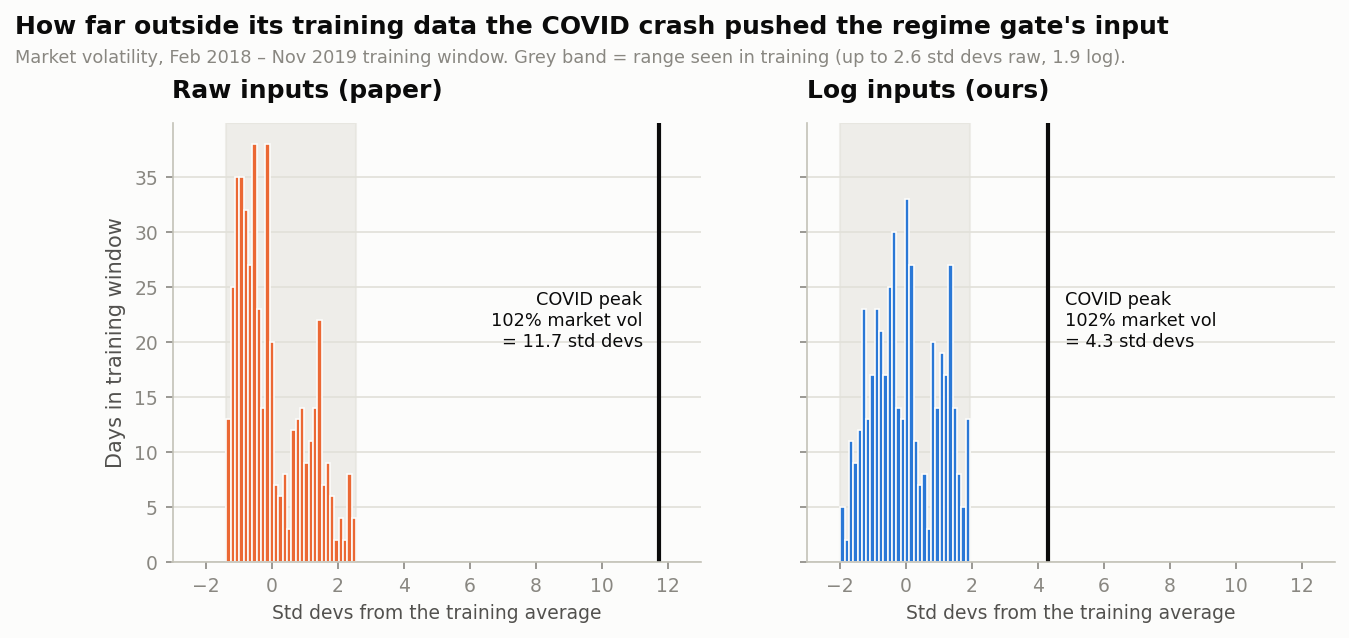
The failure we found. Before COVID the model had only seen market volatility between about 7% and 35%. On 27 March 2020 it hit 102%. After standardisation, that input was
$$ z_{\text{raw}} = \frac{1.02 - \mu}{s} \approx 11.7 \text{ standard deviations} $$
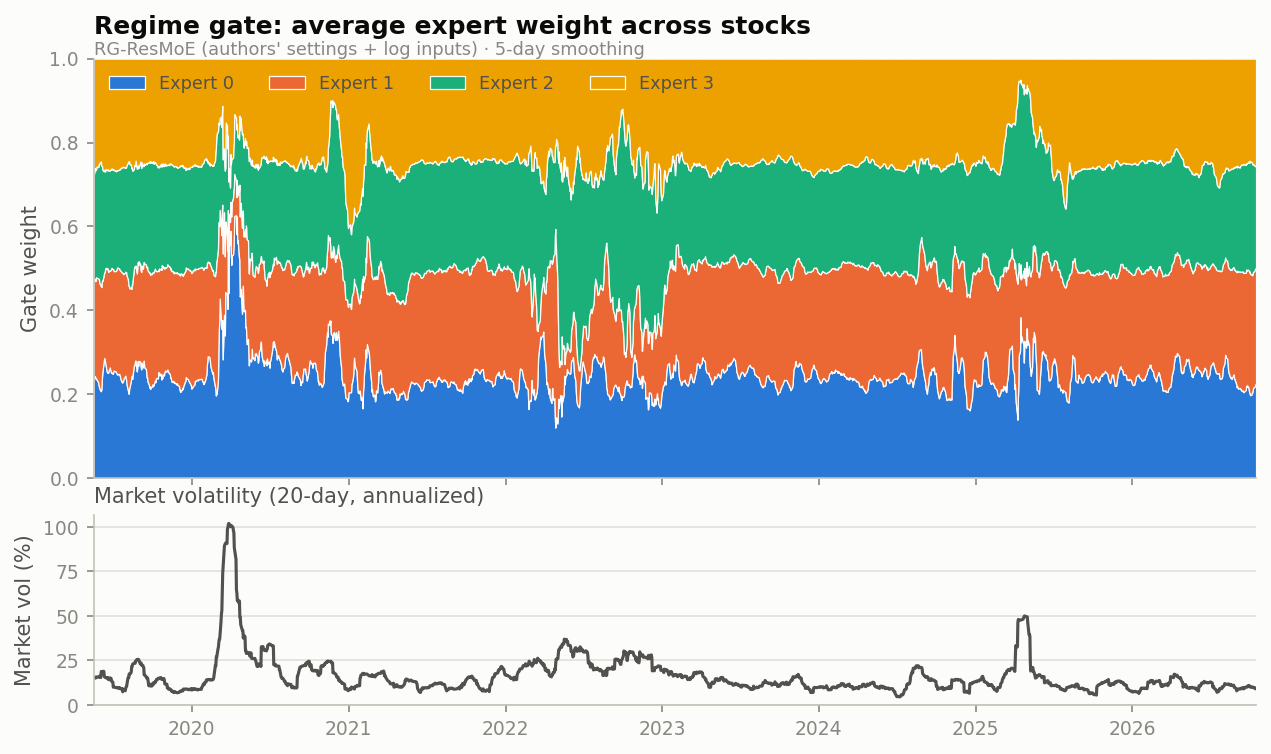
from the training average, more than four times beyond anything the model had seen. The gate stopped judging stocks one by one: 93% of stocks were pushed into a single expert for weeks, compared with 51% in calm 2019.
The fix. Volatility moves in multiples: going from 10% to 20% is the same kind of change as going from 40% to 80%. A logarithm turns those multiples into equal steps, so we feed the five volatility inputs to the model on a log scale before standardising:
$$ \tilde{x} = \frac{\ln\big(\max(x, 10^{-4})\big) - \mu_{\text{train}}}{s_{\text{train}}} $$
On the log scale the COVID peak is 4.3 standard deviations out instead of 11.7. The gate
kept routing stocks individually (82% shared a top expert instead of 93%). It's a one-line
change (log_vol_inputs=True), and the rest of the architecture and the authors' settings
stay the same.
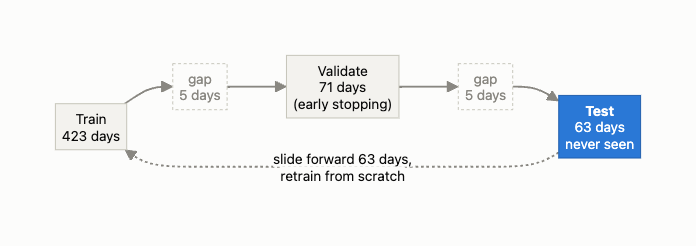
Testing without peeking. Every number we report is out-of-sample. The model is retrained from scratch in 30 rolling windows (423 training days, 71 validation days, 63 test days), with 5-day gaps so the 5-day forecast target can't leak across the boundaries. That gives 103,593 forecasts the model never saw during training. We score them with QLIKE, the standard loss for volatility forecasts:
$$ \text{QLIKE} = \frac{1}{N}\sum_{i=1}^{N} \left( \frac{\sigma_i^2}{\hat{\sigma}_i^2} - \ln\frac{\sigma_i^2}{\hat{\sigma}_i^2} - 1 \right) $$
Results.
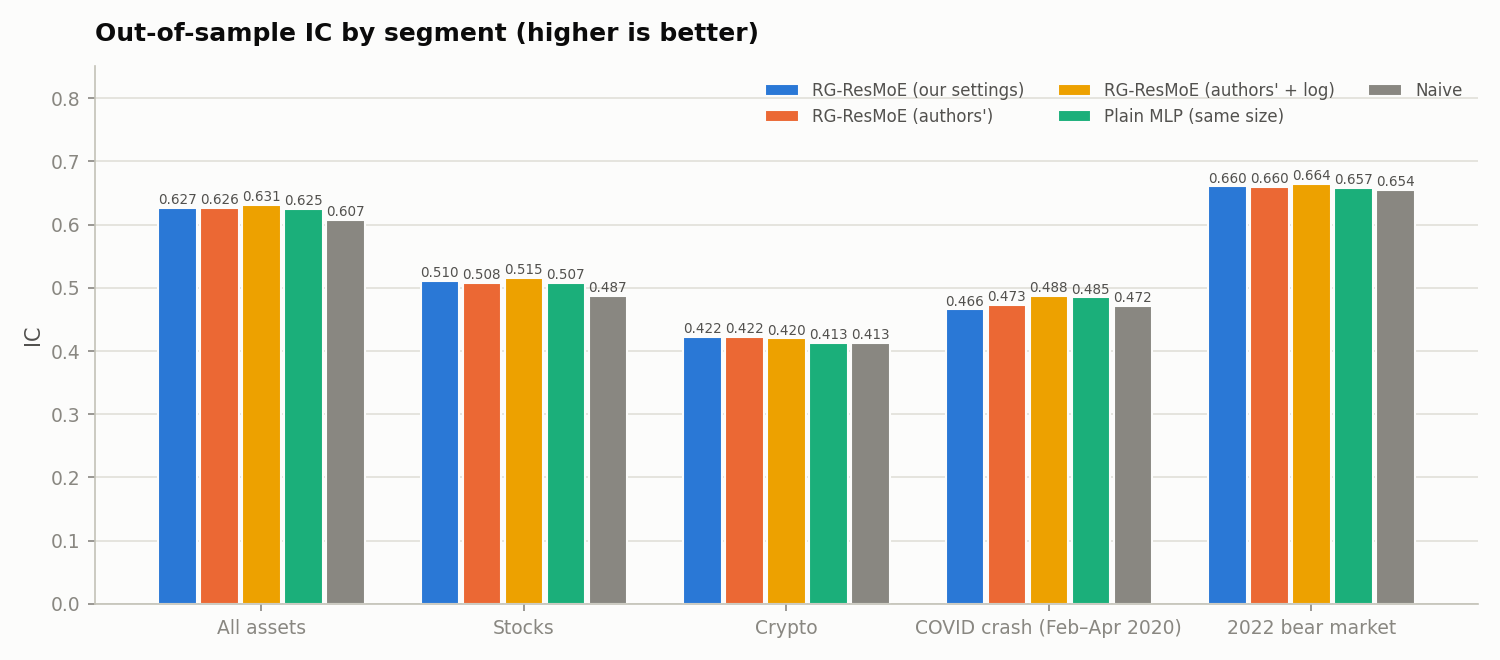
- Average weekly miss of ±1.96%, vs. ±2.24% for the simple "last month" estimate.
- Beat that simple estimate in 29 of 30 test periods.
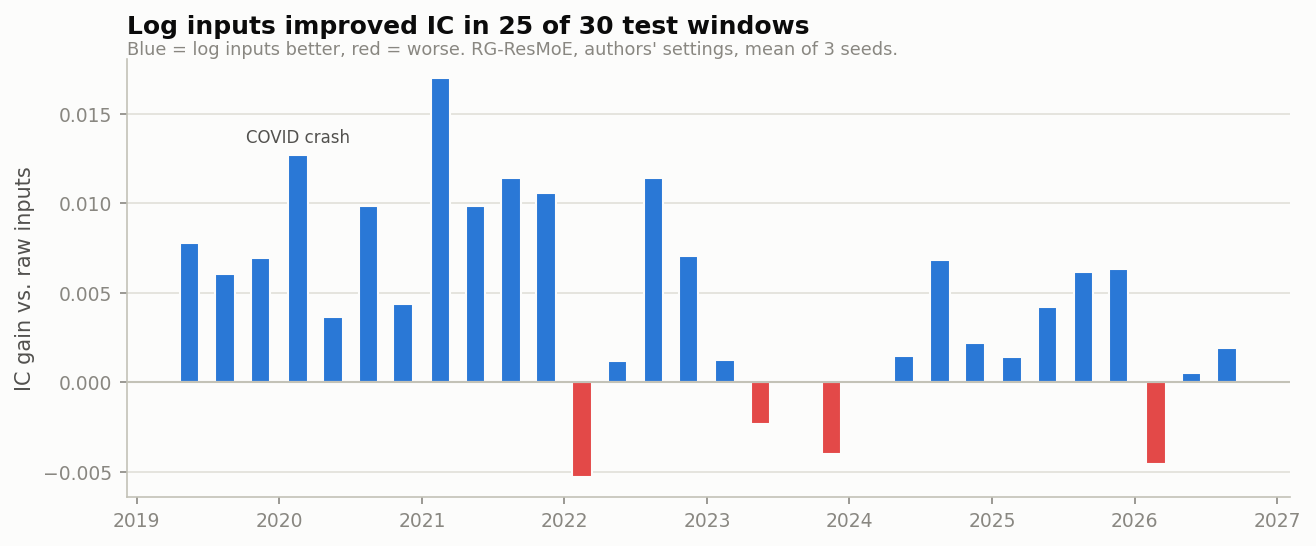
- Our fix beat the original research model in 25 of 30 test periods (t = 9.7, p < 0.001), with the biggest gains in stressed markets.
- The assets it flagged as most volatile actually moved 3.6× more than the ones it flagged as calm.
Turning forecasts into a report. An annualized forecast becomes a weekly move with
$$ \text{expected move} = \hat{\sigma} \times \sqrt{5/252}, $$
one standard deviation of the 5-day return, so about 2 weeks in 3 stay inside it.
The app. The backend is FastAPI in Python with PyTorch for the model, and the frontend is plain HTML, CSS and JavaScript, with dark mode and a phone layout. On top of the forecasts we built:
- Alerts for market stress, model surprises, regime changes, data quality and drift. Drift compares the last 21 days with the 252 before, using the population stability index:
$$ \text{PSI} = \sum_{b} (q_b - p_b)\,\ln\frac{q_b}{p_b} $$
Below 0.10 counts as stable and 0.25 or more as a major shift. A separate check alerts when the model stops beating the simple estimate.
- The AI analyst. The backend turns its own results into numbered facts (F1, F2, …), each with its source. Gemini receives only those facts and must cite them. A validator rejects any answer that cites an unknown fact or contains a number that isn't in the facts. If the answer is rejected or the call fails, the app shows a plain summary built from the same facts.
- Voice reports. The voice endpoint accepts a report id, not free text, so it can only read back what was already on screen.
Challenges we ran into
- Proving the failure, not just suspecting it. "The model does worse in crashes" is easy to say. Showing why meant tracking the gate's weights day by day through March 2020, measuring how far the inputs sat outside the training range, and comparing raw and log inputs across 3 random seeds, with everything else held the same.
- Look-ahead bias. In the Time Machine, it's easy to let tomorrow's data leak into today's view. Our test runs the real code, rewrites or deletes every row after the chosen day for all 56 assets, and checks that the "known" panel stays exactly the same. We also deliberately broke one input to use the full history, to confirm the test catches it.
- A backtest that looked too good. The Stormy rule grew \$100 by +579% vs. +568% for buy and hold, with smaller drops (−30.3% vs. −34.2%). Then we ran a paired block bootstrap with 5,000 resamples, and the 95% interval for the Sharpe gap included zero. We also adopted this rule after our first rule lagged buy and hold over the same period, so it's not a clean hold-out test. We now say "similar return with smaller drops", not "beats the market".
- Keeping the AI honest without breaking it. We wanted a strict validator rather than just trusting the prompt. At first it was too strict: Gemini returned some sections as plain sentences instead of the structure we expected, so every answer was rejected and the app quietly fell back to the plain summary. The fix was to send Gemini the exact response schema and accept plain sentences in the non-fact sections. Their numbers are still checked.
- Third-party failures. Our ElevenLabs integration was correct but still failed: the voice we had chosen wasn't available through the API on our plan. Mocked tests can't catch that, so each optional service now fails cleanly and the written report keeps working.
- Unreliable data. Yahoo Finance rate-limits. The app falls back to saved prices and labels them clearly in the interface.
Accomplishments that we're proud of
- Finding a specific, measurable failure in a 2026 research model, and fixing it with a one-line change that's statistically significant across 30 out-of-sample periods.
- An app that shows its limitations next to its results.
- 205 automated tests, including one that deletes the future to prove there's no look-ahead.
What we learned
- Check your inputs when the world gets strange. Our biggest gain came from rescaling five features, not from a bigger network. Our first attempt used a model 10× larger; it scored worse than the small model with log inputs and took 8× longer to backtest.
- Keep the numbers outside the language model. Compute in code, give the model facts, and reject answers that invent numbers.
- Make the timeline explicit. Show what was known at prediction time separately from what happened next, and test that boundary directly.
- Run significance tests on your own good results. A good-looking backtest is a claim to check, not a result to announce.
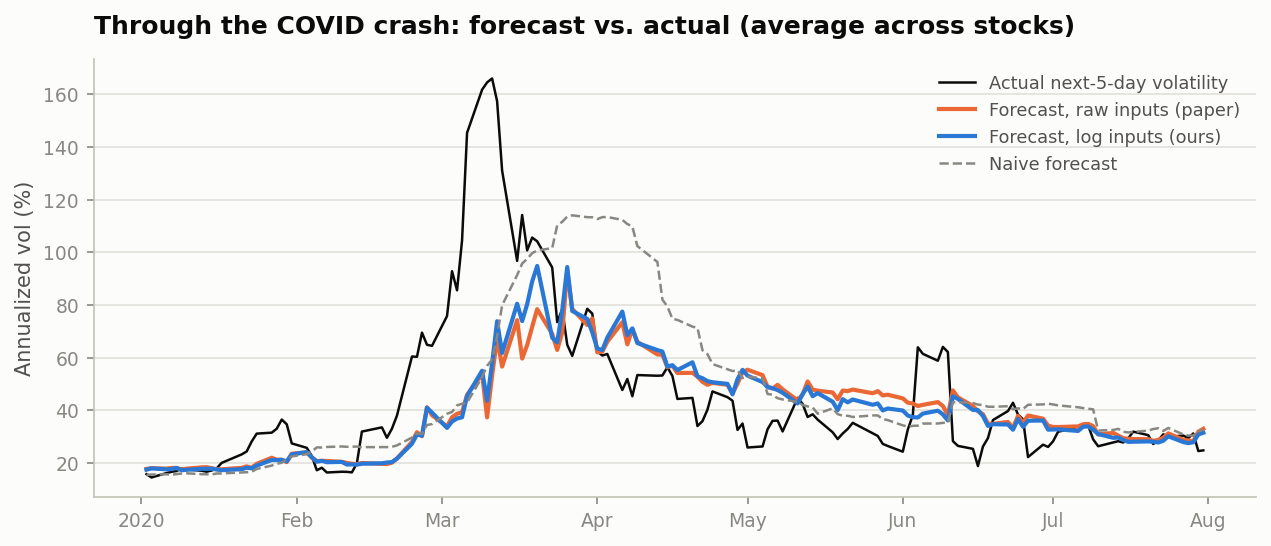
- Be honest about what the model can't do. Even with our fix, both versions under-forecast the COVID peak (about 95% predicted vs. 166% actual). The fix makes the model degrade gracefully; it doesn't predict crashes.
What's next for Anomality
- Run the Stormy rule unchanged on data after October 2026, as a true hold-out test.
- Scale up from 56 assets and 3 seeds toward the paper's 1,027 assets and 30 seeds.
- Evaluate the AI explanations more broadly: missing caveats and unsupported causal claims, not just numbers.
- Tell a one-off unusual week apart from a lasting change in market behaviour in the drift alerts.


Log in or sign up for Devpost to join the conversation.