-
-
model card
-
what if
-
inspector
-
explain
-
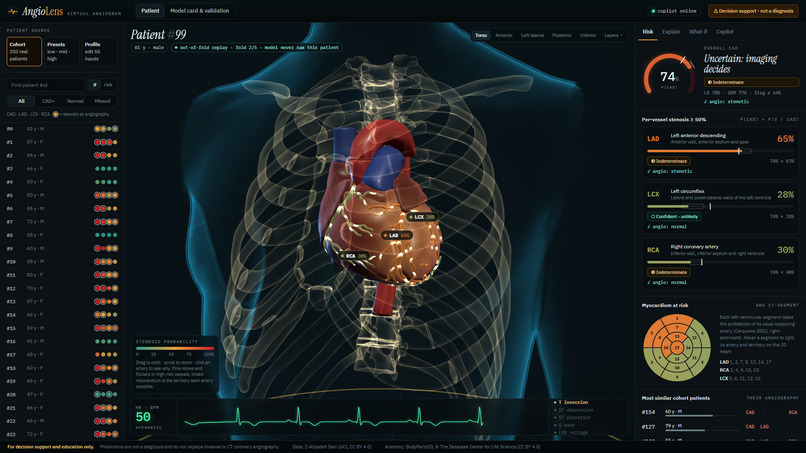
dashboard
Inspiration
A risk score tells a cardiologist how likely coronary disease is, but not where it is. Today that answer needs an invasive angiogram. We asked how much of that picture routine clinical data (history, ECG, labs, echo) can honestly recover, and how to show it so that a clinician can question it instead of having to trust a number.
What it does
AngioLens turns 55 routine clinical features into a virtual angiogram:
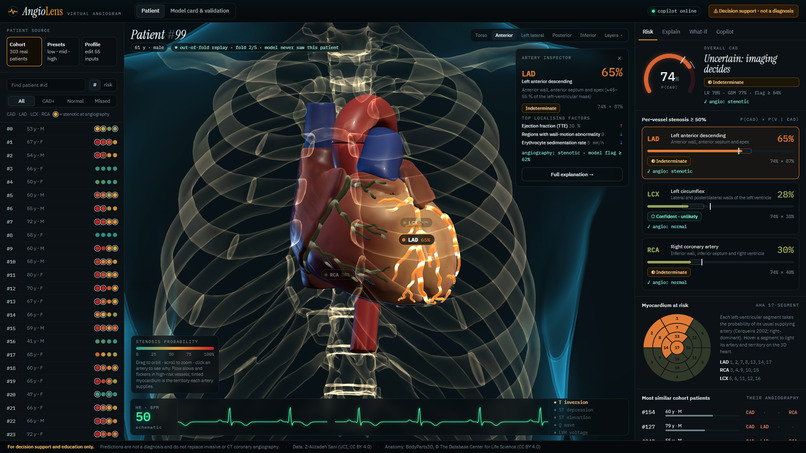
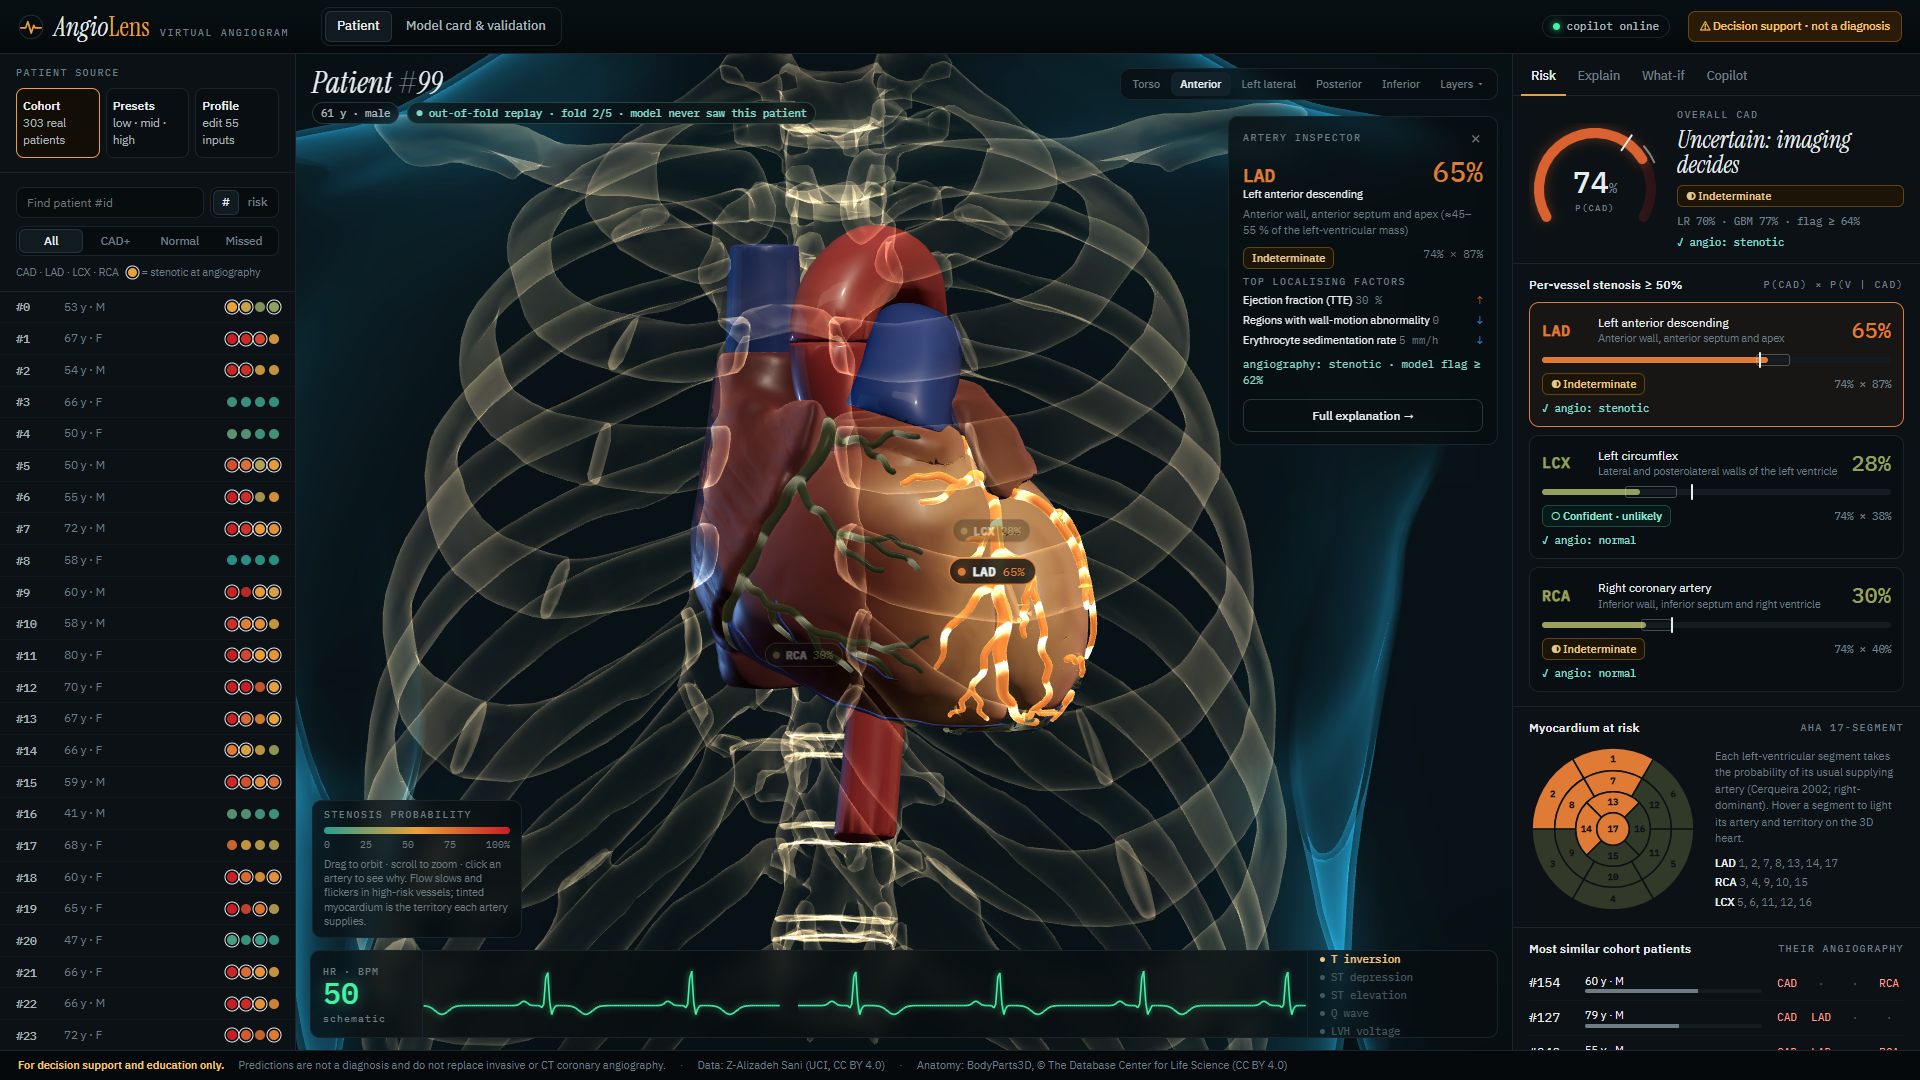
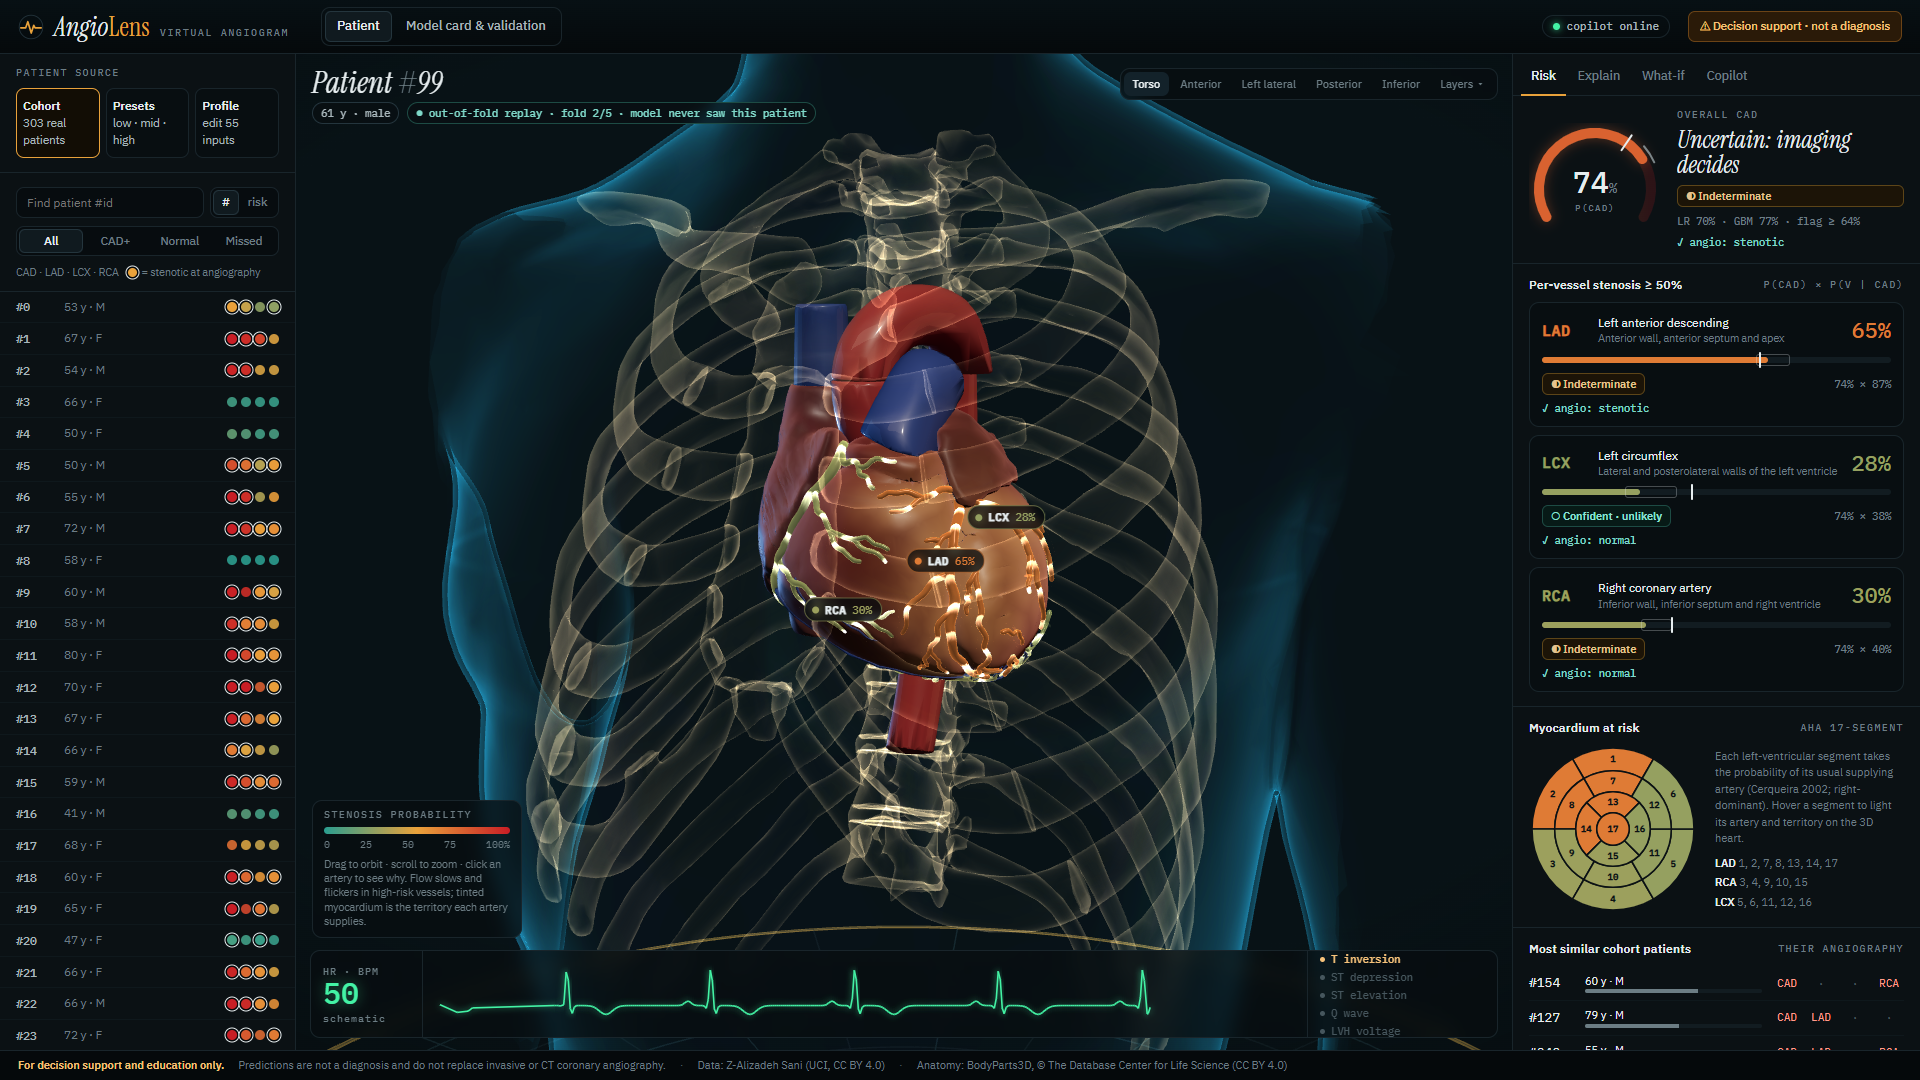
- Predicts overall coronary artery disease and ≥50 % stenosis of the LAD, LCX and RCA, with calibrated probabilities, an operating flag, a model range and a 90 % conformal prediction set (confident or indeterminate).
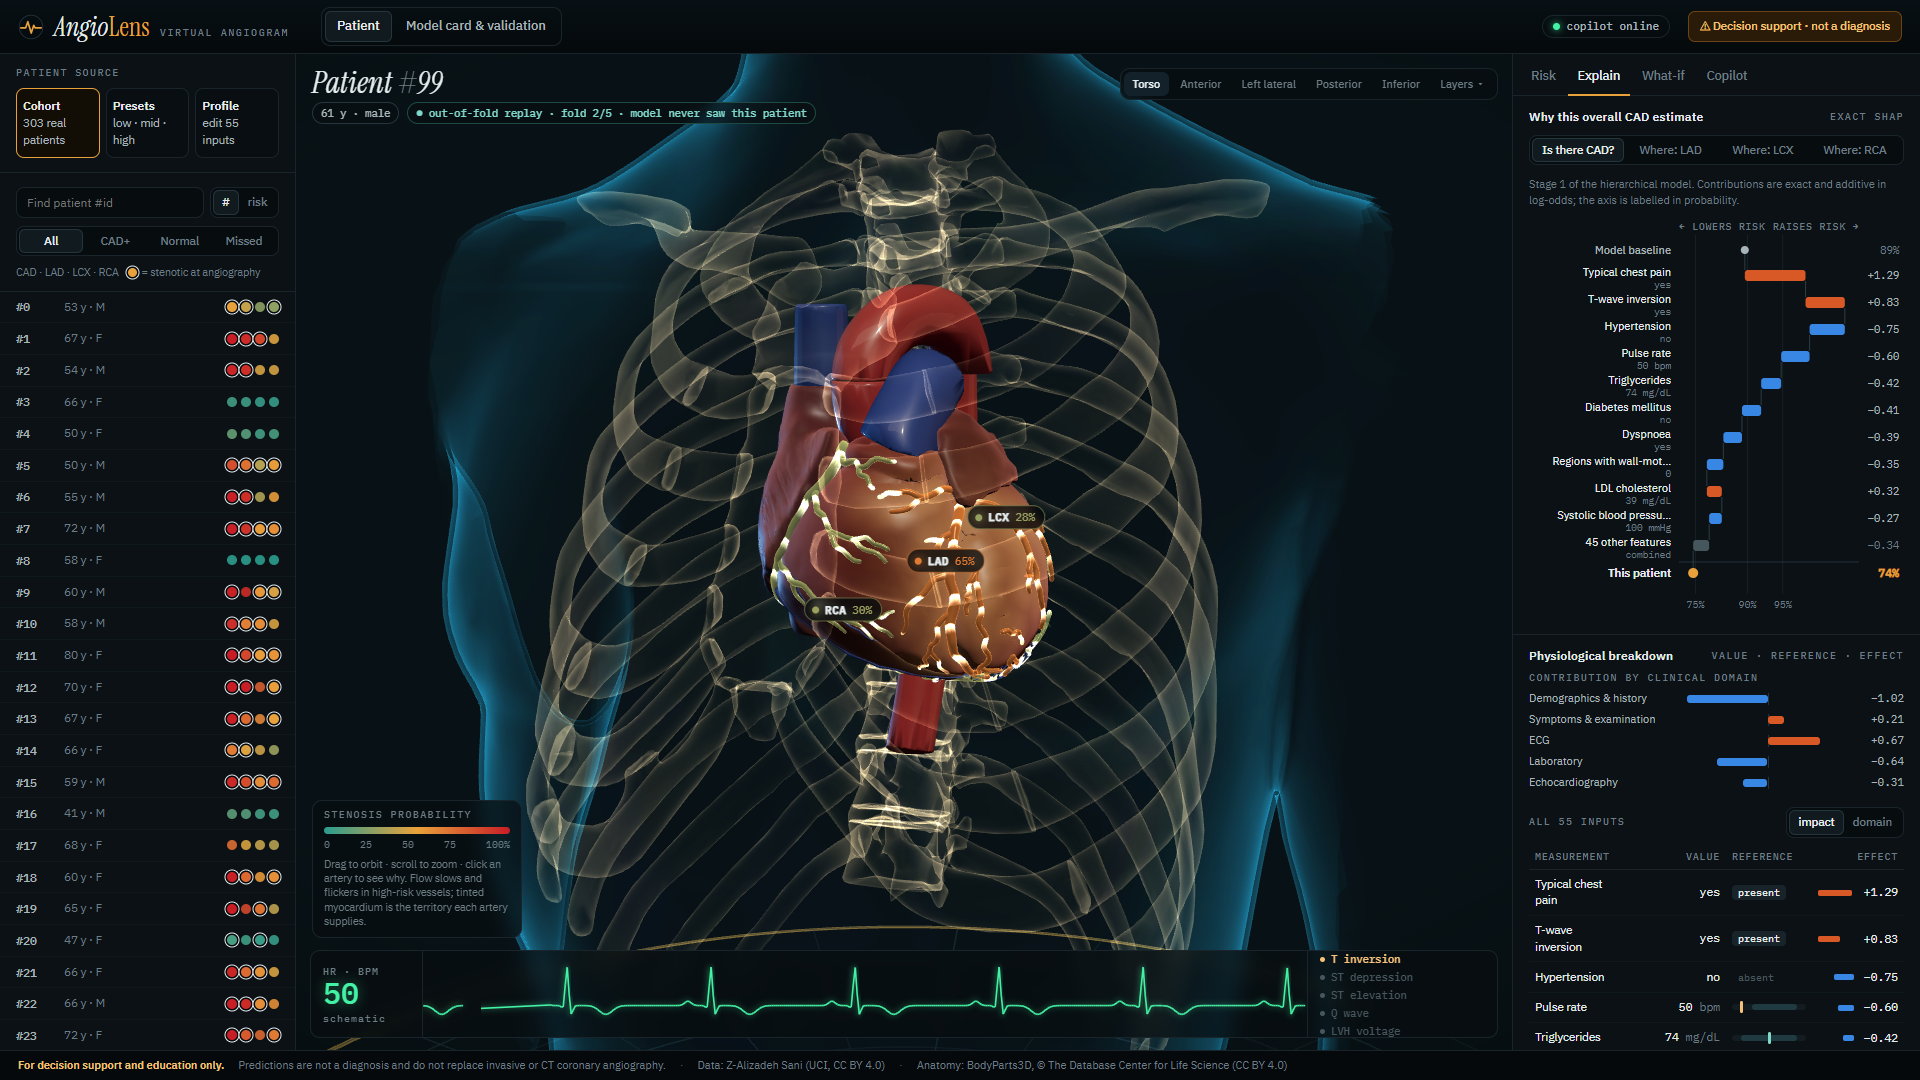
- Maps each prediction onto a real BodyParts3D heart inside an x-ray torso. Arteries are coloured by risk, and animated contrast flow slows and flickers in high-risk vessels. The myocardium shows the territory each artery supplies, linked to an AHA 17-segment bull's-eye. The heart beats at the patient's recorded pulse next to a schematic ECG built from their own findings. Rotate, zoom, click an artery to isolate it, or click any point of heart muscle to see which arteries perfuse it.
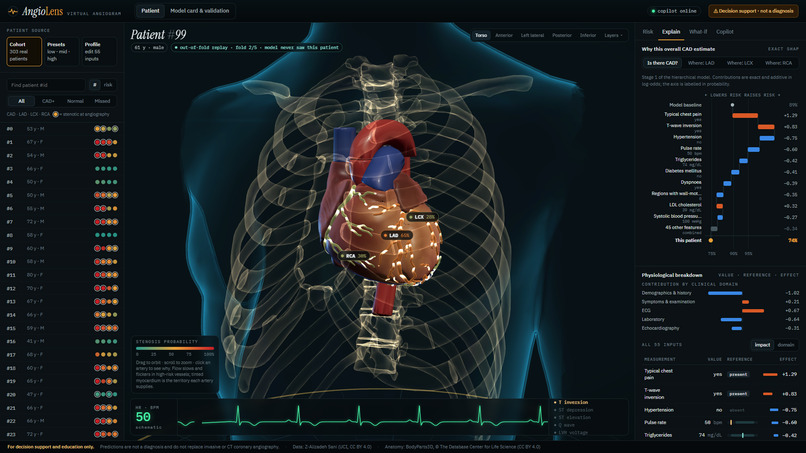
- Explains every number exactly: two-stage SHAP waterfalls ("is there CAD?" and "which artery?"), contribution per clinical domain, and a physiological breakdown of all 55 measurements against reference ranges.
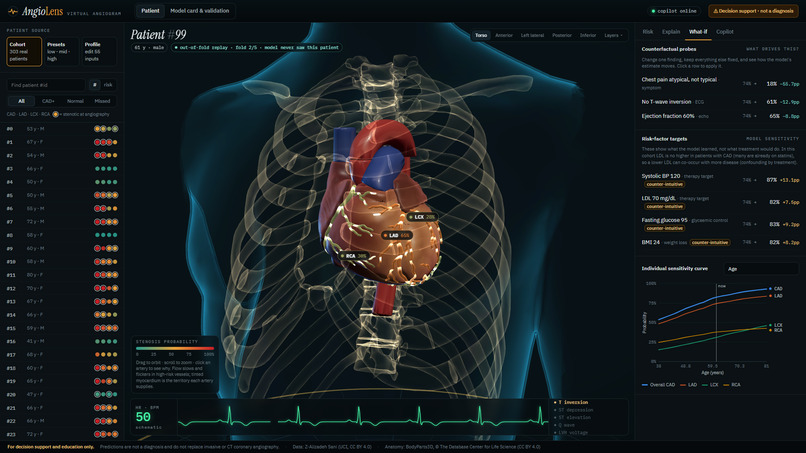
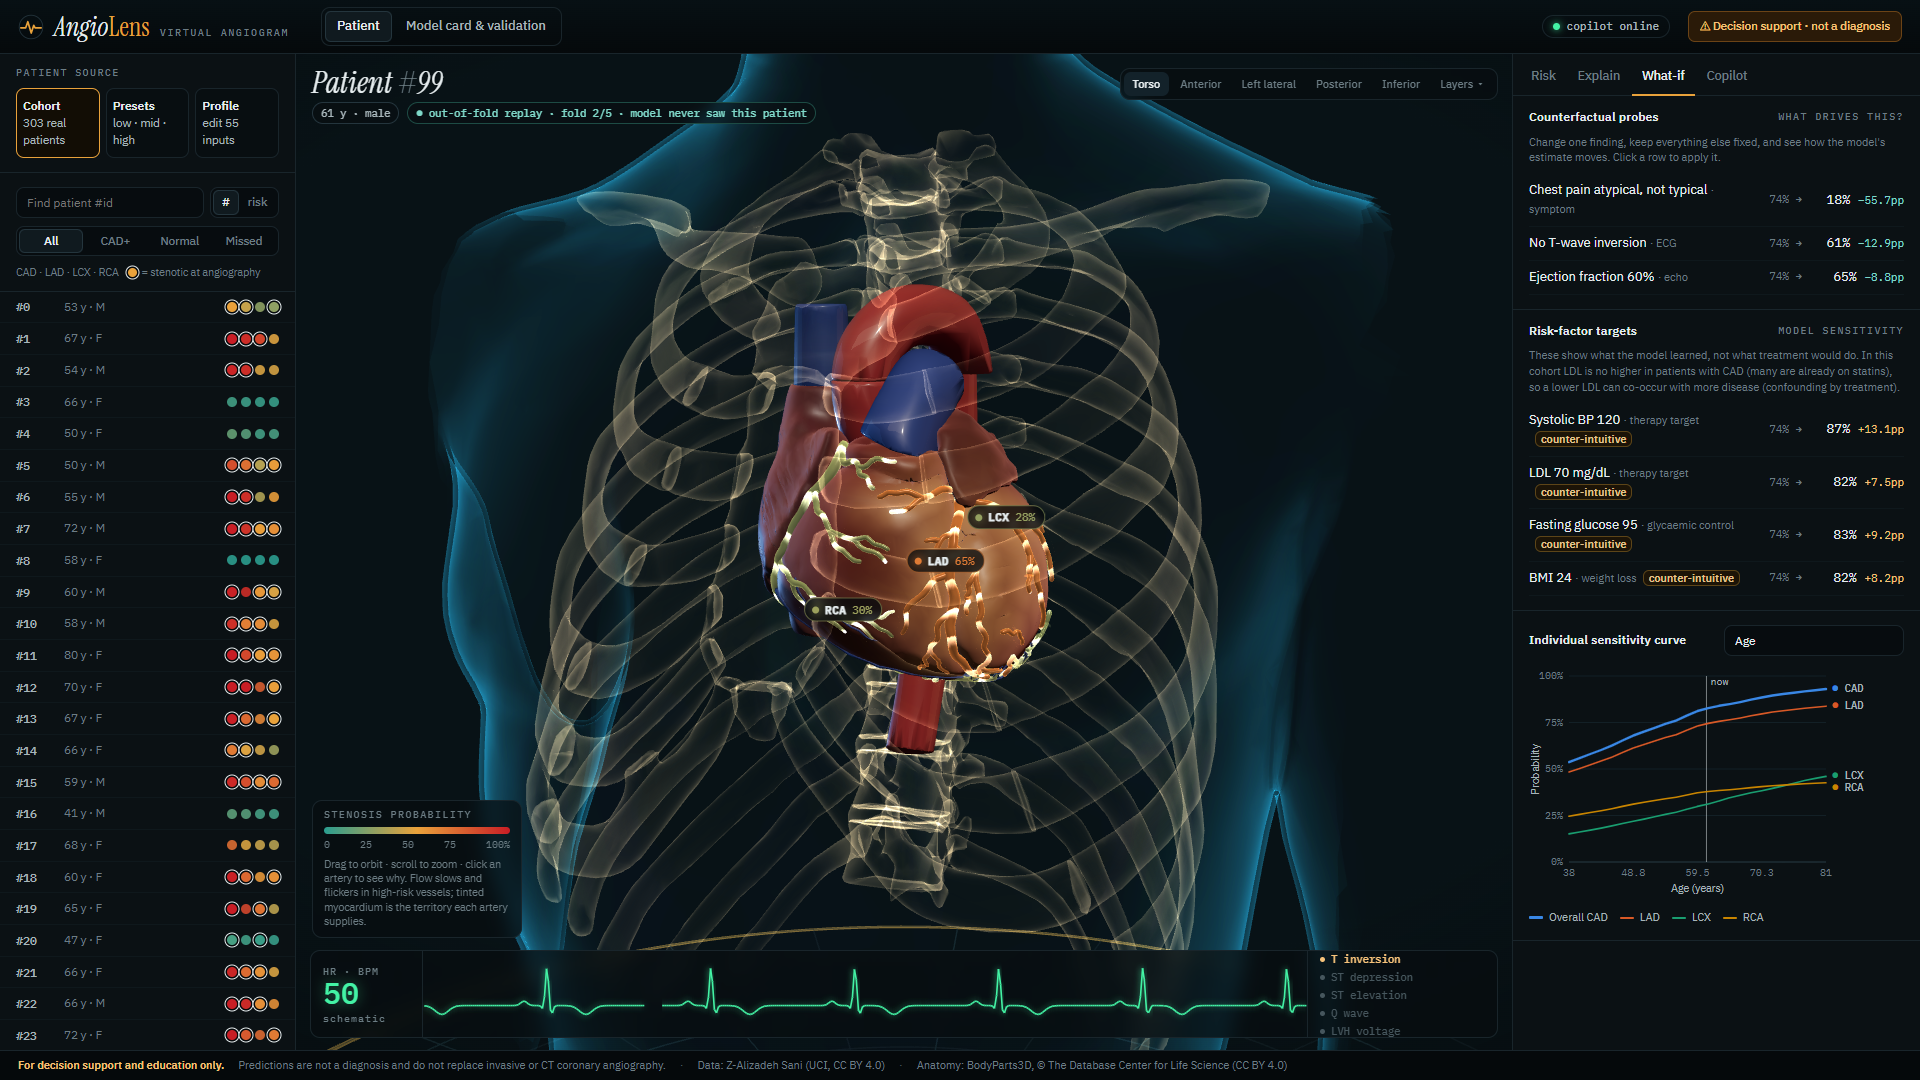
- Probes the model with counterfactuals and sensitivity curves, and shows the five most similar real patients and their angiograms.
- Replays all 303 cohort patients honestly: each one is explained by the cross-validation model that never saw them, next to their real angiography result, mistakes included.
- Communicates through a grounded LLM copilot (clinician or patient voice, English or Hindi, text or voice questions) and a one-page PDF report.
How we built it
- Data: the UCI Extension of Z-Alizadeh Sani dataset (303 patients). A single feature registry declares every input once (unit, valid range, reference range, clinical domain) and drives training, API validation, the UI form and the physiological breakdown. LAD/LCX/RCA/Cath are hard-excluded from the inputs (asserted and unit-tested).
- Hierarchical model: because CAD means "any vessel ≥ 50 %", we model
P(vessel) = P(CAD) × P(vessel | CAD). Vessel risk can never exceed overall risk. Independent per-vessel models break that rule for about 1 in 5 patients. - Exactly explainable ensemble: each stage blends an L1 logistic regression and a shallow LightGBM in log-odds, then applies Platt calibration. Every step is affine, so linear SHAP plus TreeSHAP add up exactly to the calibrated probability (tested to 1e-6).
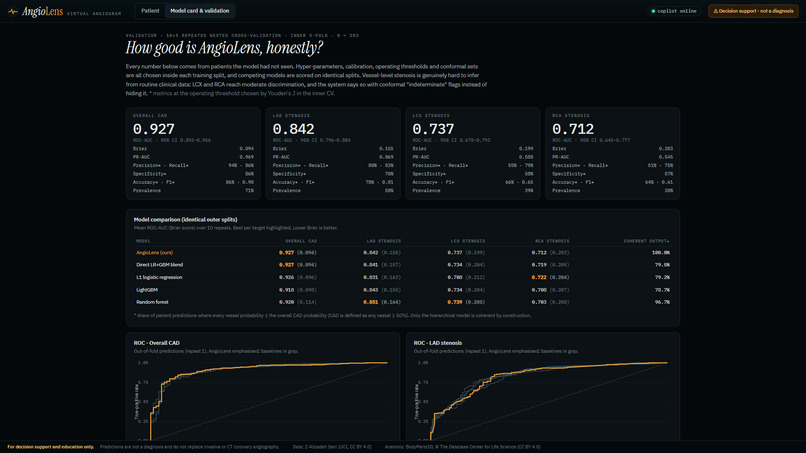
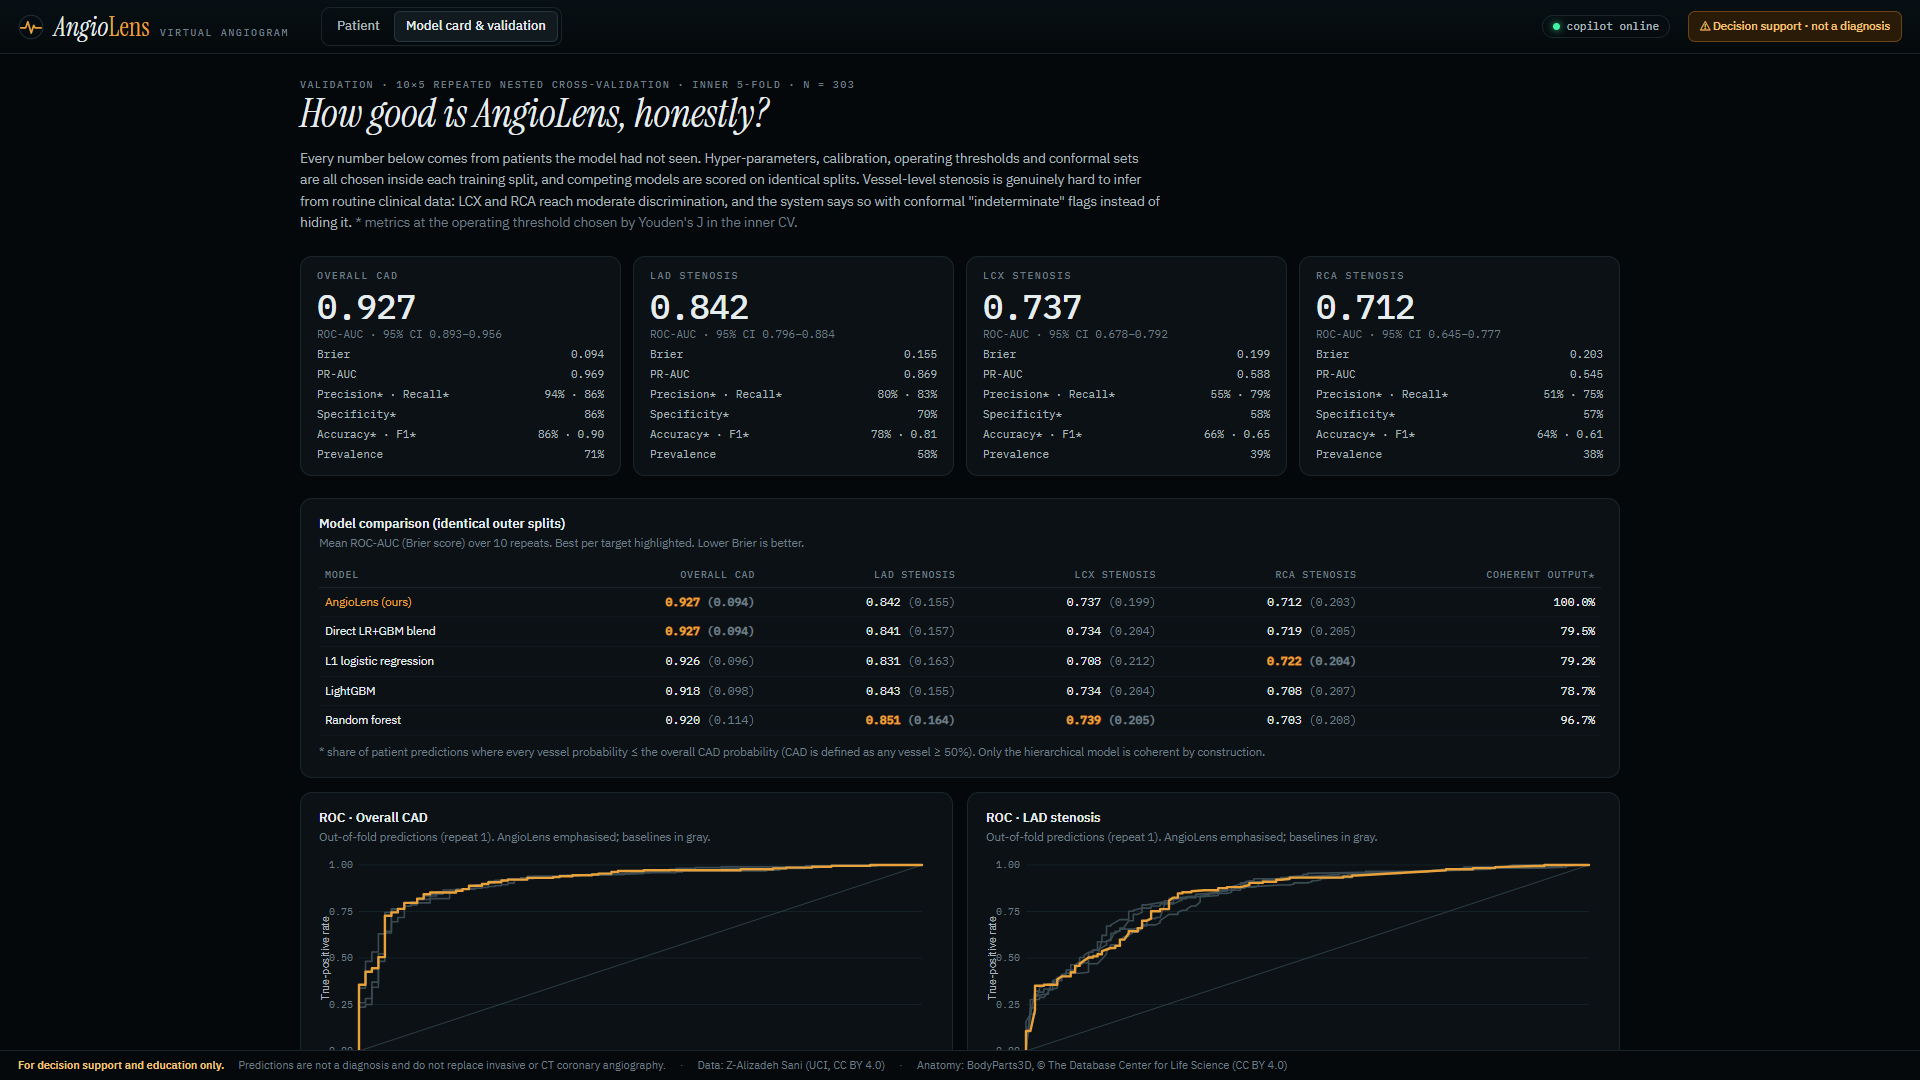
- Rigorous validation: 10×5 repeated, stratified, nested cross-validation. Hyper-parameters, calibration, Youden thresholds and Mondrian conformal quantiles are all fitted inside each training split. We compared against L1-LR, LightGBM, random forest and a direct blend on identical splits, with bootstrap 95 % CIs, calibration, and decision-curve analysis.
- 3D pipeline: we selected BodyParts3D meshes by FMA id (LAD tree with diagonals, circumflex, RCA tree with PDA and marginals, chambers, great vessels, ribs, spine, lungs, skin). We measured that the ventricles were endocardial, which left arteries floating 9 mm above them, and offset the shells to the epicardium. Ostium-distance and perfusion-territory attributes are baked into one 4.9 MB GLB with named LAD/LCX/RCA nodes.
- Rendering: React Three Fiber with custom GLSL (contrast-flow, additive halo and fresnel x-ray shaders) and no post-processing. It runs at 60 fps at 1080p on Intel Iris Xe integrated graphics.
- Backend: FastAPI returns a prediction plus exact SHAP for all four stages plus similar patients in ~41 ms, so every slider move updates the 3D heart live.
- Grounded copilot: Groq
gpt-oss-120bonly rephrases a deterministic fact sheet. Every number it writes (Devanagari digits included) is machine-checked against the model output; failures are retried and then replaced by a template. Whisper transcribes voice questions. - Automation: training, anatomy build, figures, the 5-page technical report (rendered from
metrics.json) and even the demo video (neural TTS, cue-word-scripted browser capture, word-timed subtitles) are reproducible scripts. 20 pytest tests guard leakage, additivity, coherence, reproducibility, the API and grounding.
Challenges we ran into
- Localisation is genuinely hard. Overall CAD reaches AUC 0.93, but LCX and RCA top out around 0.71–0.74 with routine data. Rather than hiding it, we made uncertainty visible with conformal sets, which flag about half of LCX/RCA calls as indeterminate, while 90 % coverage still holds out-of-sample.
- Anatomy that lies. BodyParts3D models ventricular cavities, so the coronaries floated off the heart. We measured the gaps and rebuilt epicardial shells.
- Explainability vs. accuracy vs. calibration. We designed the log-odds blend with Platt scaling specifically so SHAP stays exact after calibration.
- Counter-intuitive what-ifs. Setting LDL to 70 mg/dL raised modelled risk for 64 % of patients. LDL is no higher in CAD patients in this cohort (104 vs 106 mg/dL; many are on statins), a case of confounding by treatment that the UI now flags explicitly.
- GPU-free rendering. A bloom pass rendered a blank heart on software and low-end WebGL, so we replaced it with shader halos that work everywhere.
Accomplishments that we're proud of
- An anatomically coherent multi-vessel model (100 % vs ~79 % for direct models) that matches the best baseline discrimination with the best or tied-best Brier score on every target.
- Exact explanations after calibration, and conformal prediction whose 90 % coverage held on every target out-of-sample.
- A 3D view where every visual element carries information: flow speed, territory tint, bull's-eye, heartbeat and ECG.
- Honest out-of-fold replay of every patient, including the model's mistakes.
What we learned
Validation design matters more than model choice on 303 patients: nested CV moved us away from the optimistic numbers common in the literature. Uncertainty is a feature, not an embarrassment. And a visualisation earns trust only if each pixel maps to something the model actually computed.
What's next
External validation on a larger multi-centre cohort; patient-specific coronary anatomy from CT angiography; adding troponin and stress-test features; a FHIR import; and a prospective reader study measuring whether AngioLens changes clinicians' referral decisions.
Safety
AngioLens is a decision-support and educational prototype, not a medical device. The UI carries a persistent disclaimer, an acknowledgement dialog, conformal "indeterminate" states, and disclaimers on every PDF and copilot answer.
Attributions
Data: Alizadehsani, Roshanzamir & Sani, extention of Z-Alizadeh Sani dataset, UCI ML Repository, doi:10.24432/C5461K (CC BY 4.0). Anatomy: "BodyParts3D, © The Database Center for Life Science licensed under CC Attribution 4.0 International".
Built With
- bodyparts3d
- conformal-prediction
- edge-tts
- fastapi
- ffmpeg
- glsl
- groq
- lightgbm
- playwright
- python
- react
- react-three-fiber
- reportlab
- scikit-learn
- shap
- three.js
- typescript
- whisper

Log in or sign up for Devpost to join the conversation.