Anelench:
Is that bright spot in the black-hole image real? Anelench finds a second image that explains the same telescope data without it, then plans the observation that tells the two apart.
Inspiration
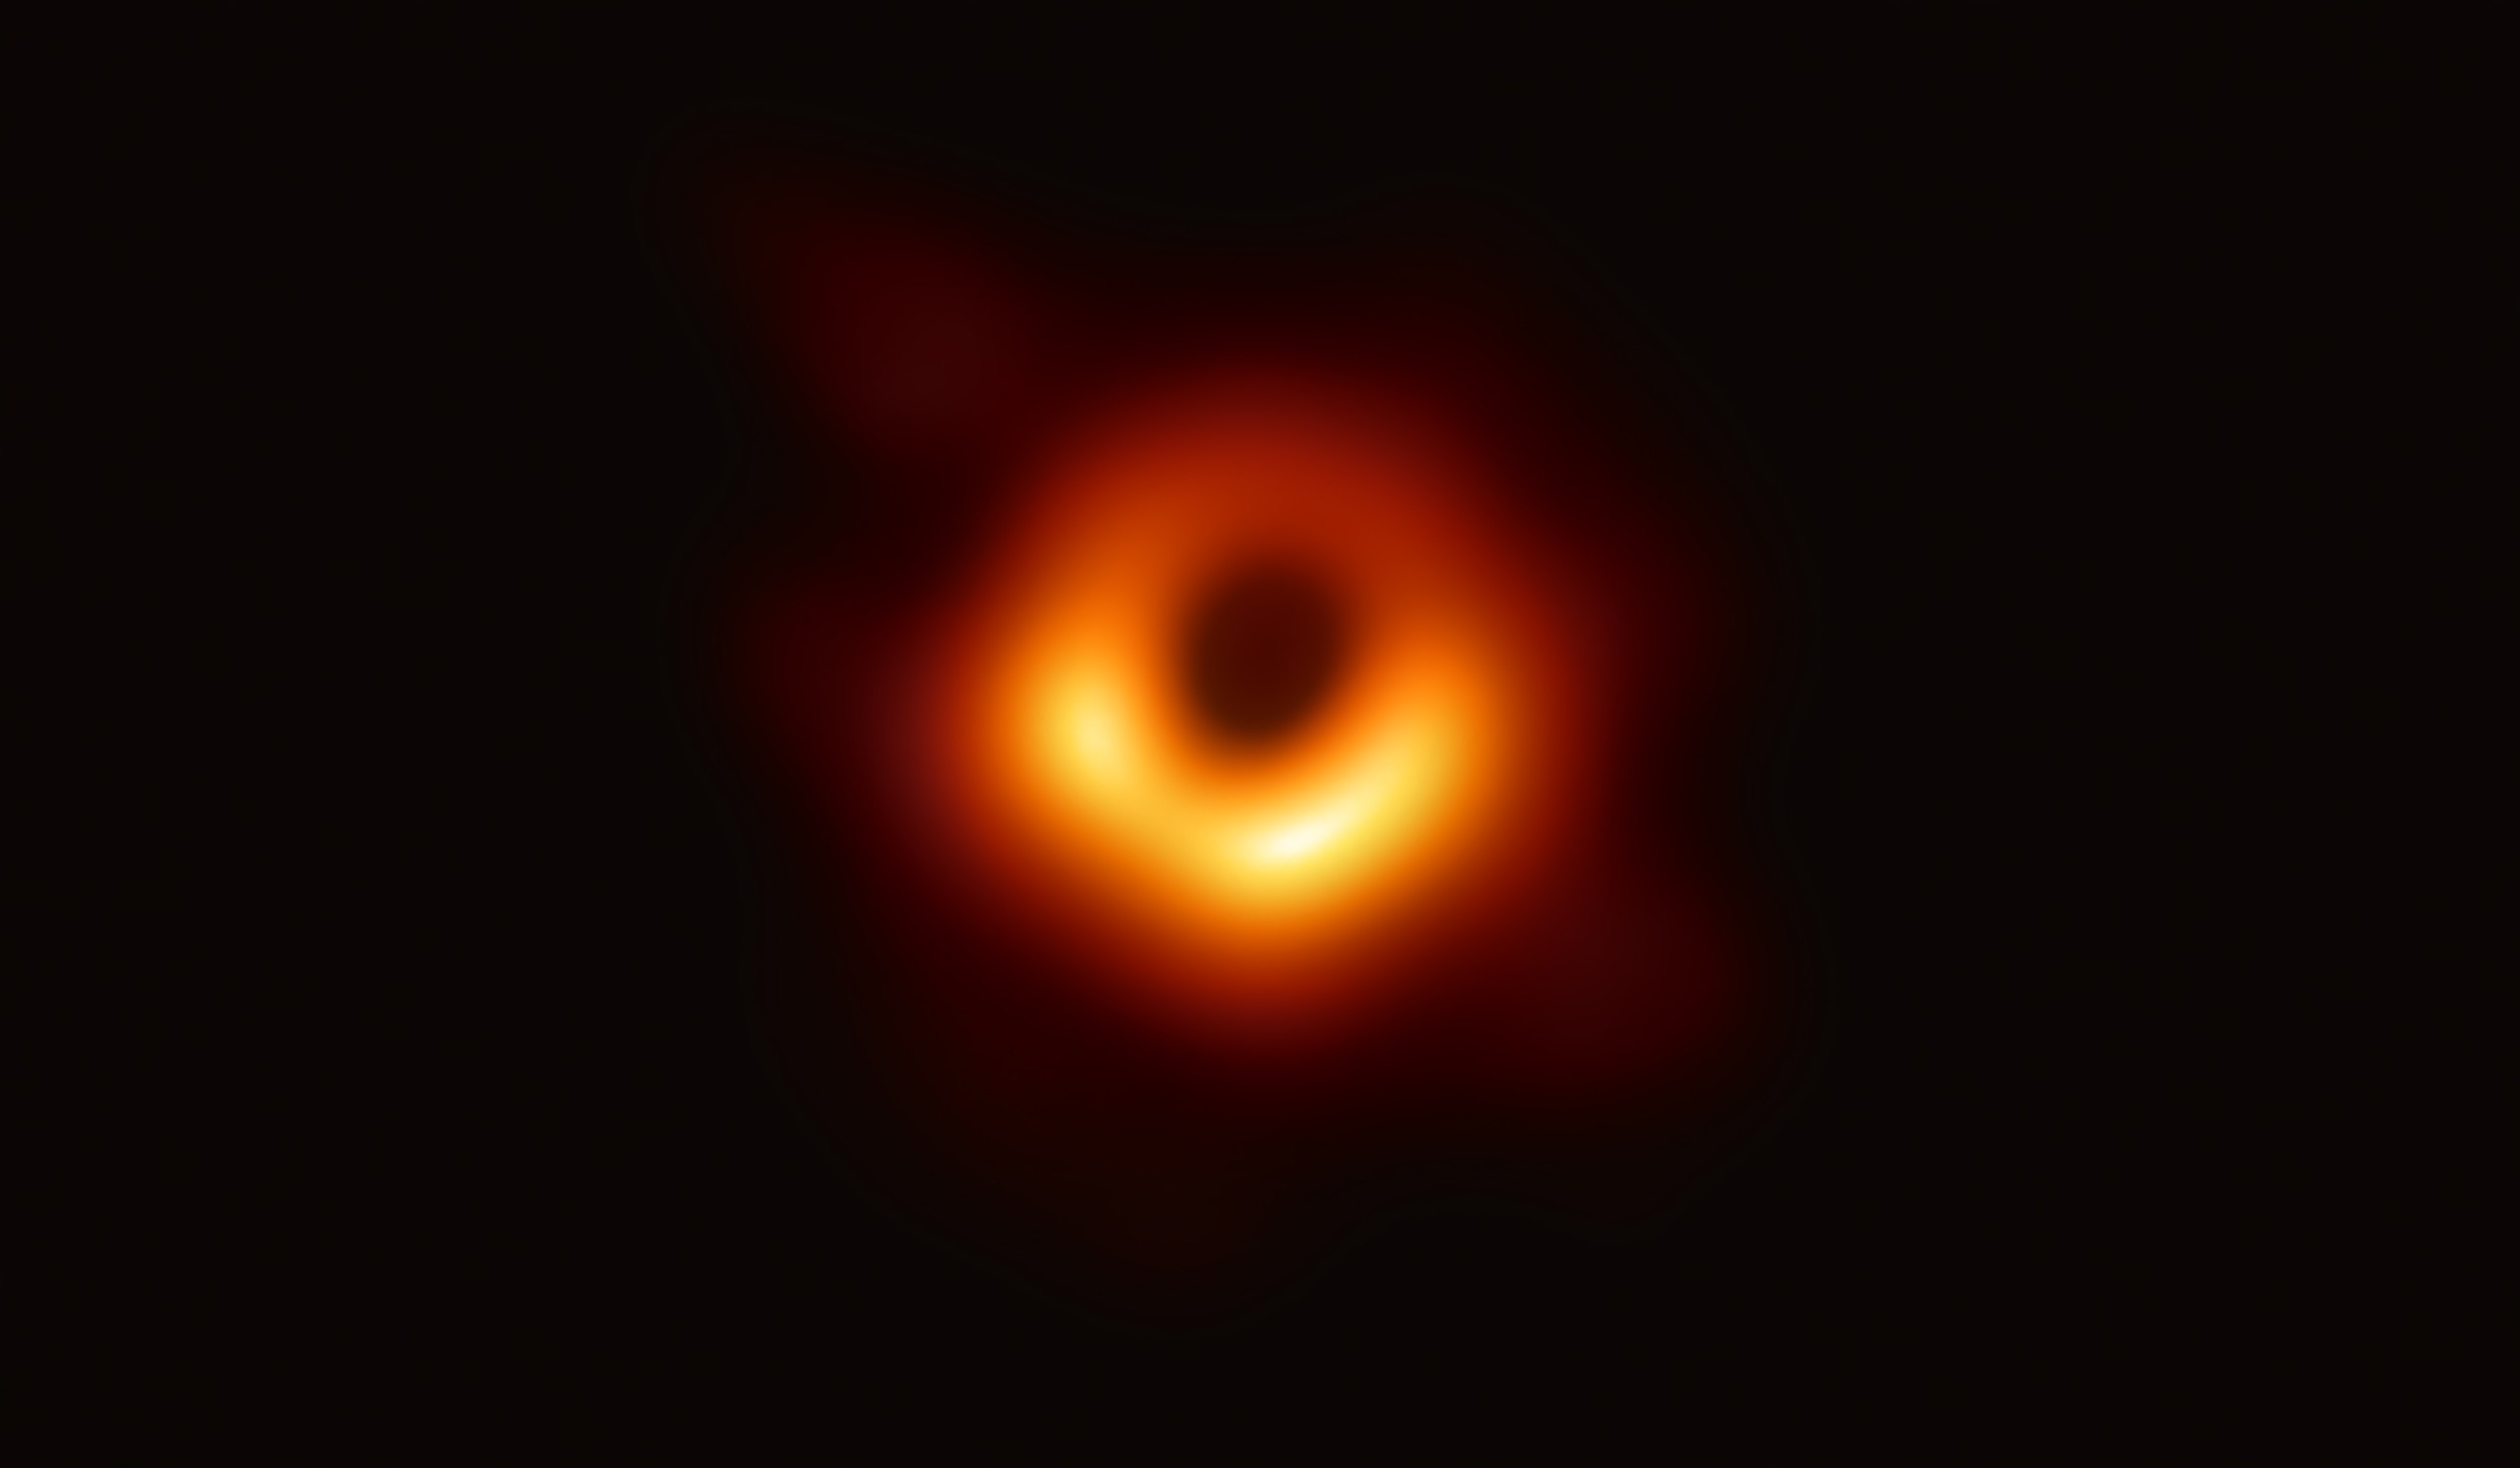
The famous image of M87* is not a photograph. Seven telescopes spread across the Earth measured a few hundred samples of the sky's Fourier transform, and an algorithm filled in everything in between. Researchers then read physics off fine details of those images. Recent work shows how fragile that is: different learned priors change the features and uncertainties of the M87* reconstruction (Feng, Bouman & Freeman 2024), and the ring's ellipticity follows the emitting gas, not the black hole's spin (Dahale et al. 2025). We wanted a tool a researcher can point at one suspicious structure to ask a yes-or-no question: could the measurements be explained just as well without it? And if the answer is yes, the tool should say what to observe next, and then check itself.
What it does:
Mark a feature. Load a dataset (two synthetic tests with a hidden truth, or the real EHT 2017 M87* data), pick an imaging assumption, click a region and state a claim such as "this region is at least 20% as bright as the ring's peak".
Two explanations. Anelench pushes seven image models to remove the feature and to strengthen it, while each keeps fitting the gain-free closure measurements within the noise. If both survive, you see them side by side, flip between them with a blink comparator (the instrument Clyde Tombaugh used to find Pluto), and see both prediction curves pass through the same measured closure phases.
Plan the next observation. For 173 feasible follow-up nights (which telescopes, which UT window, elevation limits, sensitivities, cost), Anelench predicts what each witness pair would make the array measure and ranks nights by the separation of the hardest pair per unit of telescope time. A globe shows Earth as seen from M87*, with the recommended baselines.
Observe and test again. For synthetic data the night is simulated from the hidden truth with fresh gains and noise; for M87* we use real 2017 nights that were held back. Every assumption is re-imaged and the whole search runs again, so the recommendation is checked rather than trusted. A second night can be planned the same way.
What is new, and what is not:
Uncertainty quantification for radio images (QuantifAI, Liaudat et al. 2024), structure hypothesis tests and goal-oriented experimental design (Attia, Alexanderian & Saibaba 2018) already exist separately. We do not claim them. Anelench's contribution is narrower: for one feature a researcher chooses, it searches for counterexamples under several different assumptions, ties the result to a feasible new EHT measurement, and checks that choice on measurements it was not shown, including real 2017 nights.
How we built it:
Data layer: our own UVFITS reader for the EHT 2019-D01-01 release, validated two ways: (u, v) recomputed from station positions and Earth rotation match the files to 3×10⁻⁵, and the reconstruction's bright side lies in the south as in the published images. Scan averaging, per-station sensitivities recovered from the released error bars, and the EHT's 2% systematic error budget.
Physics layer: a differentiable PyTorch forward model from an image to closure phases and log closure amplitudes, using a maximal linearly independent set per scan (chosen greedily by noise, which the matroid greedy theorem makes optimal), so station gain errors cancel exactly.
Image AI layer: seven batched image representations with different built-in assumptions: entropy-regularised pixels, total-variation pixels, two coordinate neural fields with random Fourier features, a deep image prior CNN, and two variational autoencoders we trained on 24,000 simulated black-hole images each, one set with knots and one without. A pure latent-space search could not fit the closures (reduced χ² above 2), so each learned prior regularises a free pixel image towards what its generator can draw: the cleanest rings of all, and a knot-free prior that visibly resists the knot.
Counterexample layer: constrained optimisation that minimises or maximises the feature while one-sided penalty walls keep the data fit and each model's own regulariser within limits. "Fits as well" is calibrated by a parametric bootstrap of each model's optimism (how much noise it absorbs), so the true image is accepted about 97% of the time and the allowance does not grow with the amount of data. Starts include twin pairs from each reconstruction, images with the region erased or brightened, and, after new data, the previous counterexamples.
Decision layer:173 feasible packages over the 2017 array plus the Greenland Telescope, Kitt Peak and NOEMA, scored by the minimum noise-weighted separation over witness pairs divided by cost; five comparison strategies.
Interface: FastAPI with server-sent events streams the search live (you watch the two explanations form); a vanilla JS + D3 page renders plates, fits, intervals, the globe and the plan. The same page runs as a static site replaying precomputed results. One double-click (run.bat) or one command (bash run.sh) installs and starts everything.
Challenges we ran into:
The sign of the sky.* Our first real M87* reconstruction was bright in the north. The data files use the conjugate phase convention of our forward model; conjugating them put the bright side in the south.
Hot pixels. Pixel images optimised with Adam developed speckle: Adam normalises each pixel's step, so pixels the data barely constrain still wander. L-BFGS, as in eht-imaging, fixed it.
A rule for "fits as well". A χ²-per-datum rule loosens as data accumulate, so an uninformative night made the ambiguity worse; a fixed Δχ² rejected the true image itself, because flexible models overfit the noise. Measuring each model's optimism by bootstrap solved both.
Unstable multipliers. Lagrange multipliers exploded whenever a warm-started Adam step overshot; one-sided quadratic penalty walls and a ramped learning rate replaced them.
A learned prior too rigid to fit. Searching only the VAE latent space left χ² above 2; turning the generator into a regulariser on free pixels kept its belief and let the data speak.
*A search that forgot what it had found. Our first benchmark caught a case where, after a new night, the re-imaged references fell into the ghost-knot basin and the search lost the knot-free explanation the true image proves exists. Carrying previous witnesses forward and seeding starts with the region erased fixed it, and changed how we measure success.
Accomplishments that we're proud of:
It refuses to confirm what the data cannot support. In our benchmark of eight hidden truths, the classic single reconstruction reported a knot every time, so it was wrong for all four knot-free truths. Anelench answered "undetermined" in all eight cases and confirmed no false claim.
Real data, real check.* On the April 2017 M87* data, all seven reconstructions show a bright extension west of the ring; Anelench shows the data allow anywhere from 0.16 to 0.71 of the ring peak. Its predicted separations ranked the three held-back 2017 nights (April 6 > April 5 > April 10), and the revealed real measurements separated the explanations in exactly that order (median Δχ² 678, 602, 14).
A learned-prior bias, reproduced on purpose.** In synthetic test B the knot is real; five hand-built assumptions see it, and our generative model trained without knots erases it. Anelench makes that dependence visible instead of hiding it in one image.
Cheaper telescope time.** Anelench's planned nights matched the correct settlements of the maximum signal-to-noise and coverage strategies at 42% of their telescope time. Calibration that holds.** The bootstrap estimate of each model's noise-fitting optimism (26 to 31) matched the true image's actual distance above the best fit (24 to 34).
Failures we kept in the write-up.** One night of closure data rarely settles a faint feature for any strategy (one case in eight); one verdict in 48 runs was wrong, and the reported range covered the truth only about half the time, because the search is local. We say so on the page.
What we learned:
"Fits the data" is not one number: how much noise a flexible image model absorbs decides whether a counterexample is legitimate. A learned prior is a strong opinion: the model trained without knots resists drawing one, which is exactly why no single assumption should decide alone. And the best observation for a question is often not the one with the most signal or the most new Fourier coverage.
What's next:
A lookahead check: simulate the top few nights under each hypothesis and re-search before recommending. Visibility amplitudes with explicit gain models, which would decide faint features sooner than closures alone. Diffusion priors trained on GRMHD simulations as further assumptions. Time-variable sources (Sgr A*), polarisation, and the 2018–2021 EHT releases.
Built With
- astropy
- d3.js
- fastapi
- javascript
- katex
- numpy
- python
- pytorch
- topojson
- uvicorn

Log in or sign up for Devpost to join the conversation.