-
-
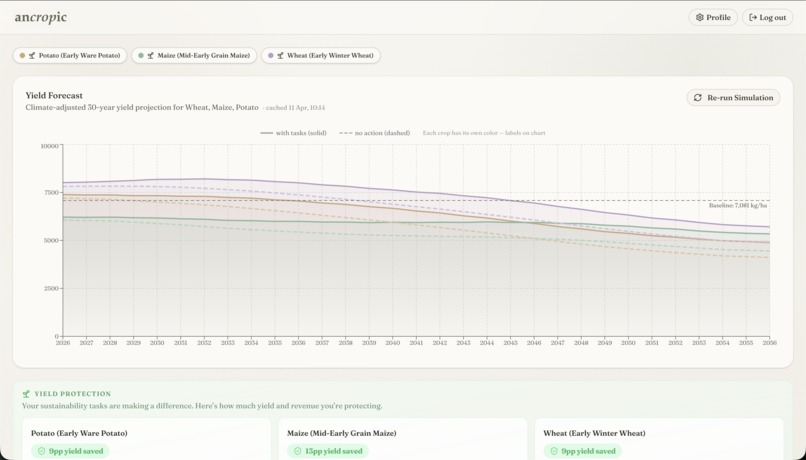
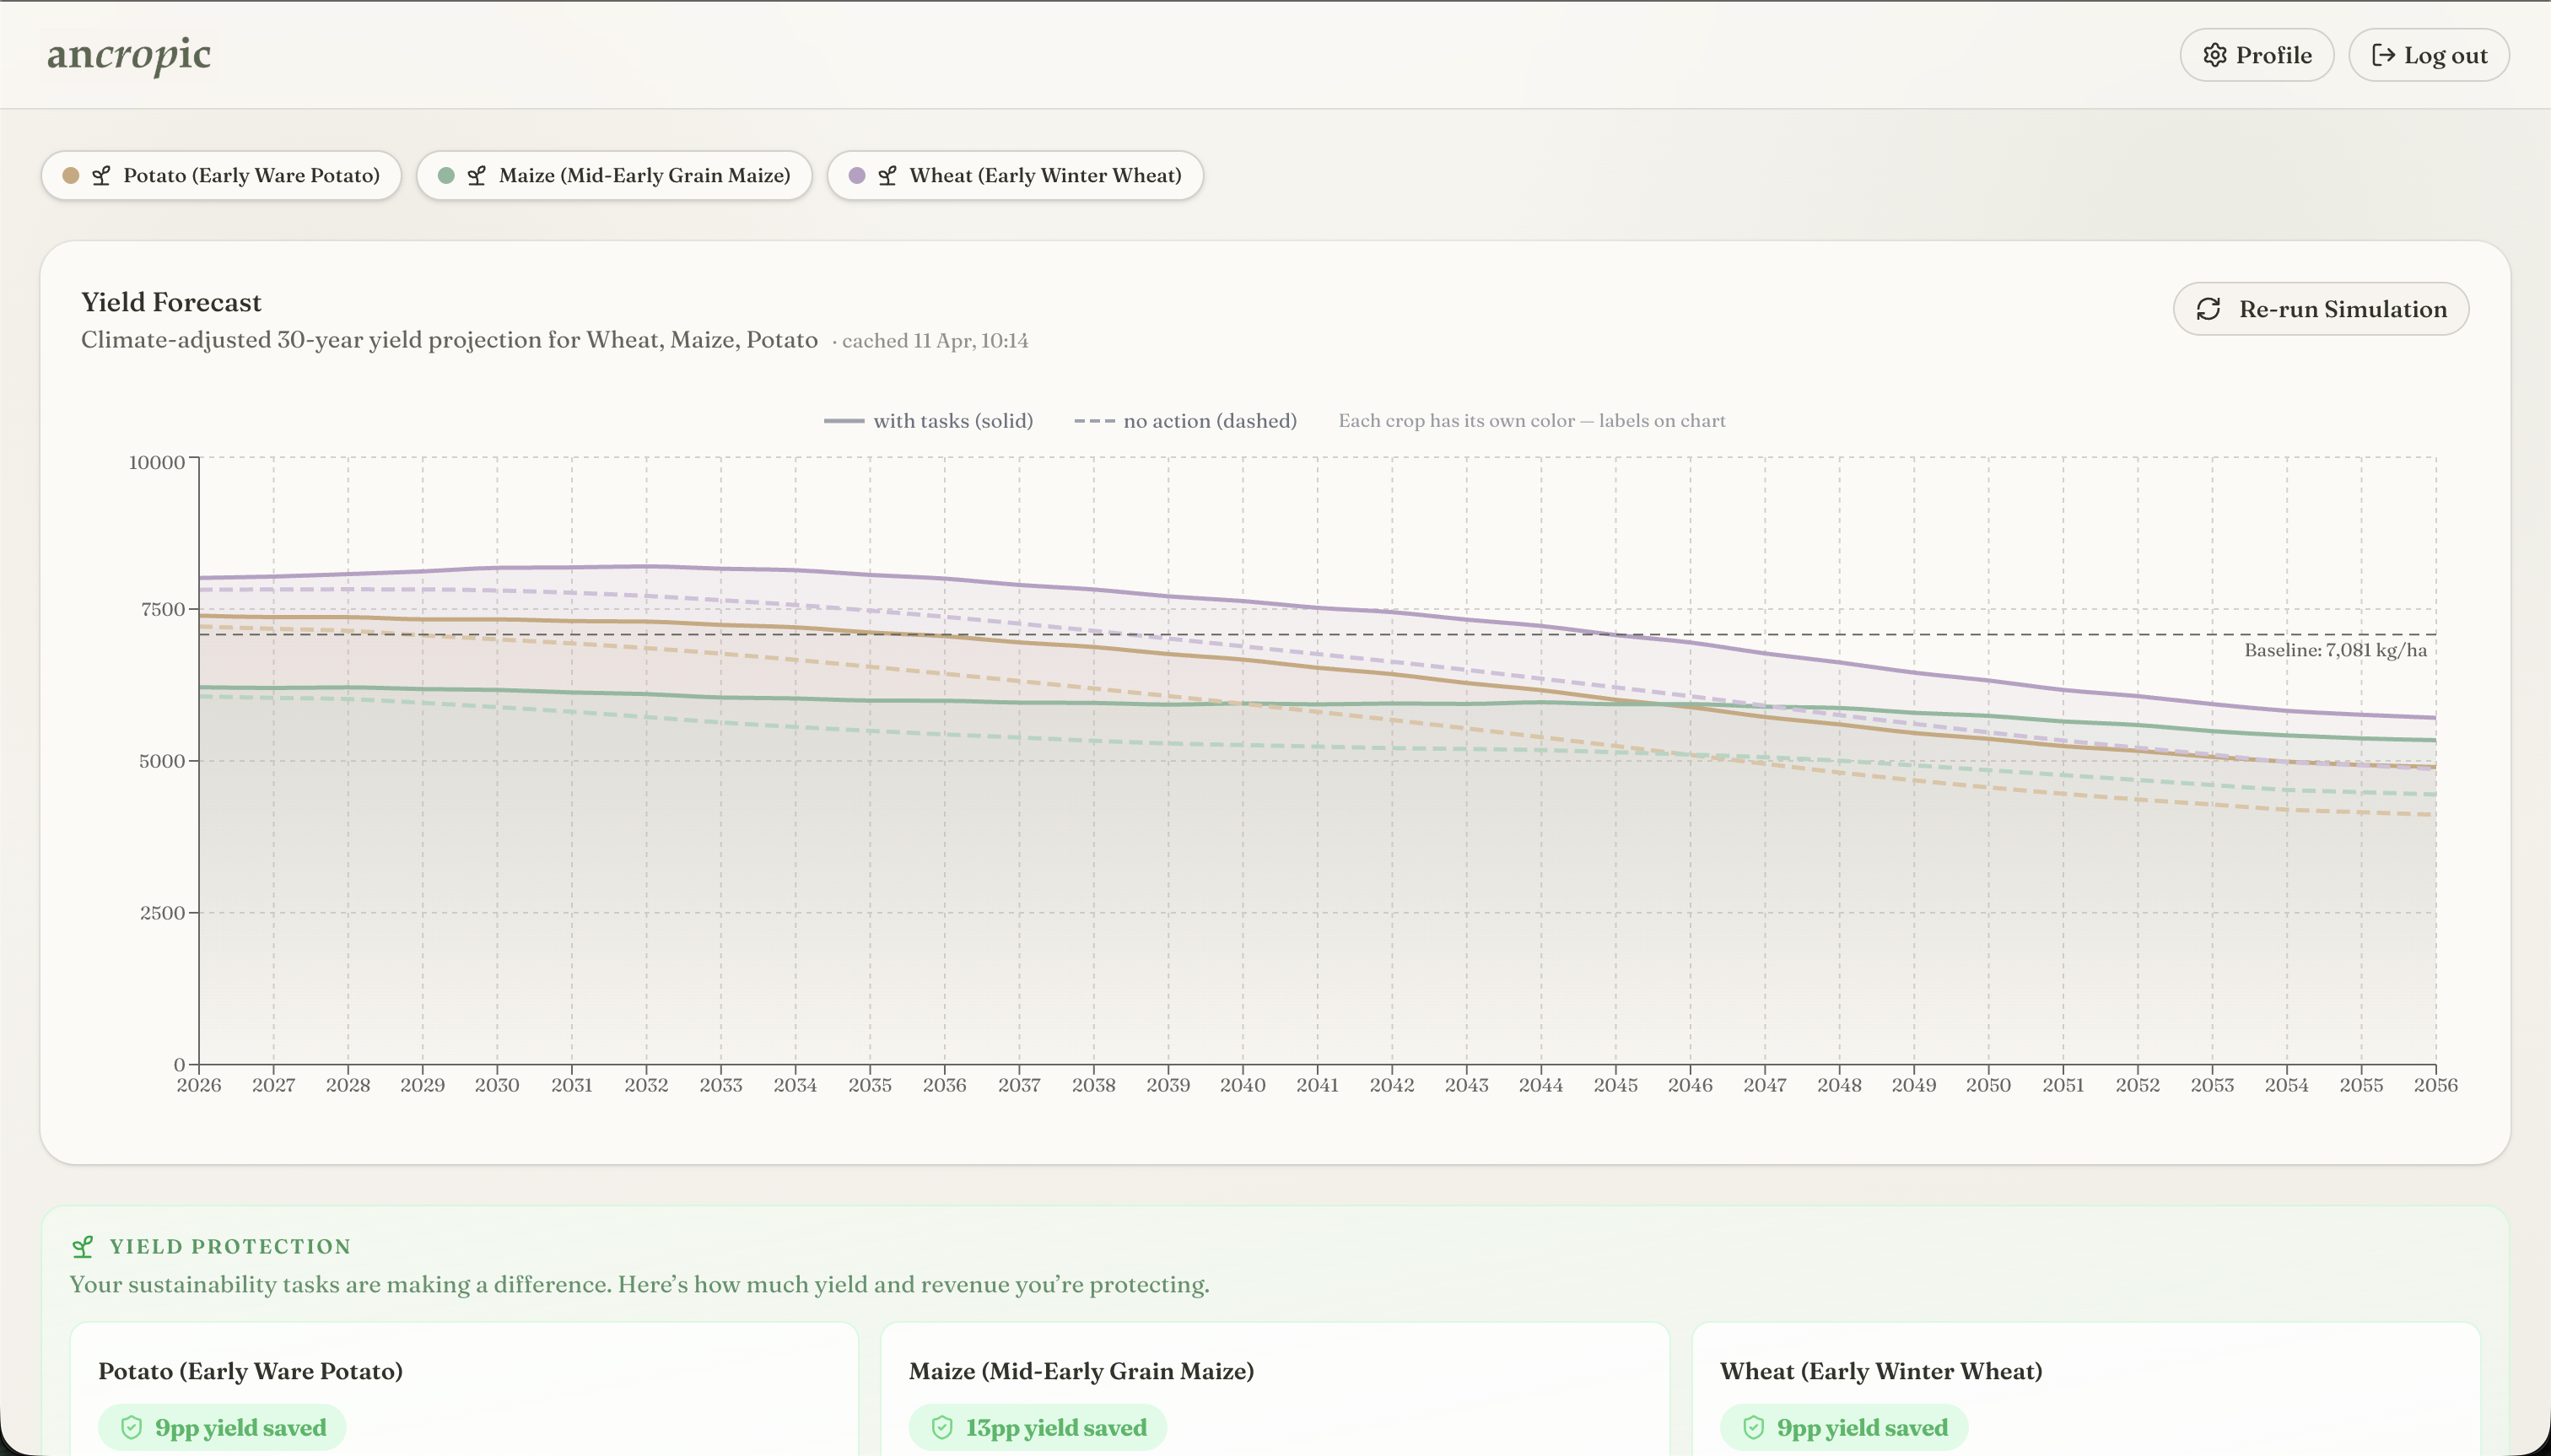
Main Dashboard 1
-
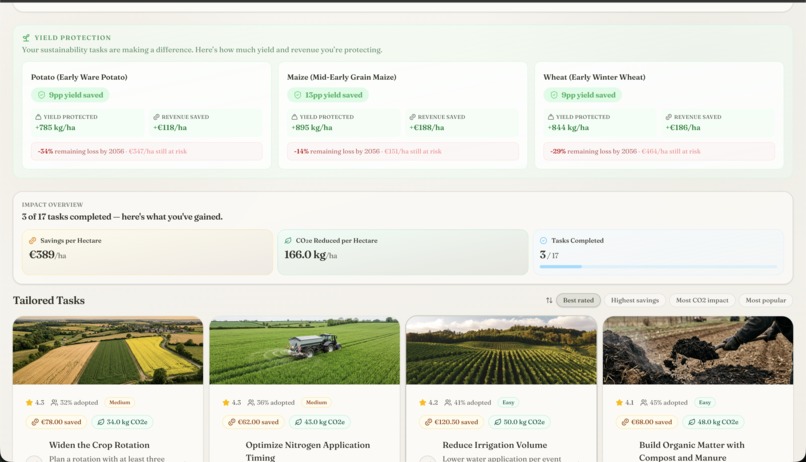
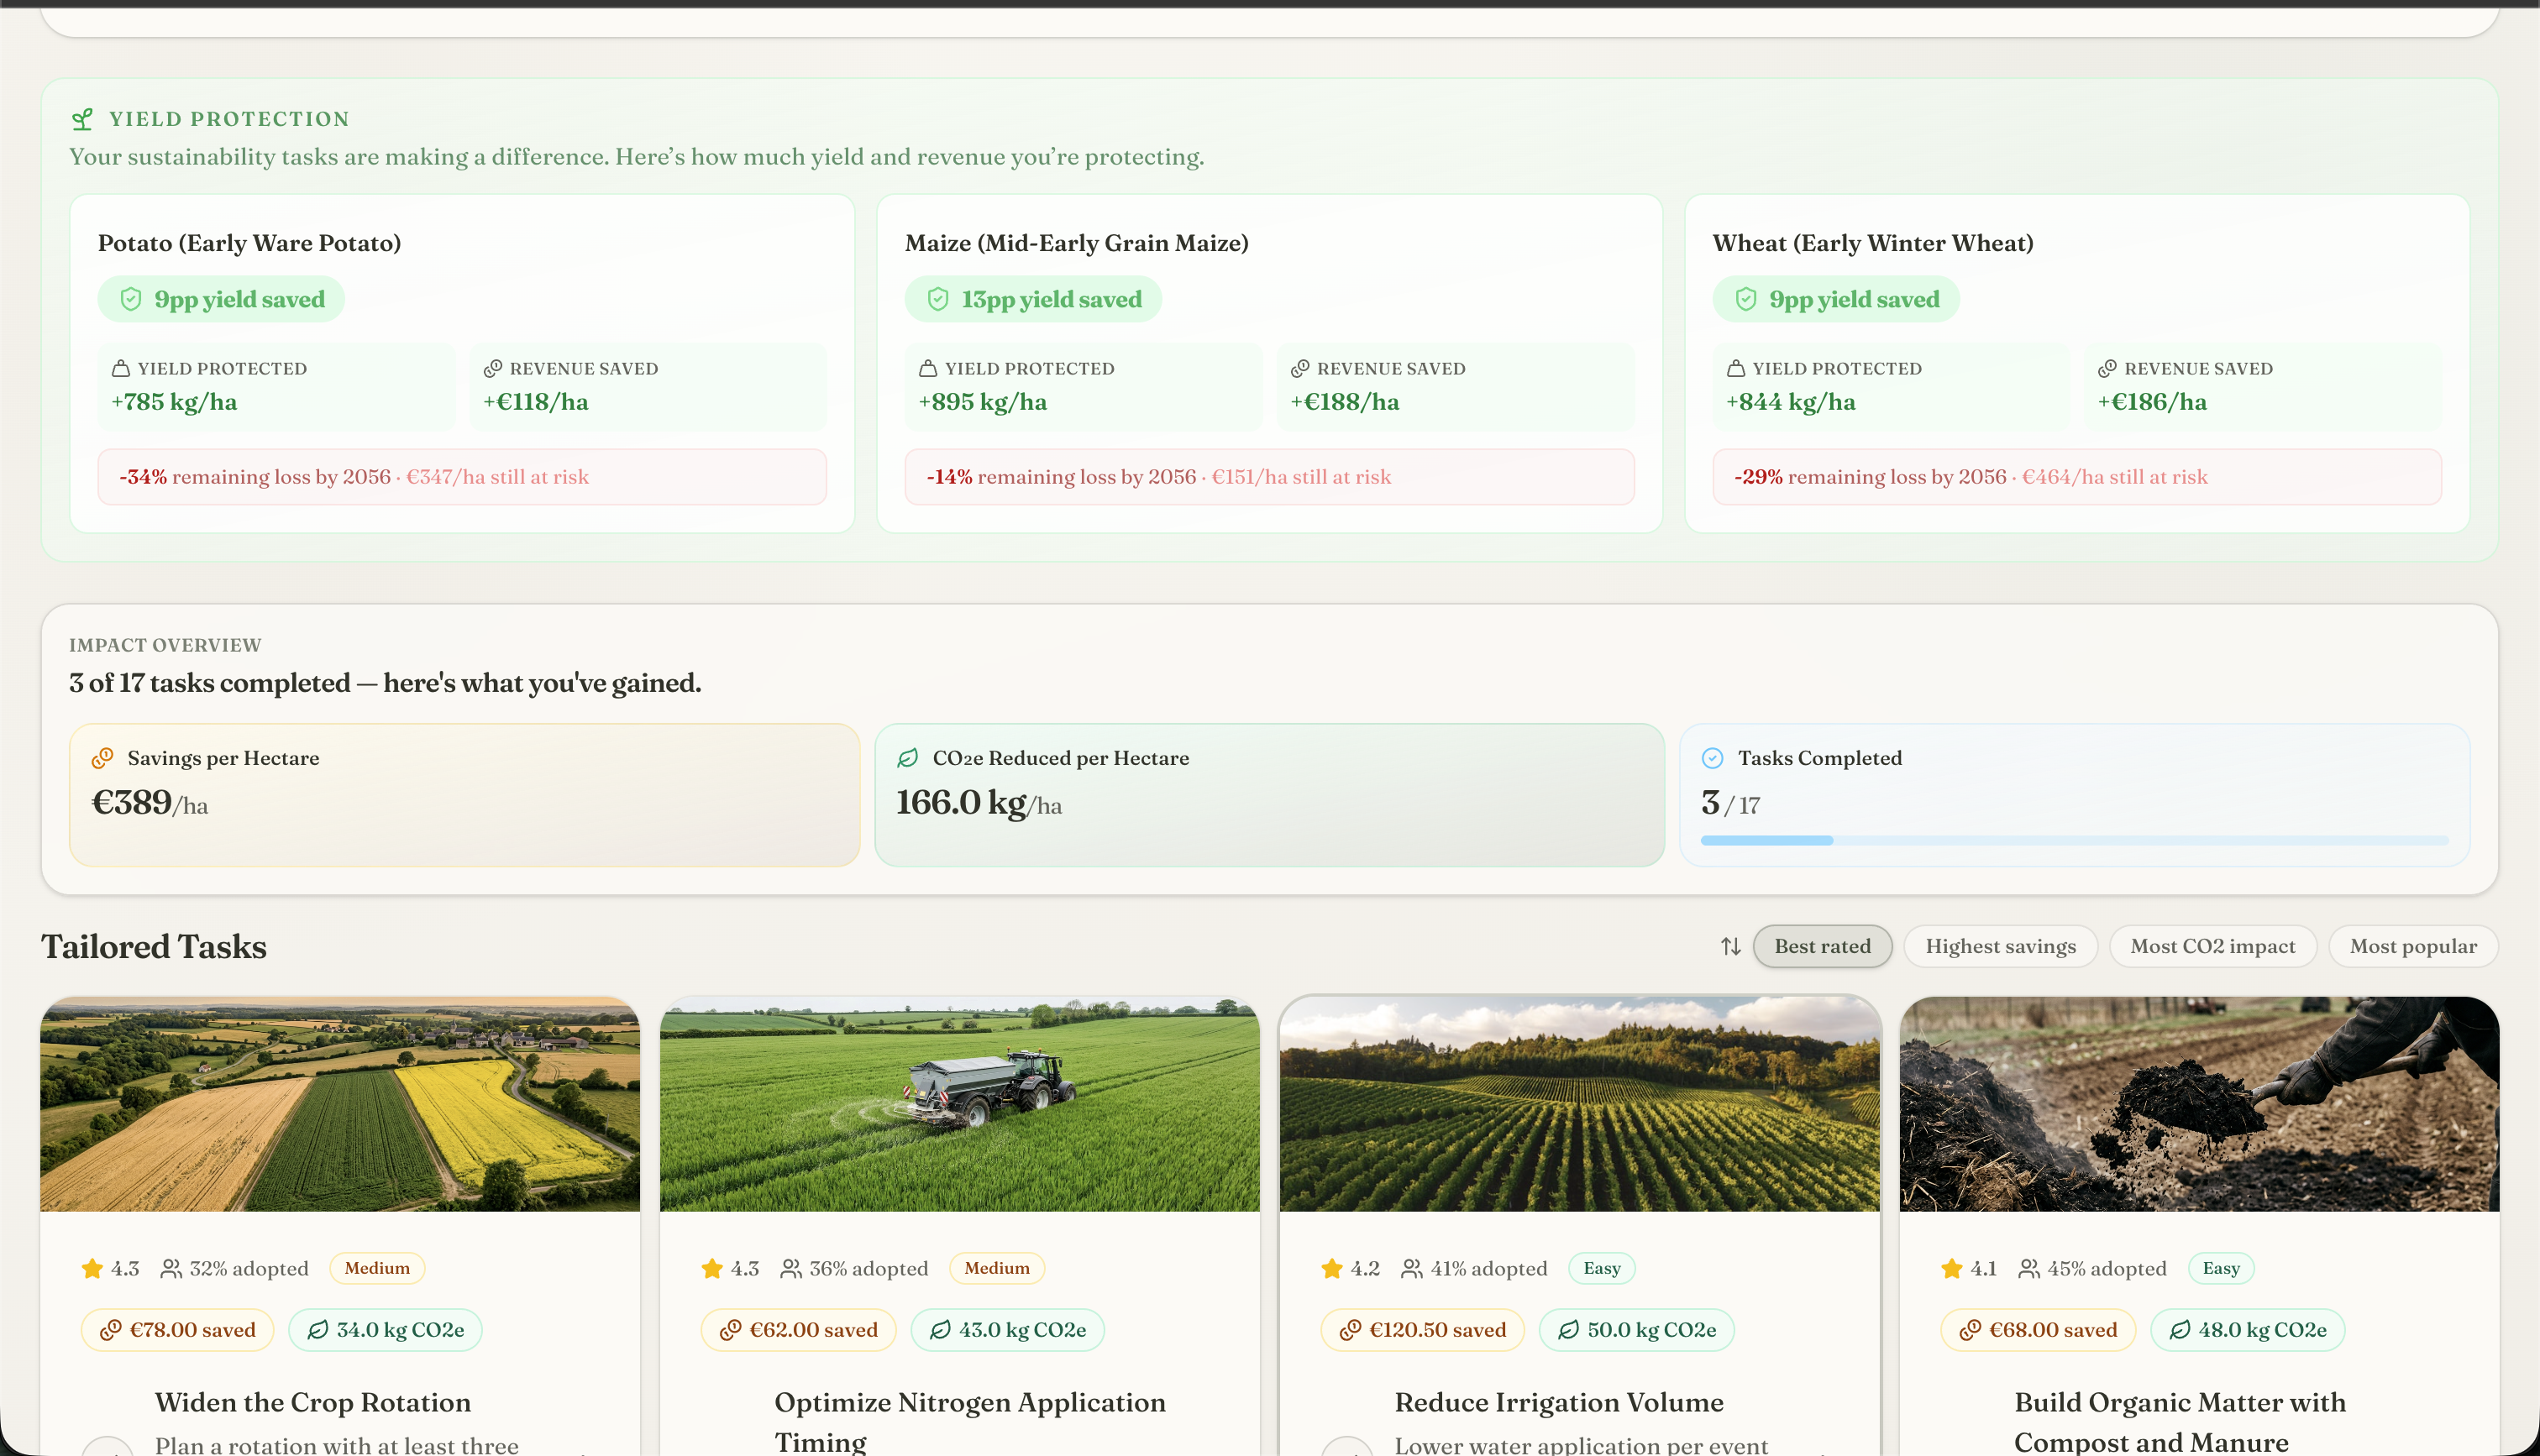
Main Dashboard 2
-
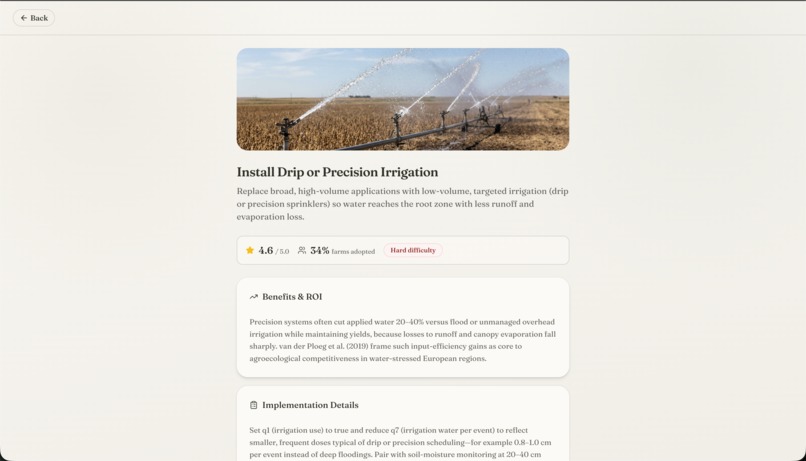
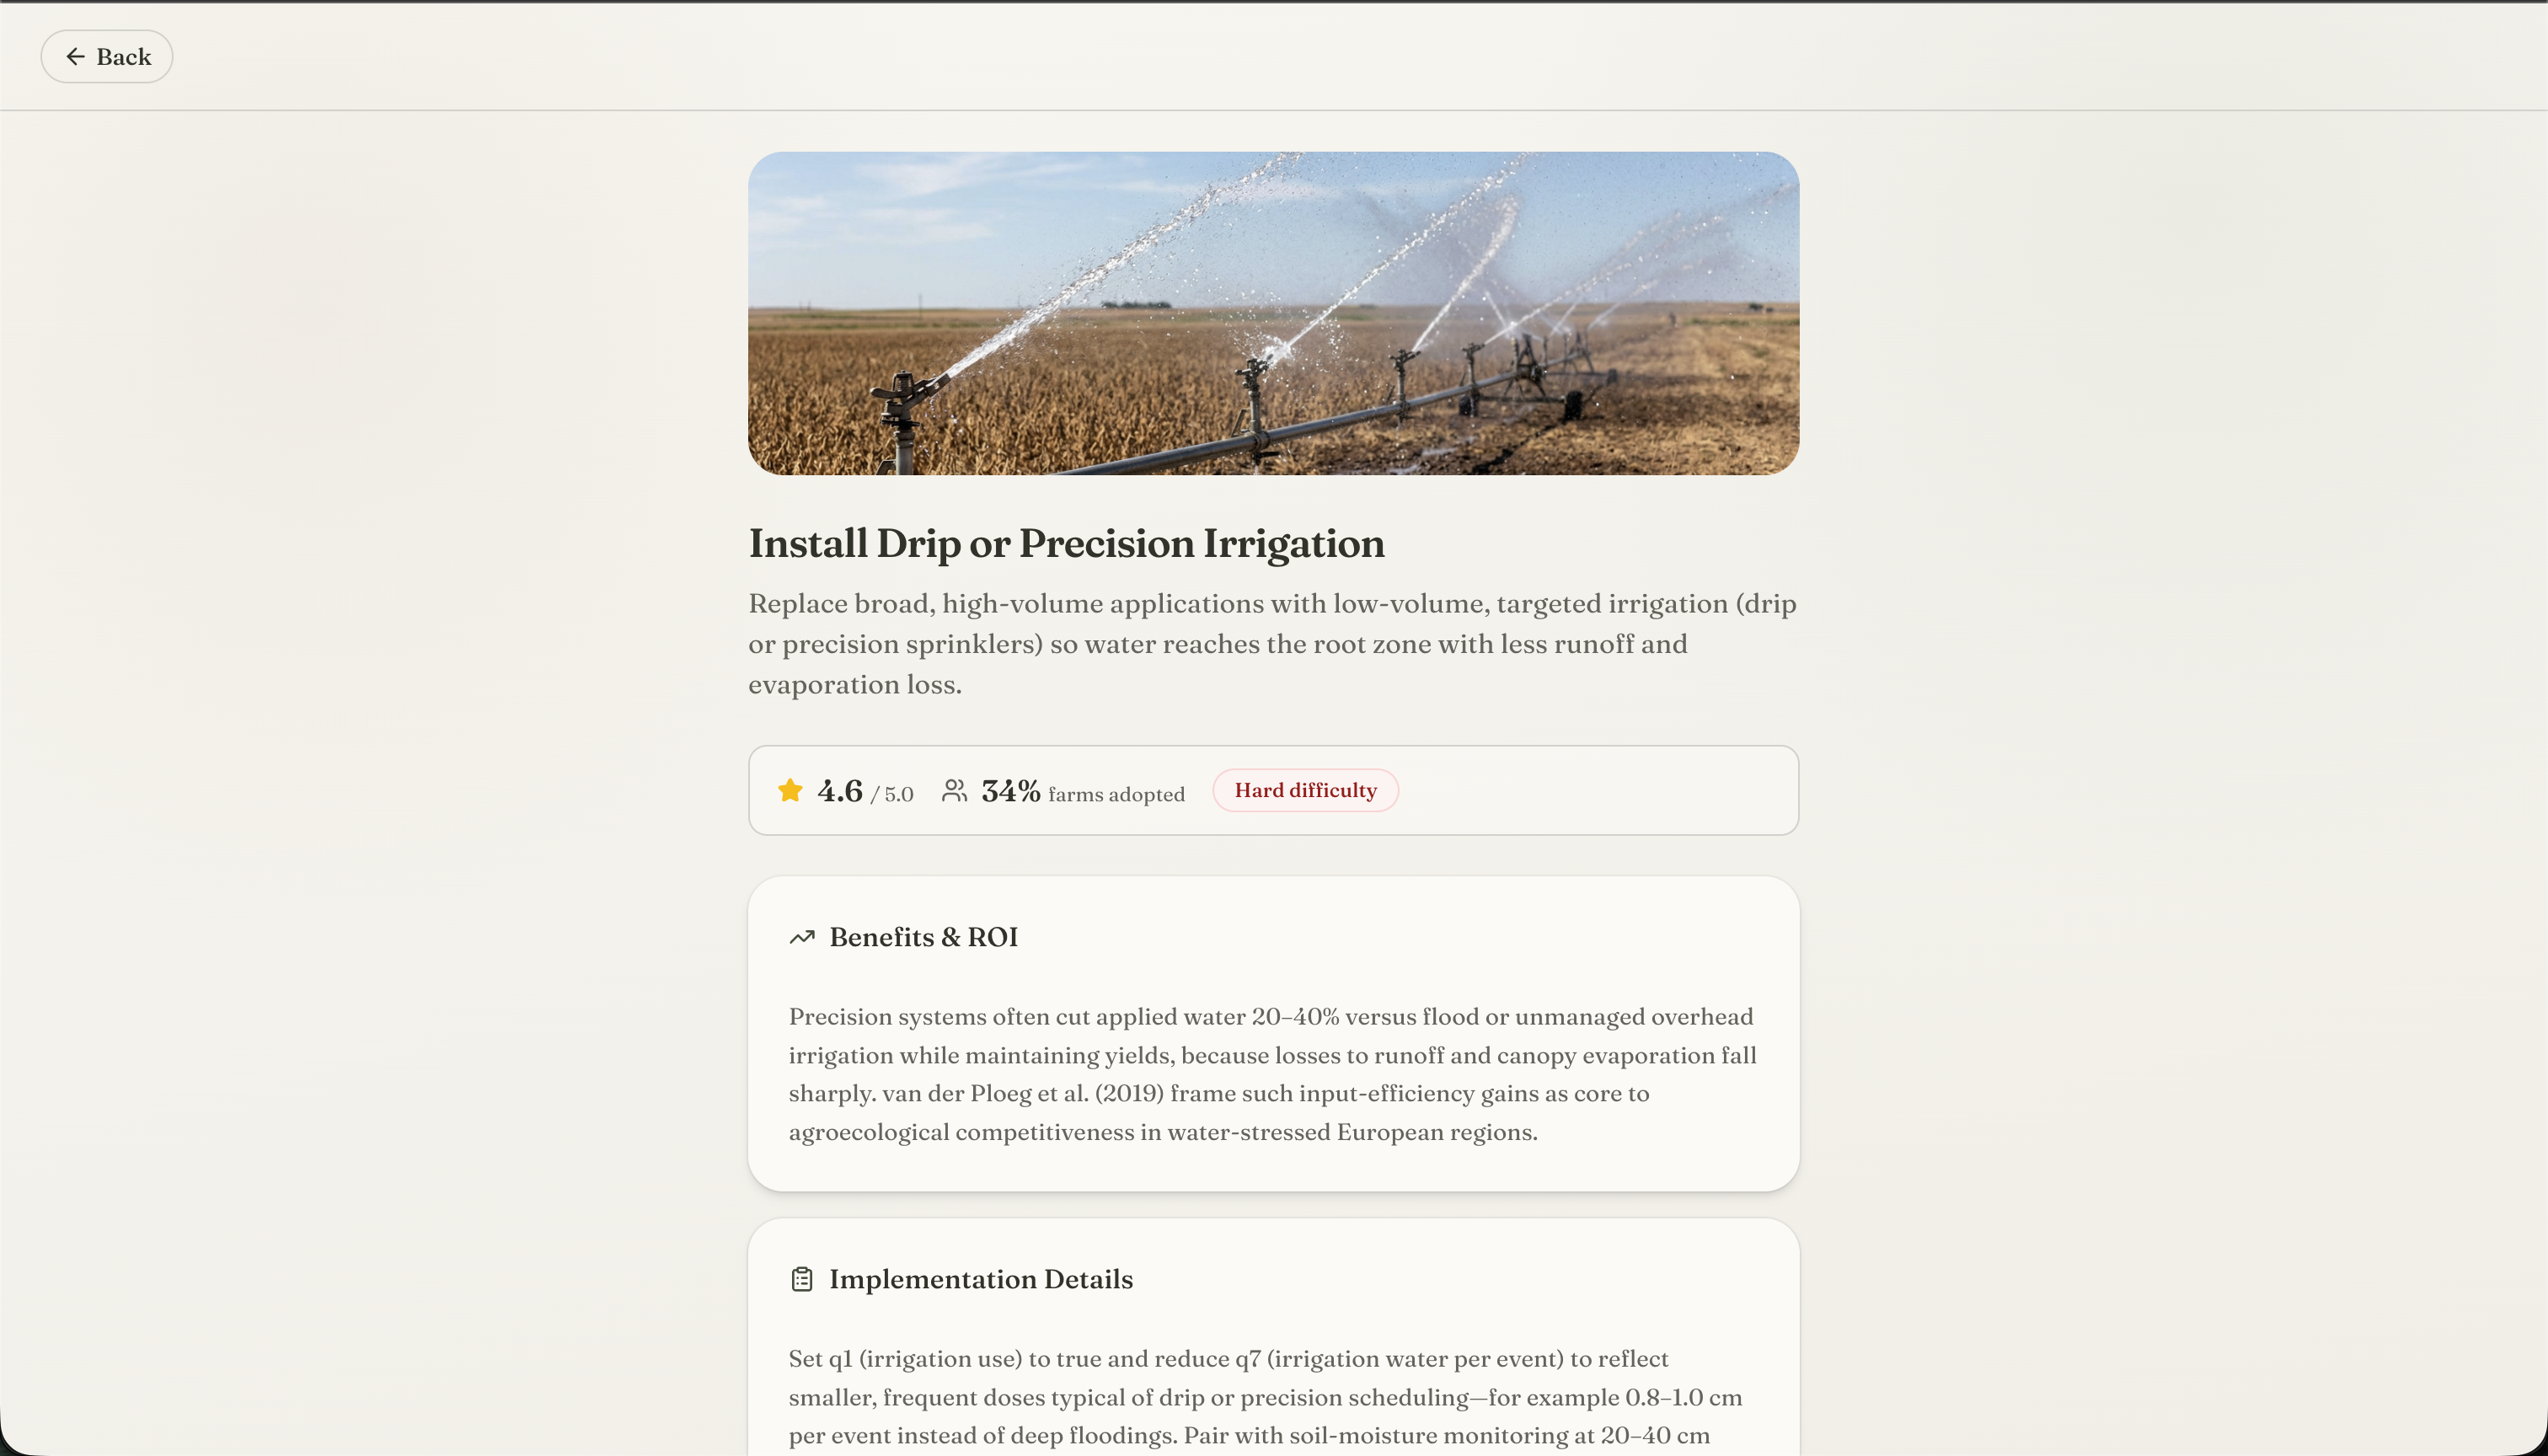
Task page 1
-
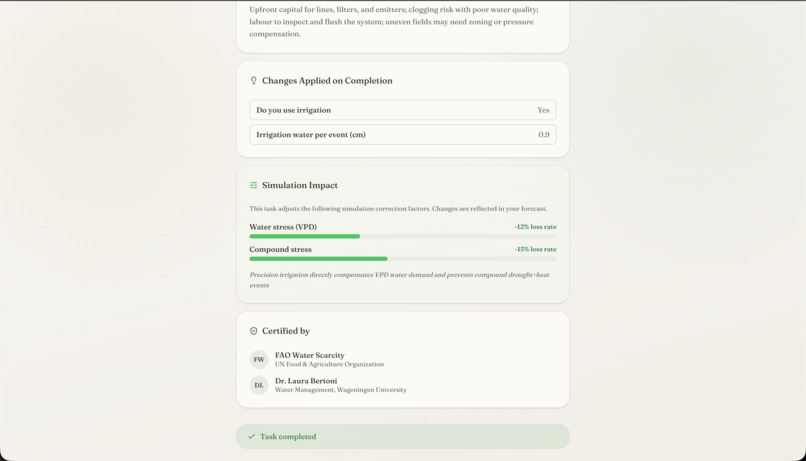
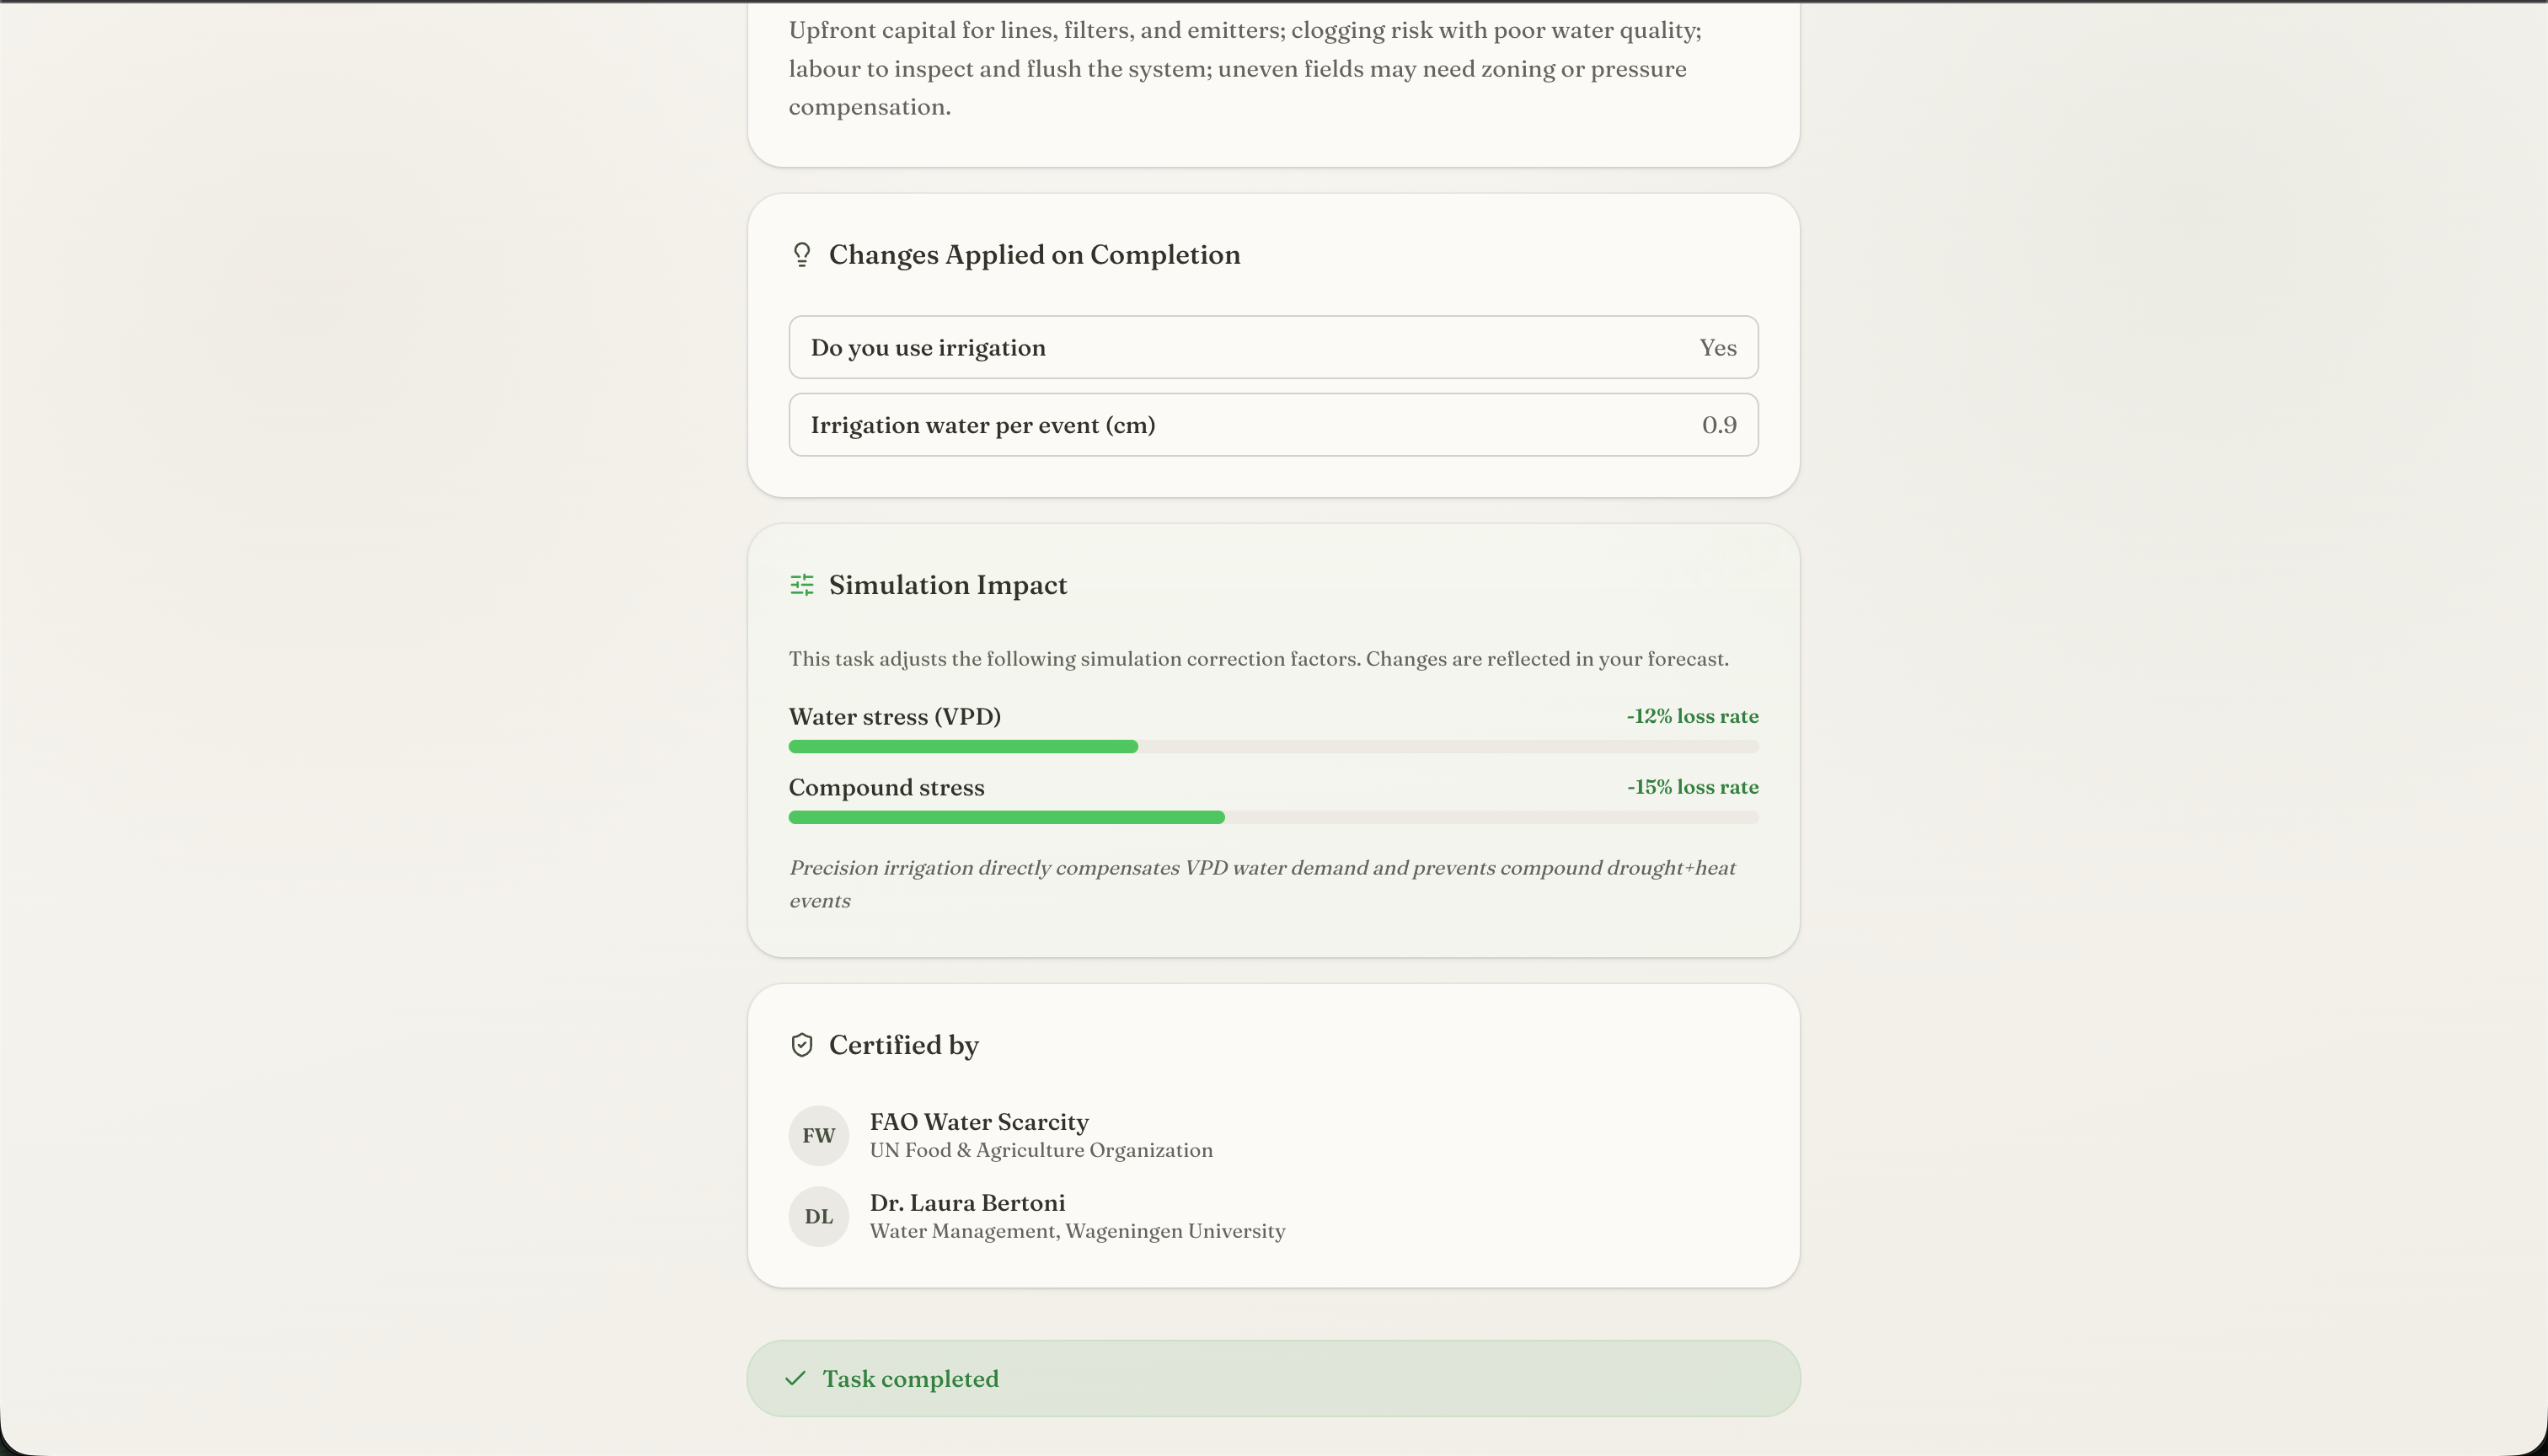
Task page 2
Inspiration
Farmers are on the front lines of climate change, yet they are often the last to receive the tools they need to adapt. A wheat grower in Brandenburg, a potato farmer in the Scottish Highlands, a maize producer in the Po Valley — each of them is already experiencing the slow shift: springs arriving earlier, summers growing hotter and drier, rainfall becoming less predictable season by season. The question is no longer whether the climate will change their harvest; it's by how much, when, and what they can actually do about it.
The problem we kept coming back to is one of translation. Climate science has produced extraordinary models — IPCC scenarios, SSP pathways, decades of peer-reviewed research on CO₂ effects on stomatal conductance and heat stress on grain fill. But almost none of that knowledge reaches the person standing in a field deciding whether to switch varieties, invest in irrigation, or plant cover crops. The gap between a research paper and a practical farm decision is enormous, and it is costing farmers real money and real yield.
We also noticed that existing tools tend to fall into one of two failure modes. Either they are so general — global temperature anomaly maps, broad regional projections — that a farmer can't derive any actionable insight for their specific plot, soil type, and crop rotation. Or they are so technical — WOFOST parameter files, NetCDF grids, Python notebooks — that only researchers with a modeling background can use them at all.
We wanted to build the bridge.
ancropic was born from the conviction that every farmer deserves a personalised, science-backed answer to a simple but urgent question: "What will my yields look like in 2040, and what should I do today to protect them?"
We chose to build on PCSE/WOFOST, the gold-standard process-based crop simulation framework developed at Wageningen University, because it models the actual biology — photosynthesis, transpiration, dry matter partitioning — rather than just fitting historical curves. We layered in NASA POWER satellite weather data so the model is calibrated to real conditions at the farmer's exact coordinates. And we applied a rigorous multi-factor correction pipeline — elevated CO₂, heat stress accumulation, VPD shifts, tropospheric ozone, soil water changes — derived from the latest IPCC AR6 literature, across three emissions scenarios (SSP1-2.6, SSP2-4.5, SSP5-8.5), so farmers can see not just one future but a range tied to humanity's collective choices.
The last piece of the puzzle was making the science usable. A forecast means nothing if it doesn't lead to a decision. So we built a task recommendation engine that filters a library of ~20 evidence-based adaptation practices — cover cropping, drought-tolerant varieties, precision irrigation, no-till, agroforestry, and more — to the farmer's specific profile, and quantifies each intervention in two currencies that actually matter on a farm: euros saved and tonnes of CO₂ avoided. Completed tasks roll up into a live impact tracker, giving farmers a tangible sense of progress against a challenge that can otherwise feel overwhelming and abstract.
Climate change is not a future problem for agriculture. It is already here, compounding silently in yield gaps and volatile harvests. We built this tool because farmers deserve to face it with the same quality of information that policymakers and researchers have — and because the transition to resilient, low-emission farming will only happen if the people doing the farming can actually see the path forward.
Built With
- fastapi
- pcse
- react


Log in or sign up for Devpost to join the conversation.