Analyzing Syracuse Complaint Resolution: Measuring Efficiency, Identifying Trends, and Addressing Key Challenges
Daniel Canhedo - CuseHacks Datathon 2025
📌 Introduction
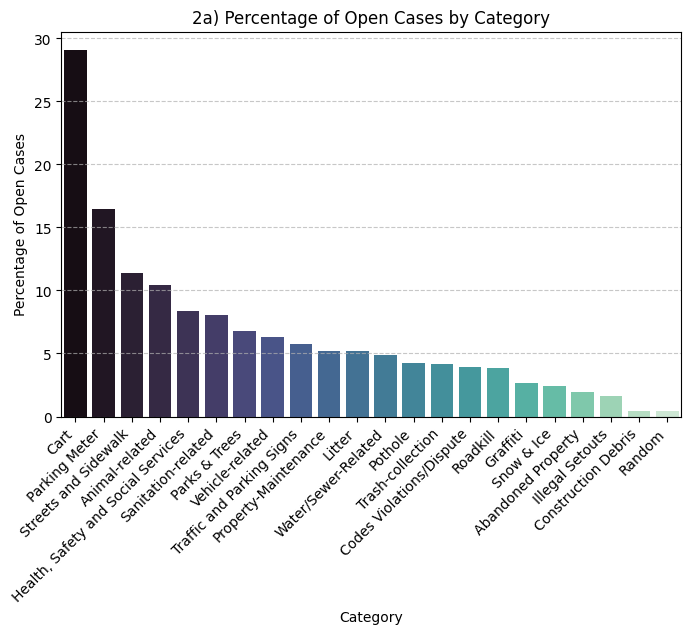
This analysis explores how efficiently Syracuse handles municipal complaints through the SYRCityline dataset, which contains reports on non-emergency issues submitted by residents. The goal is to understand:
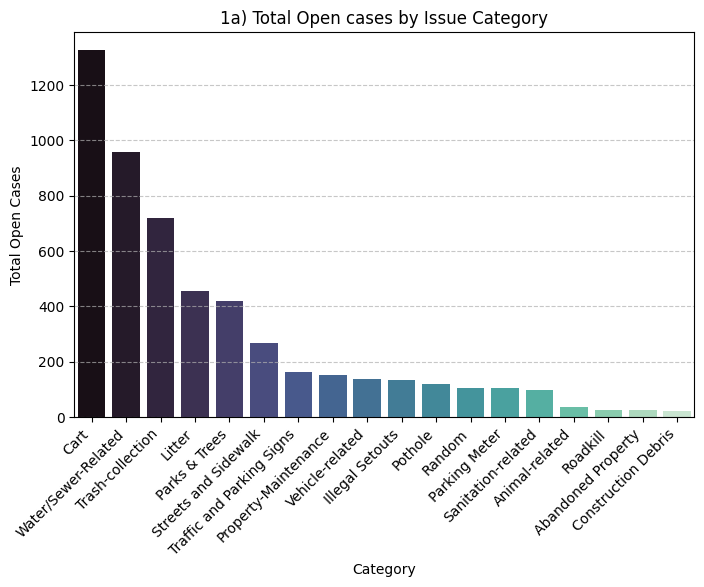
- Which types of complaints are most common?
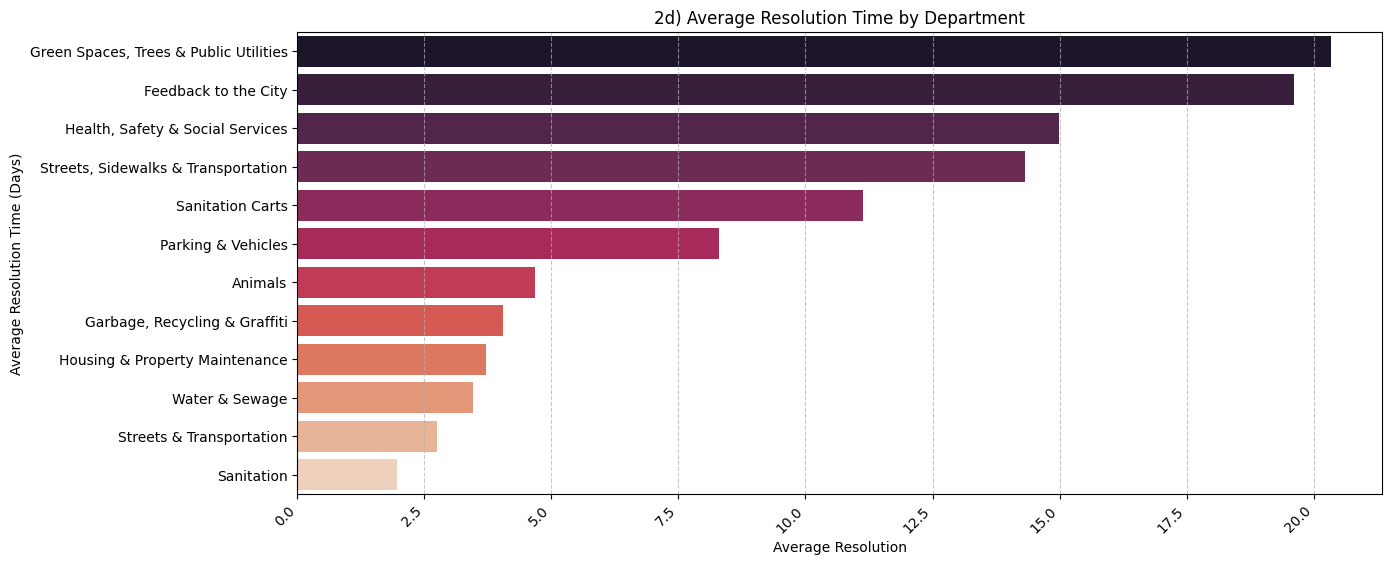
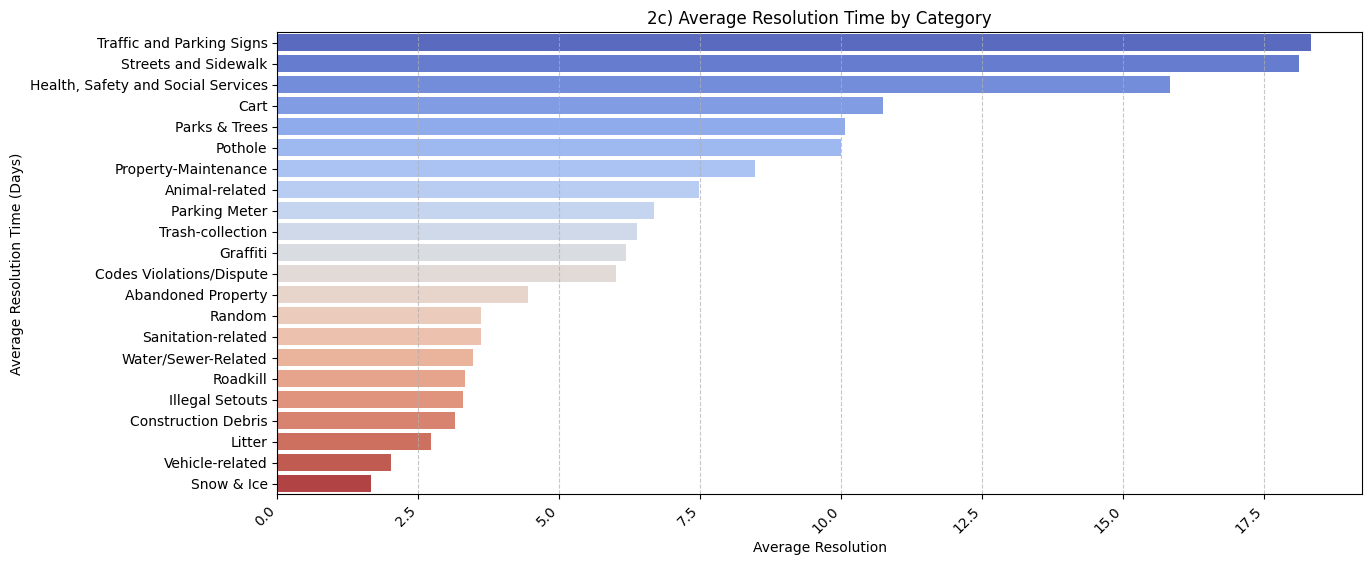
- How long does it typically take to resolve different issues?
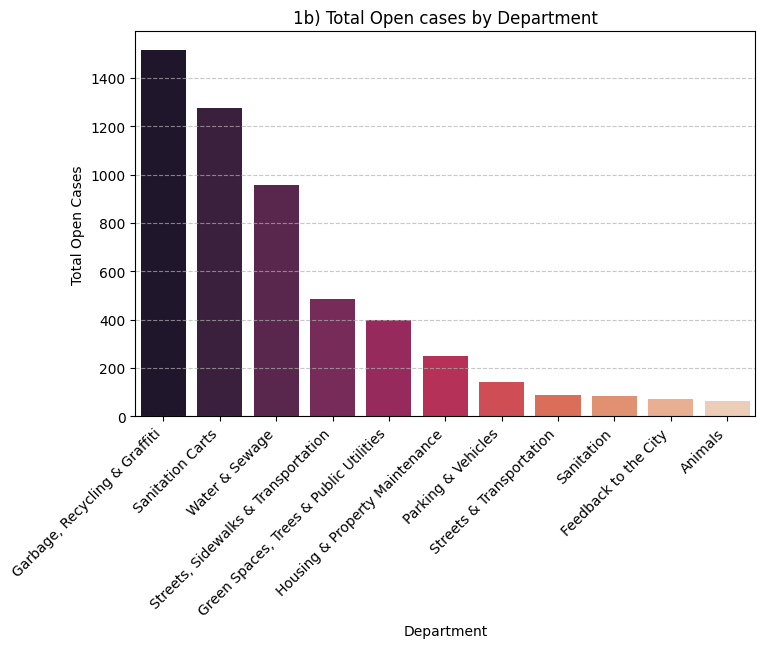
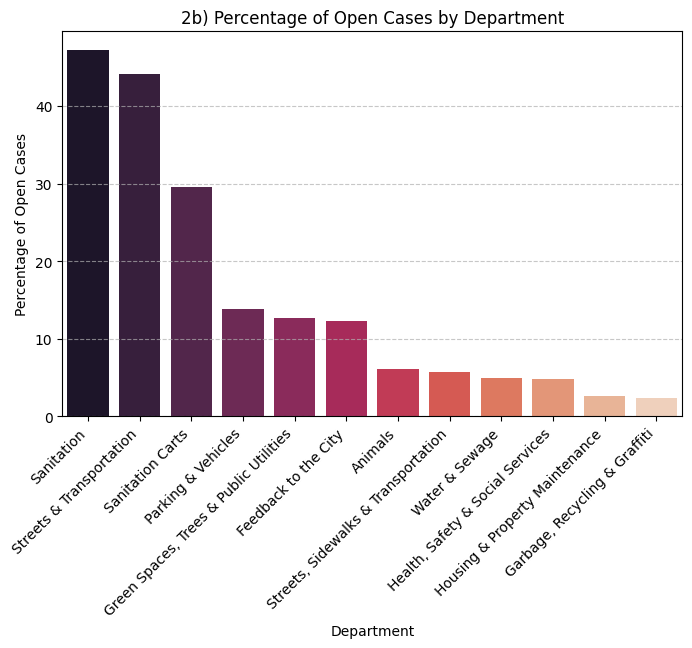
- Which departments are most efficient in addressing complaints?
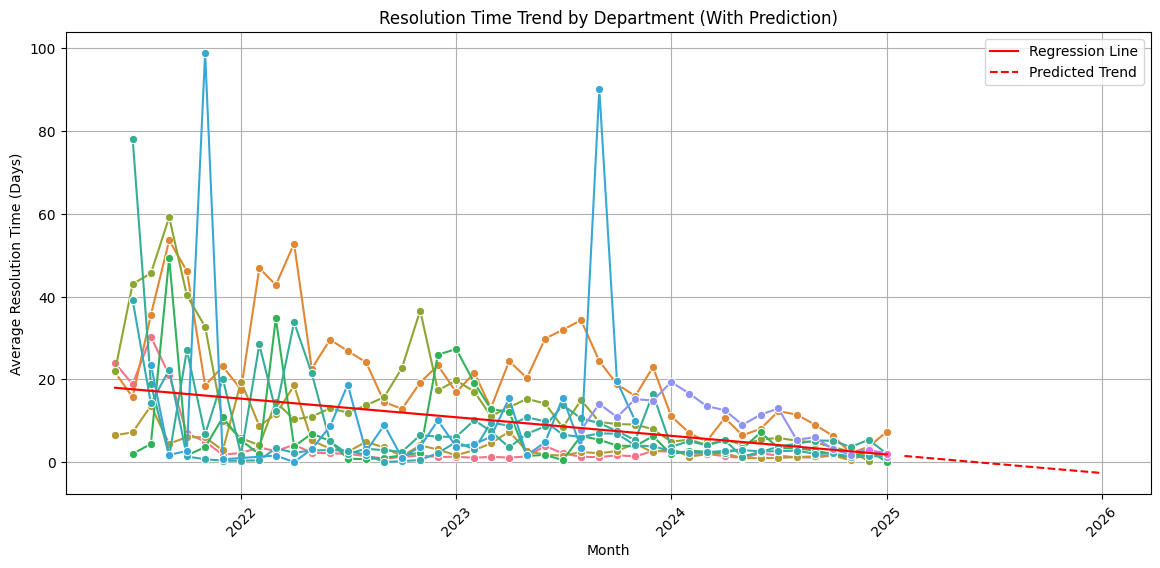
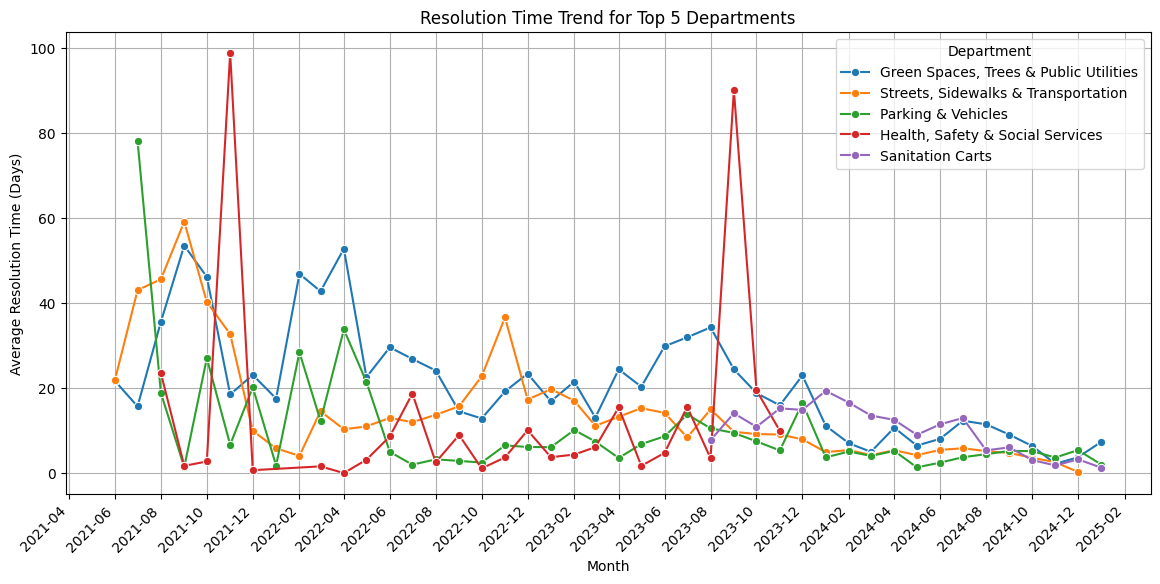
- How has response time changed over the years?
By answering these questions, this project aims to identify bottlenecks in issue resolution, trends in complaint handling, and provide insights that could help improve municipal services.
📊 The Dataset: SYRCityline
SYRCityline is a platform that allows Syracuse residents to report various issues across the city, including:
- Infrastructure: Potholes, streetlights, traffic signals, sidewalks, vacant buildings, cart issues, missing street signs.
- Sanitation: Trash collection, illegal dumping, bulk setouts, debris on roads.
- Animal-Related: Dead/loose animals, roadkill, animal control.
- Weather-Related: Snow plow requests, tree limb obstructions, water main breaks.
- Vehicle-Related: Parking violations, abandoned cars
Each report includes a timestamp, issue category, assigned department, and resolution status, allowing us to analyze trends in complaint response efficiency.
❓ Key Research Questions
1️⃣ Which issues take longest and shortest to resolve?
- What is the average resolution time per complaint type?
- Which departments close the most cases?
- Which types of issues take the longest to resolve?
- Which departments have the longest average resolution time?
2️⃣️ How Has Response Time Changed Over the Years?
- Has the city's response efficiency improved or declined since 2021?
- Do certain departments show improvements over time?
🔬 Approach & Methodology
To explore these questions, we will use:
- 📊 Data Visualization:
- Bar charts for issues distribution
- Line charts to track resolution trends over time
- 📈 Machine Learning Predictions:
- Linear Regression: Predicting resolution time based on complaint type.
- Decision Tree Regressor: Predicting future resolution performance across all departments (For the future)
By leveraging data analysis and predictive modeling, we can uncover actionable insights to help improve complaint resolution efficiency in Syracuse.
Built With
- matplot
- numpy
- pandas
- python
- scikit-learn
- seaborn

Log in or sign up for Devpost to join the conversation.