Inspiration
I am very inspired by data and wanted to visualize and analysis a dataset thats relevant. Something that is relevant to me is Health. Given this I searched and found a large data set that involved real life malpractice reports.
What it does
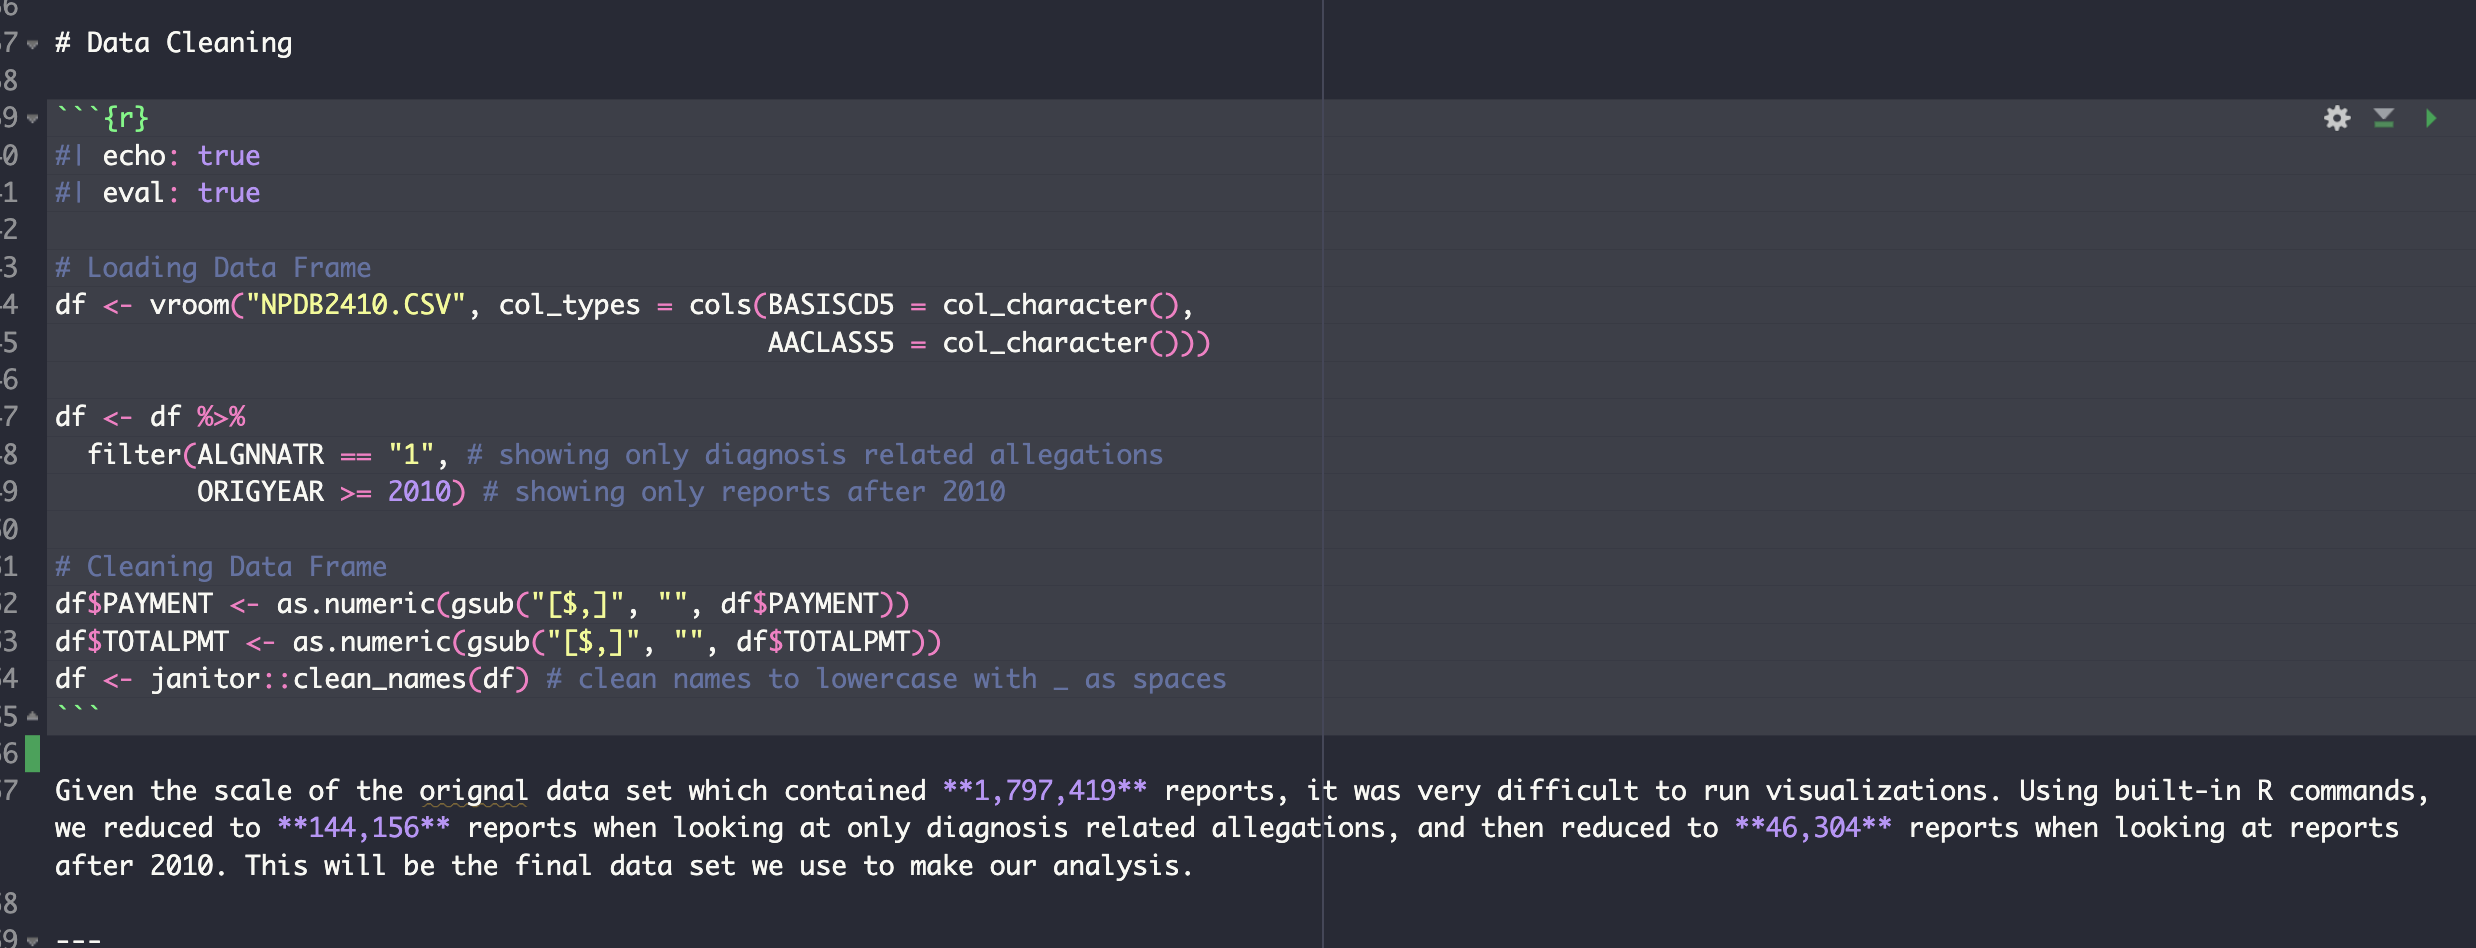
The code is written in R and rendered with Quarto, it cleans and structures the data, creates visualizations, and I give some in depth analysis about the visualizations.
How we built it
I used R for the code and Quarto for the file output.
Challenges we ran into
One big challenge was wrangling the dataset, due to the size it was difficult to even load it. It took a long time but after cleaning and structuring the data to what I needed, I was good.
Accomplishments that we're proud of
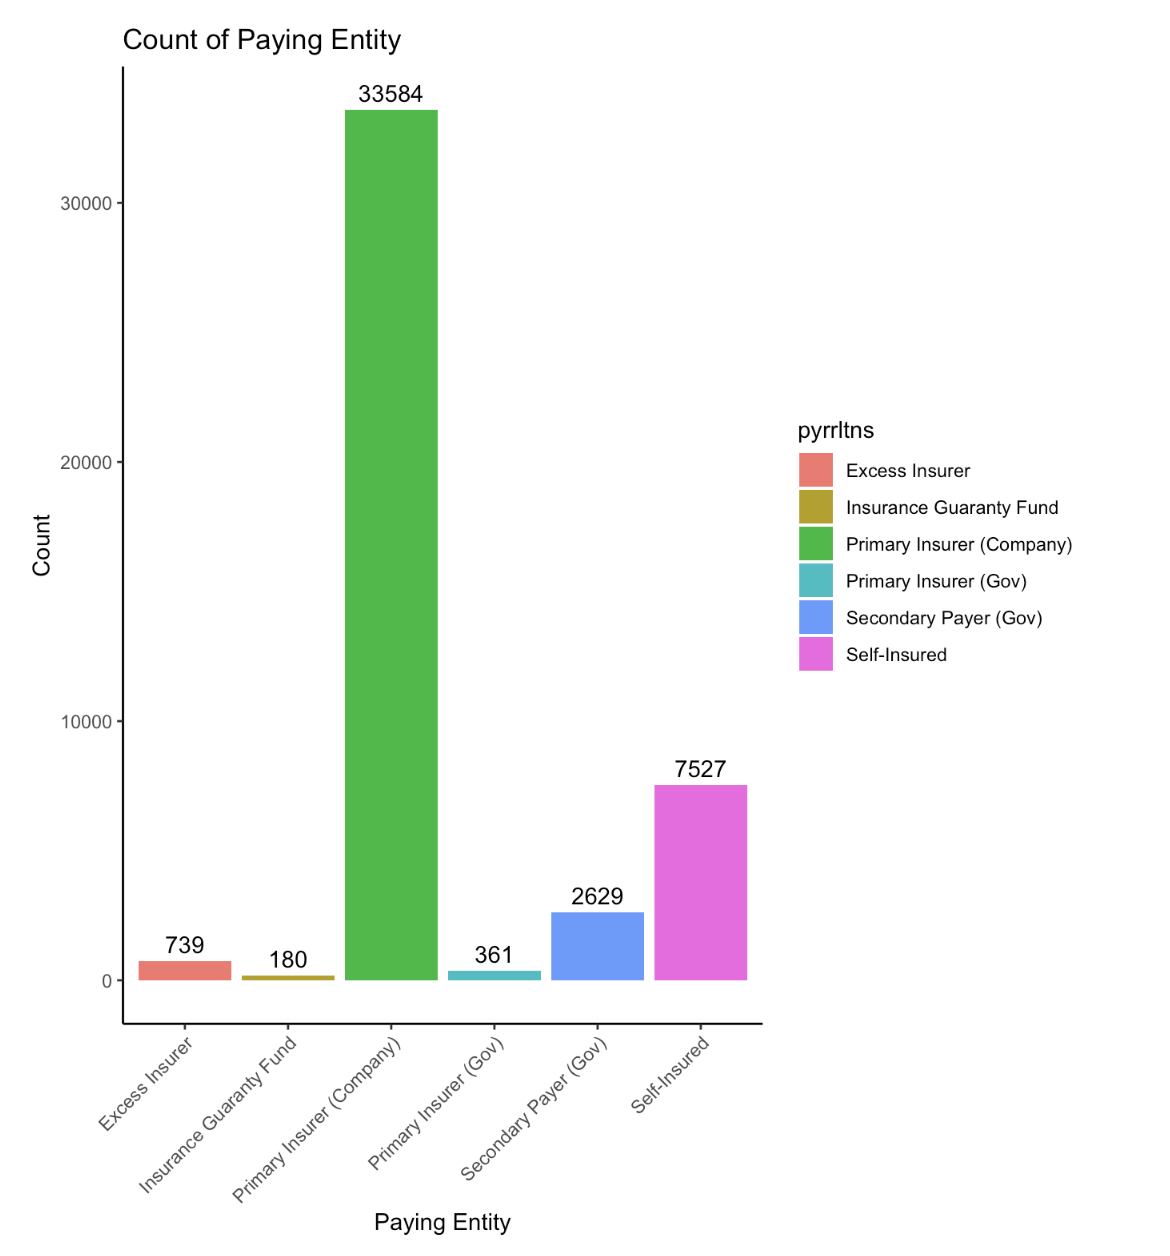
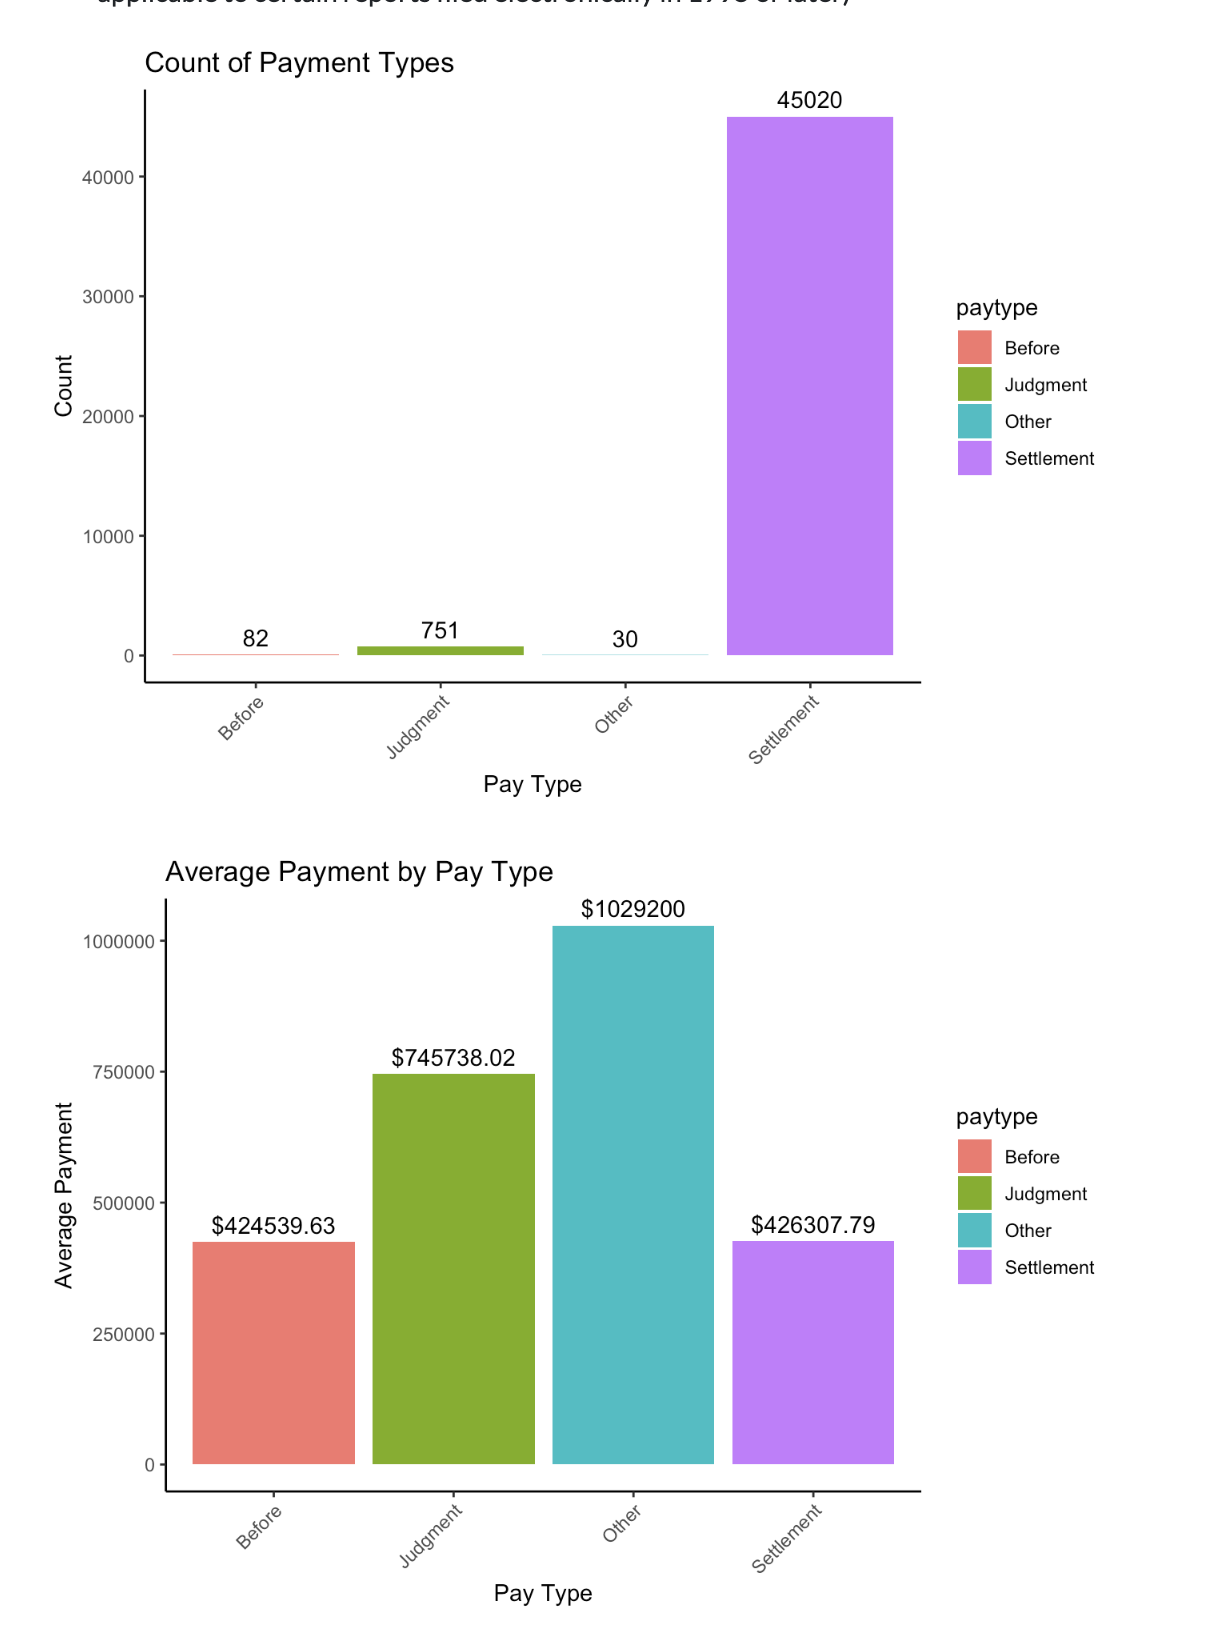
I proud of the analysis I did, and the visualizations. Although both simple they reveal things that wouldn't have been easily found in such a large dataset.
What we learned
I learned that visualizations can help in interpreting data sets such as these.
What's next for Analyzing Misdiagnosis Compensations
I would love to further analysis the play with the dataset and create more visualizations.
Built With
- quarto
- r
- rstudio

Log in or sign up for Devpost to join the conversation.