-
-

Dash 1
-

Dash 2

Inspiration
I love Data, NFT and Solana. We don’t see Hackathons for Blockchain analytics often, This was the perfect opportunity.
I started by exploring Magic Eden API data with one thing in mind : getting better actionable data on Solana NFT collections.
What it does
User segmentation is a powerful tool but it’s not used for NFT analytics, most tools only focus on floor price fluctuation and factual data like number of holders.
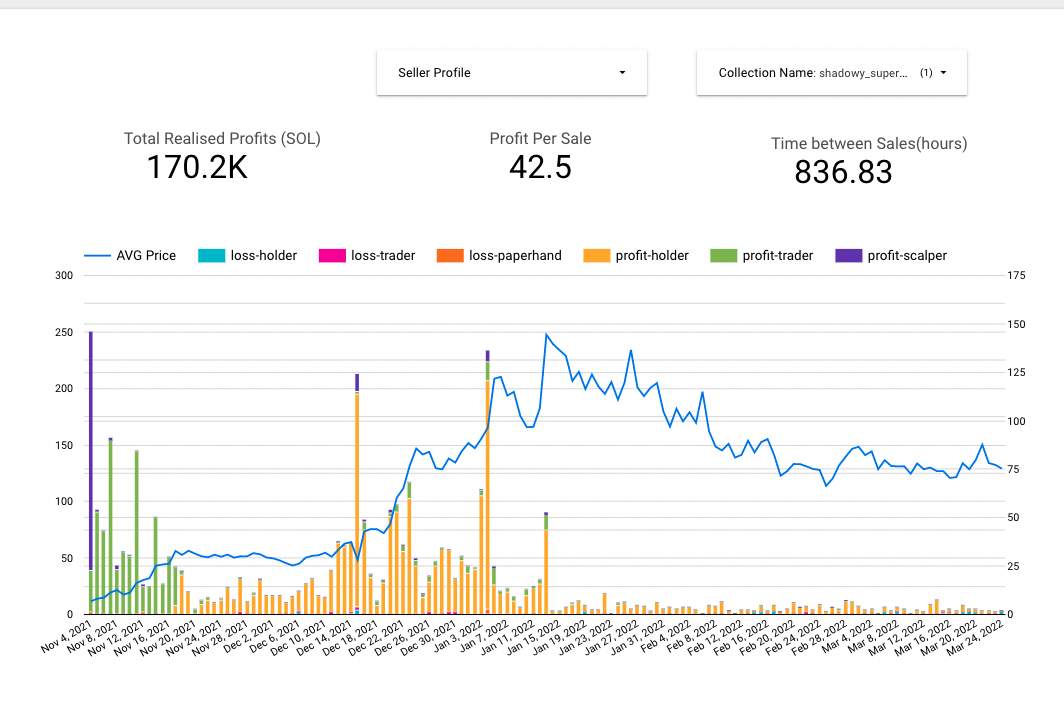
By combining the hold duration and profit status of a sale we can cluster a sale of an NFT into 6 categories :
Paperhand, scalper, profitable trader, regretoooor, OGs, and Capitulatooor
Depending on who is selling, you can better evaluate a project’s health and opportunity.
- Are the seller euphoric (more in profit holders) ?
- Are they having regrets and not believing in the project ( more ogs selling at a loss) ?
How I built it
I used pandas to enrich the data collected. Two important metrics are necessary to build this classification : Realised profit : this metric subtracts the current sale amount by the previous sale, or uses the mint price as a reference. This number can also be negative if the collection didn’t bring the expected value
Time between sales : Similar logic to the previous metrics but instead try to evaluate the hold period. This metric also allows us to segment the type of sellers.
Automation is done with Goodle Cloud Run, ME API is called to update the Postgres database. For rapid prototyping, I used Google Data Studio for visualisation. A frontend will be built later
Challenges I ran into
The first big challenge was getting historical data, unfortunately the public endpoint , only allow you to collect 600 activities, you can go beyond it even by using the offset.
/collections/:symbol/activities
However, from the ME frontend, I was able to use getGlobalActivitiesByQuery rpc method and gather the information needed for historical data.
/collections/:symbol/activities is then used to update the data.
However, it would be better if the api allow you to use a blocktime offset or even a txid offset, since if an nft collection is actively being traded, the offset can lose data in between.
Accomplishments that I'm proud of
I was able to rapidly prototype it in 2 days, from the first interaction with the activity api to the automated dashboard on Data Studio. This is also my first participation in a hackathon, nice challenge overall .
What you learned ?
By being able to go beyond the sale price, identifying the proportion of short term traders vs long term believers, draws a better picture on the state of the project and its holders than simply the floor price.
- You can have a high floor price but if most of the sellers are OGs, it’s usually a sign of distribution.
- In contrast, a low floor price consisting of mostly short term traders can signal accumulation.
What's next ?
- Moving some of the python logic to pure SQL for better performance.
- Creating a frontend UI
- Extrapolate this metrics for listing
- Find more insights on the buyers
- Creating a Chrome extension that displays the data on ME


")


Log in or sign up for Devpost to join the conversation.