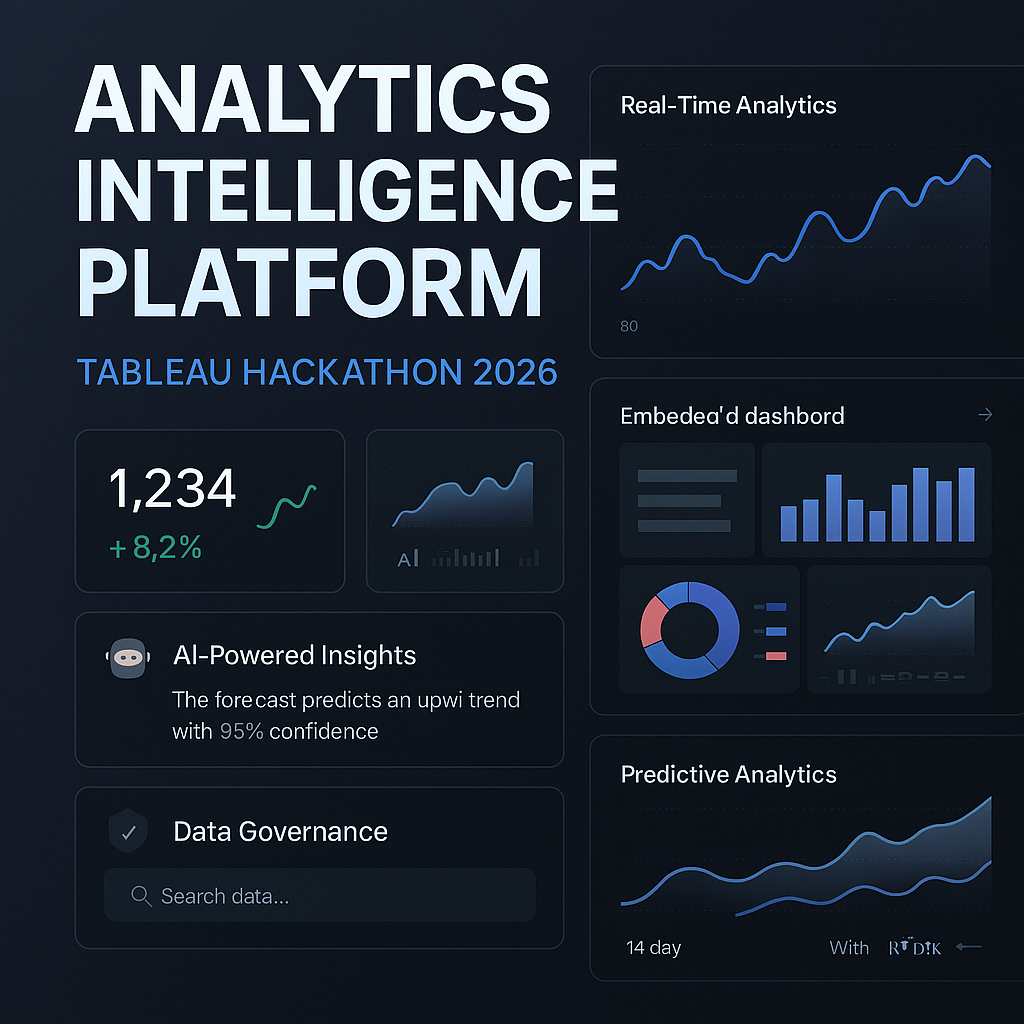
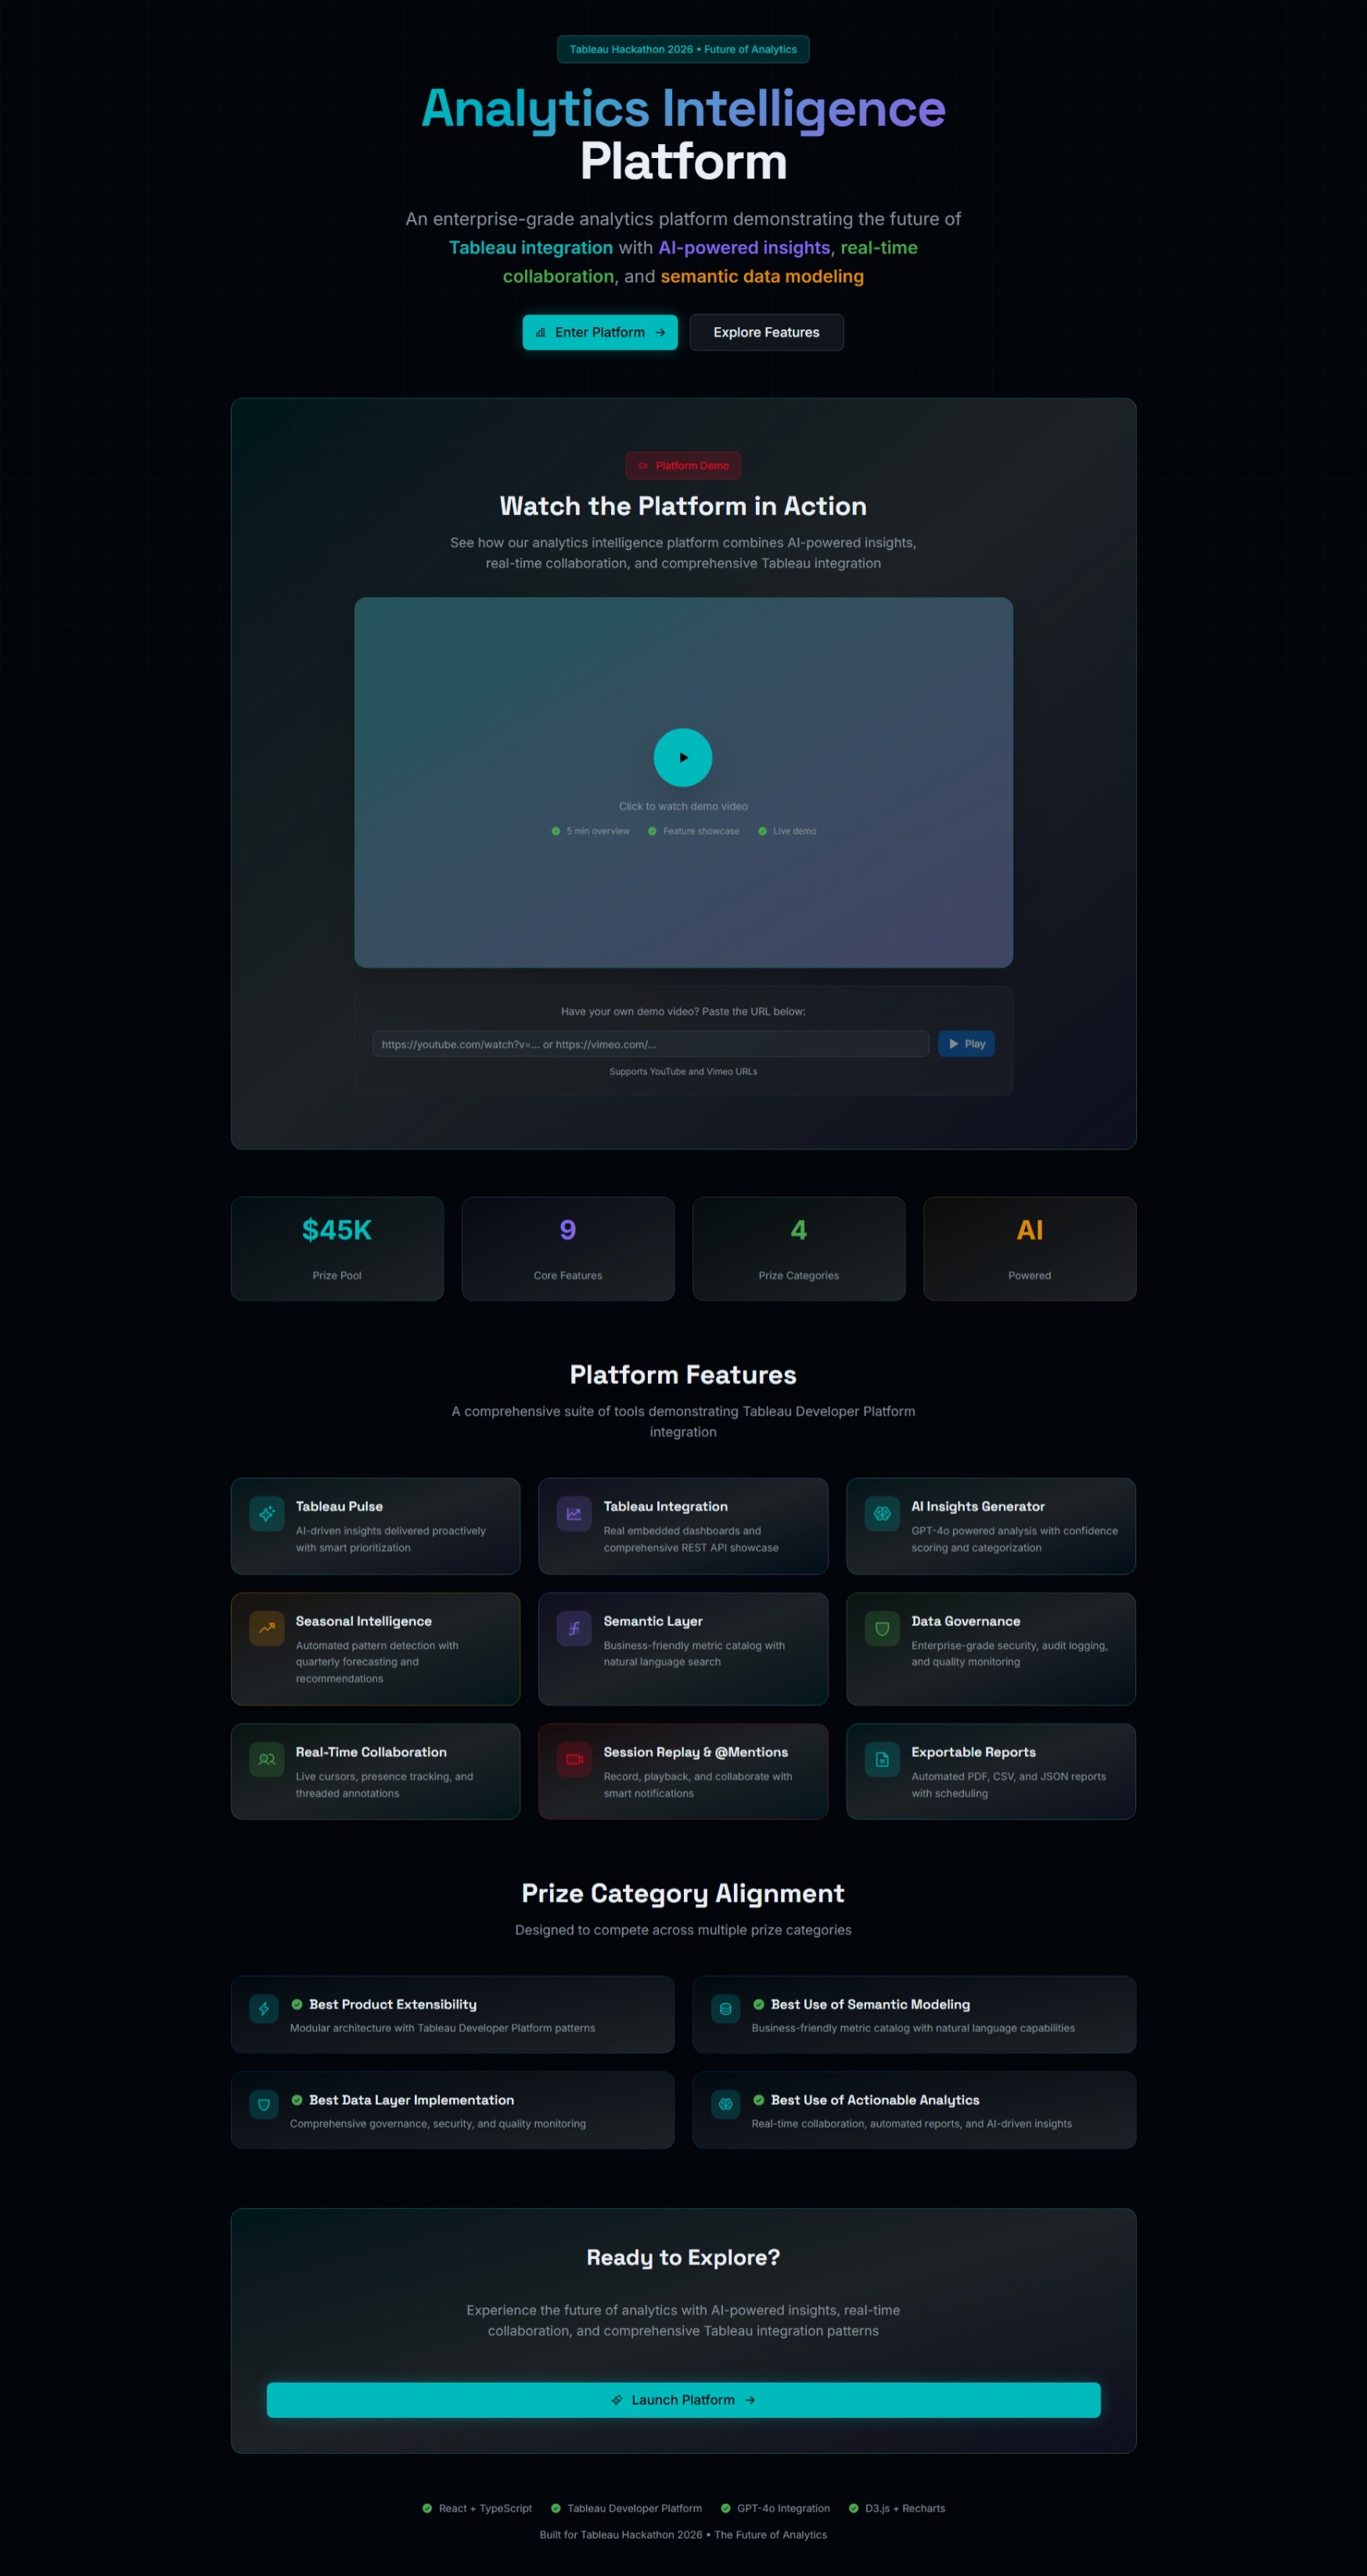
🚀 Analytics Intelligence Platform (AIP): The Dataflow Nexus
💡 Inspiration
We live in a world where data is abundant, but actionable intelligence is scarce. Traditional dashboards tell you what happened, but they often struggle to explain why it happened or what will happen next.
For the Tableau Hackathon 2026, we were inspired to bridge the gap between static reporting and dynamic decision-making. We wanted to build a "Nexus"—a central hub where Tableau’s visualization power meets Generative AI, Real-Time Collaboration, and Semantic Understanding. Our goal was to democratize data analytics, making it as easy as chatting with a colleague, while maintaining the robust governance required by enterprise standards.
📊 What it does
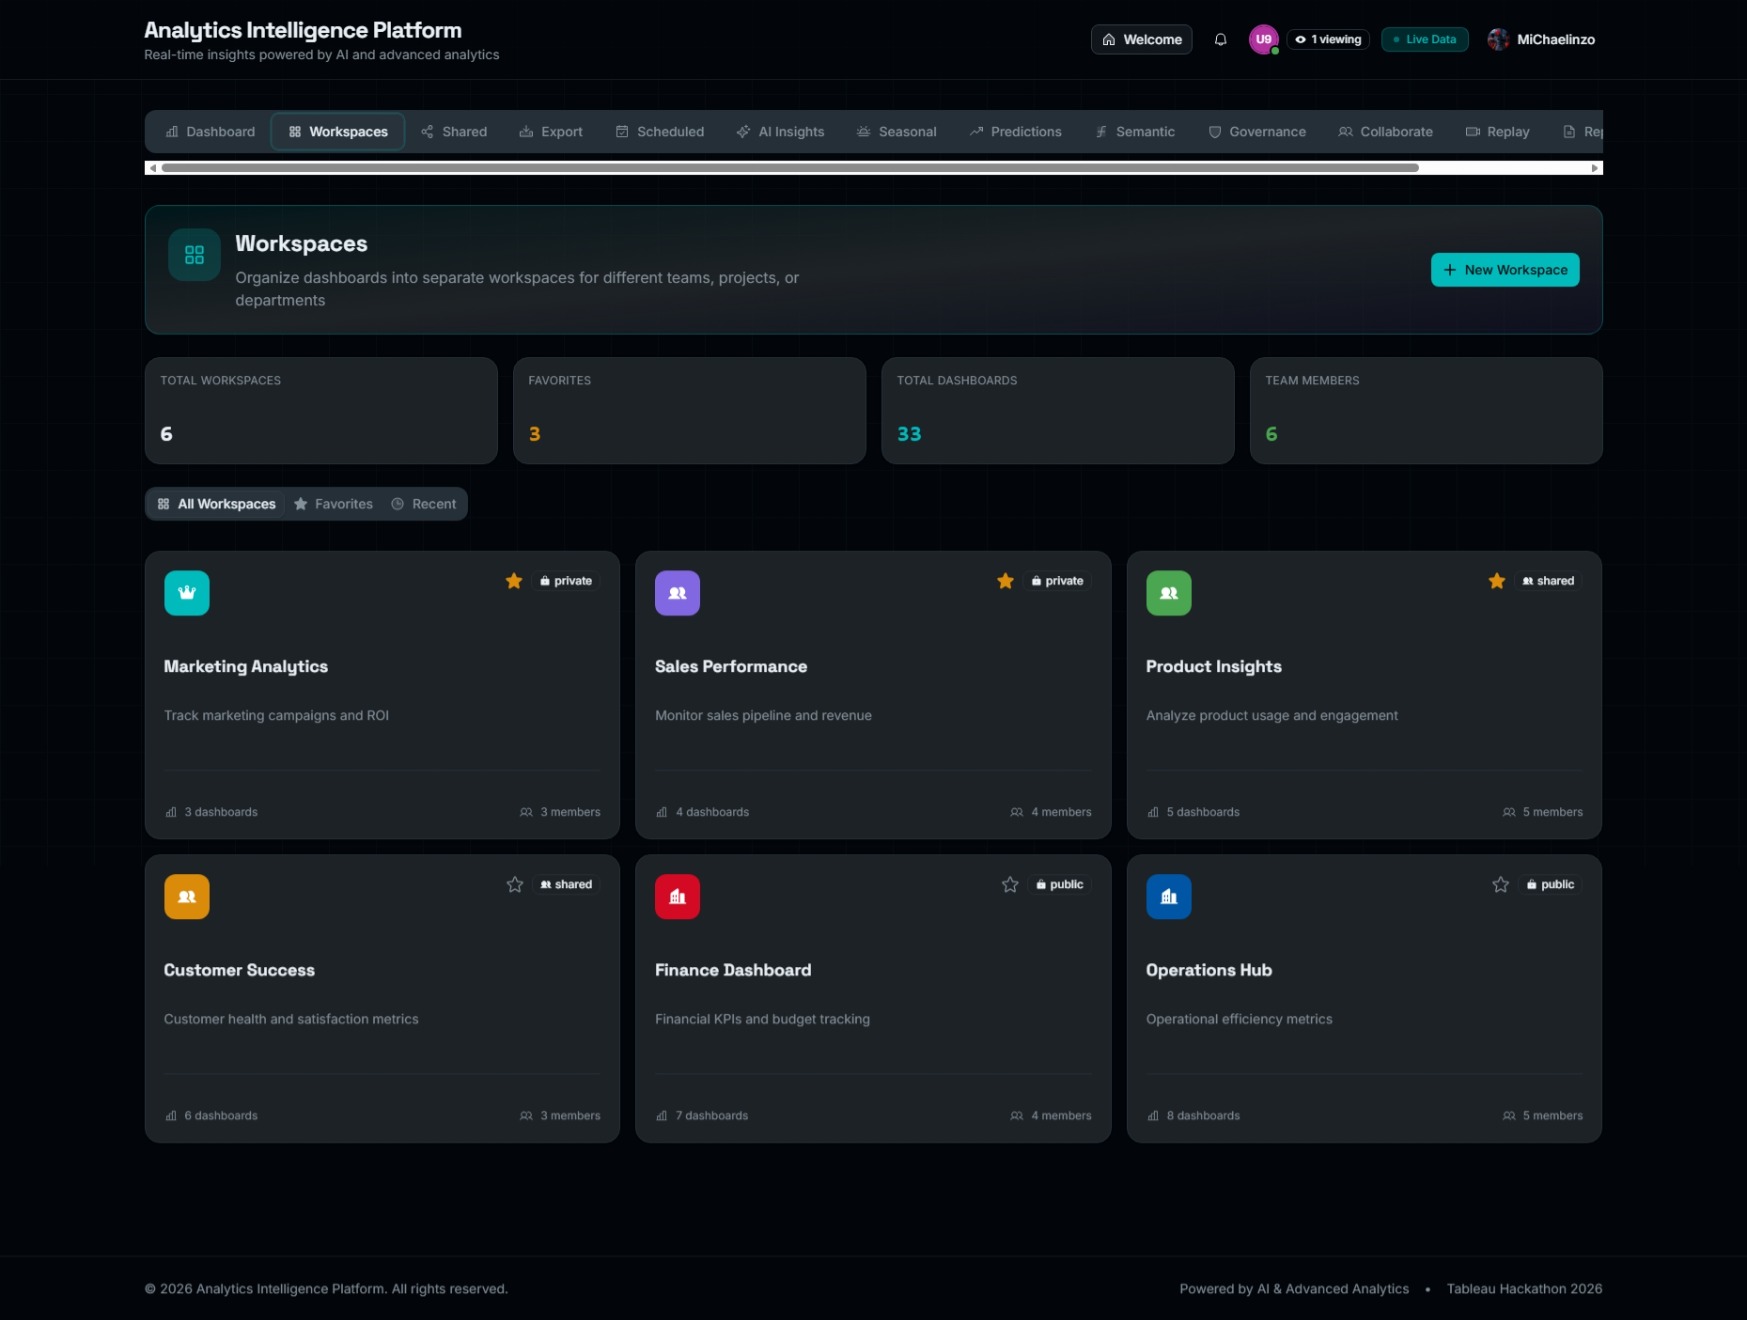
Analytics Intelligence Platform (AIP) is a next-generation data workspace that combines seven powerful pillars into one cohesive experience:
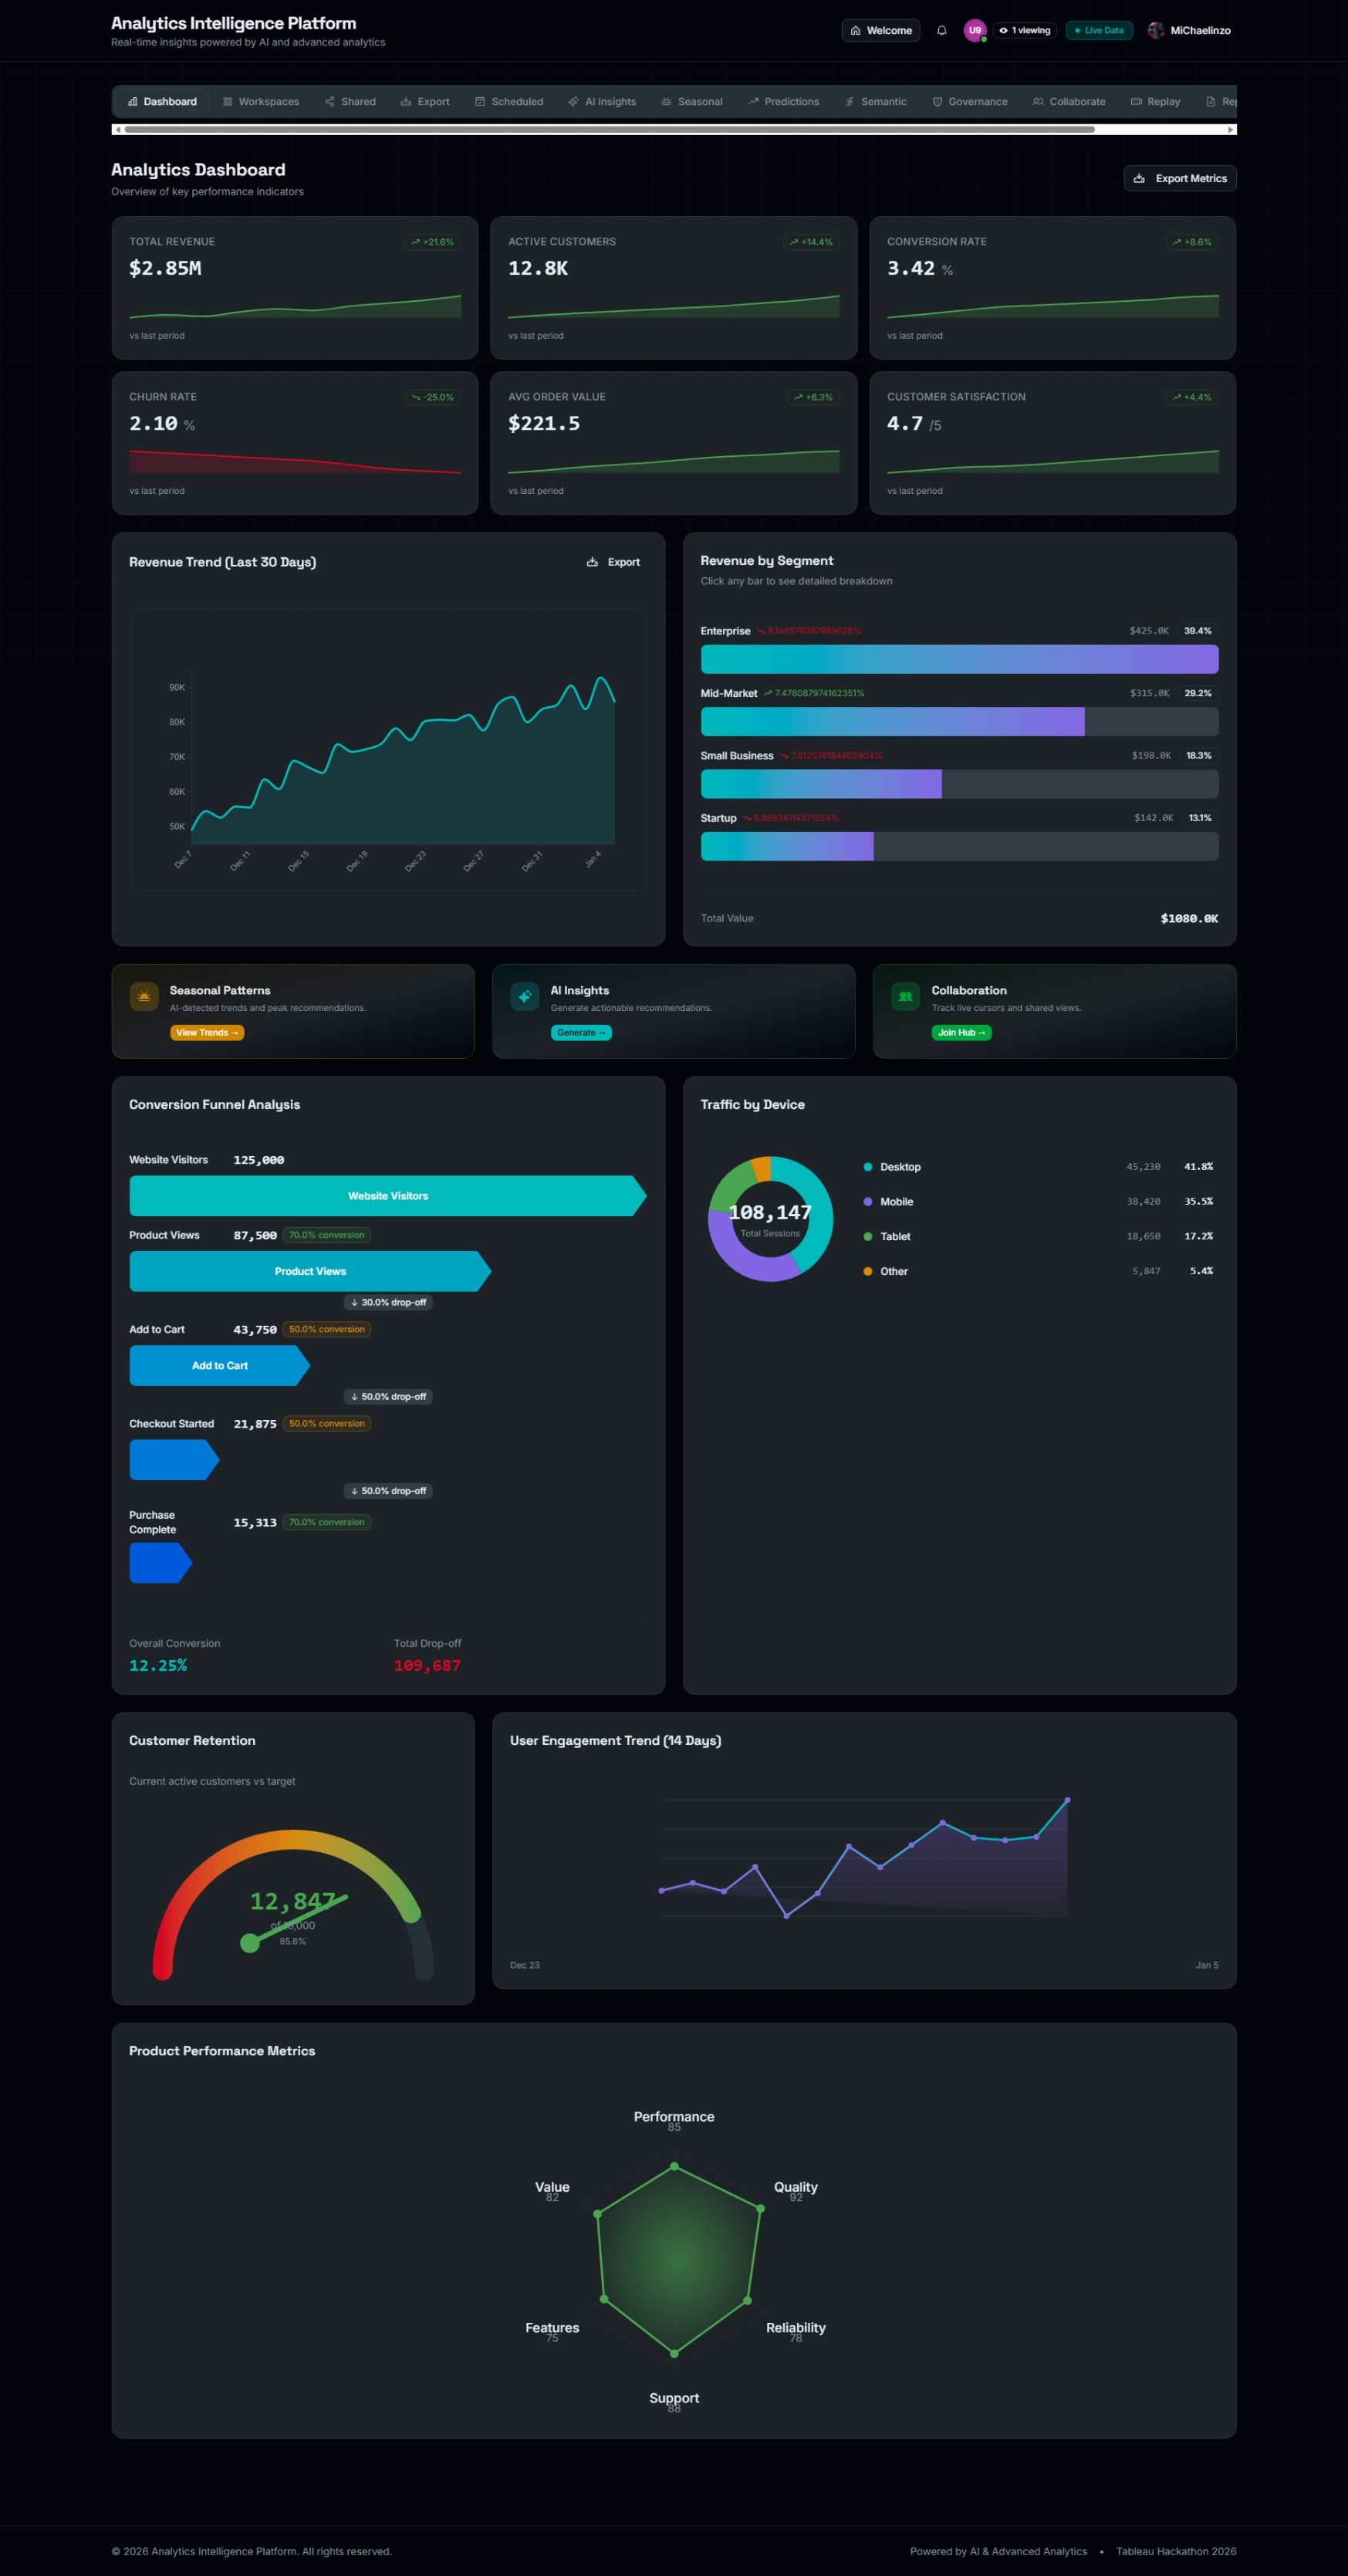
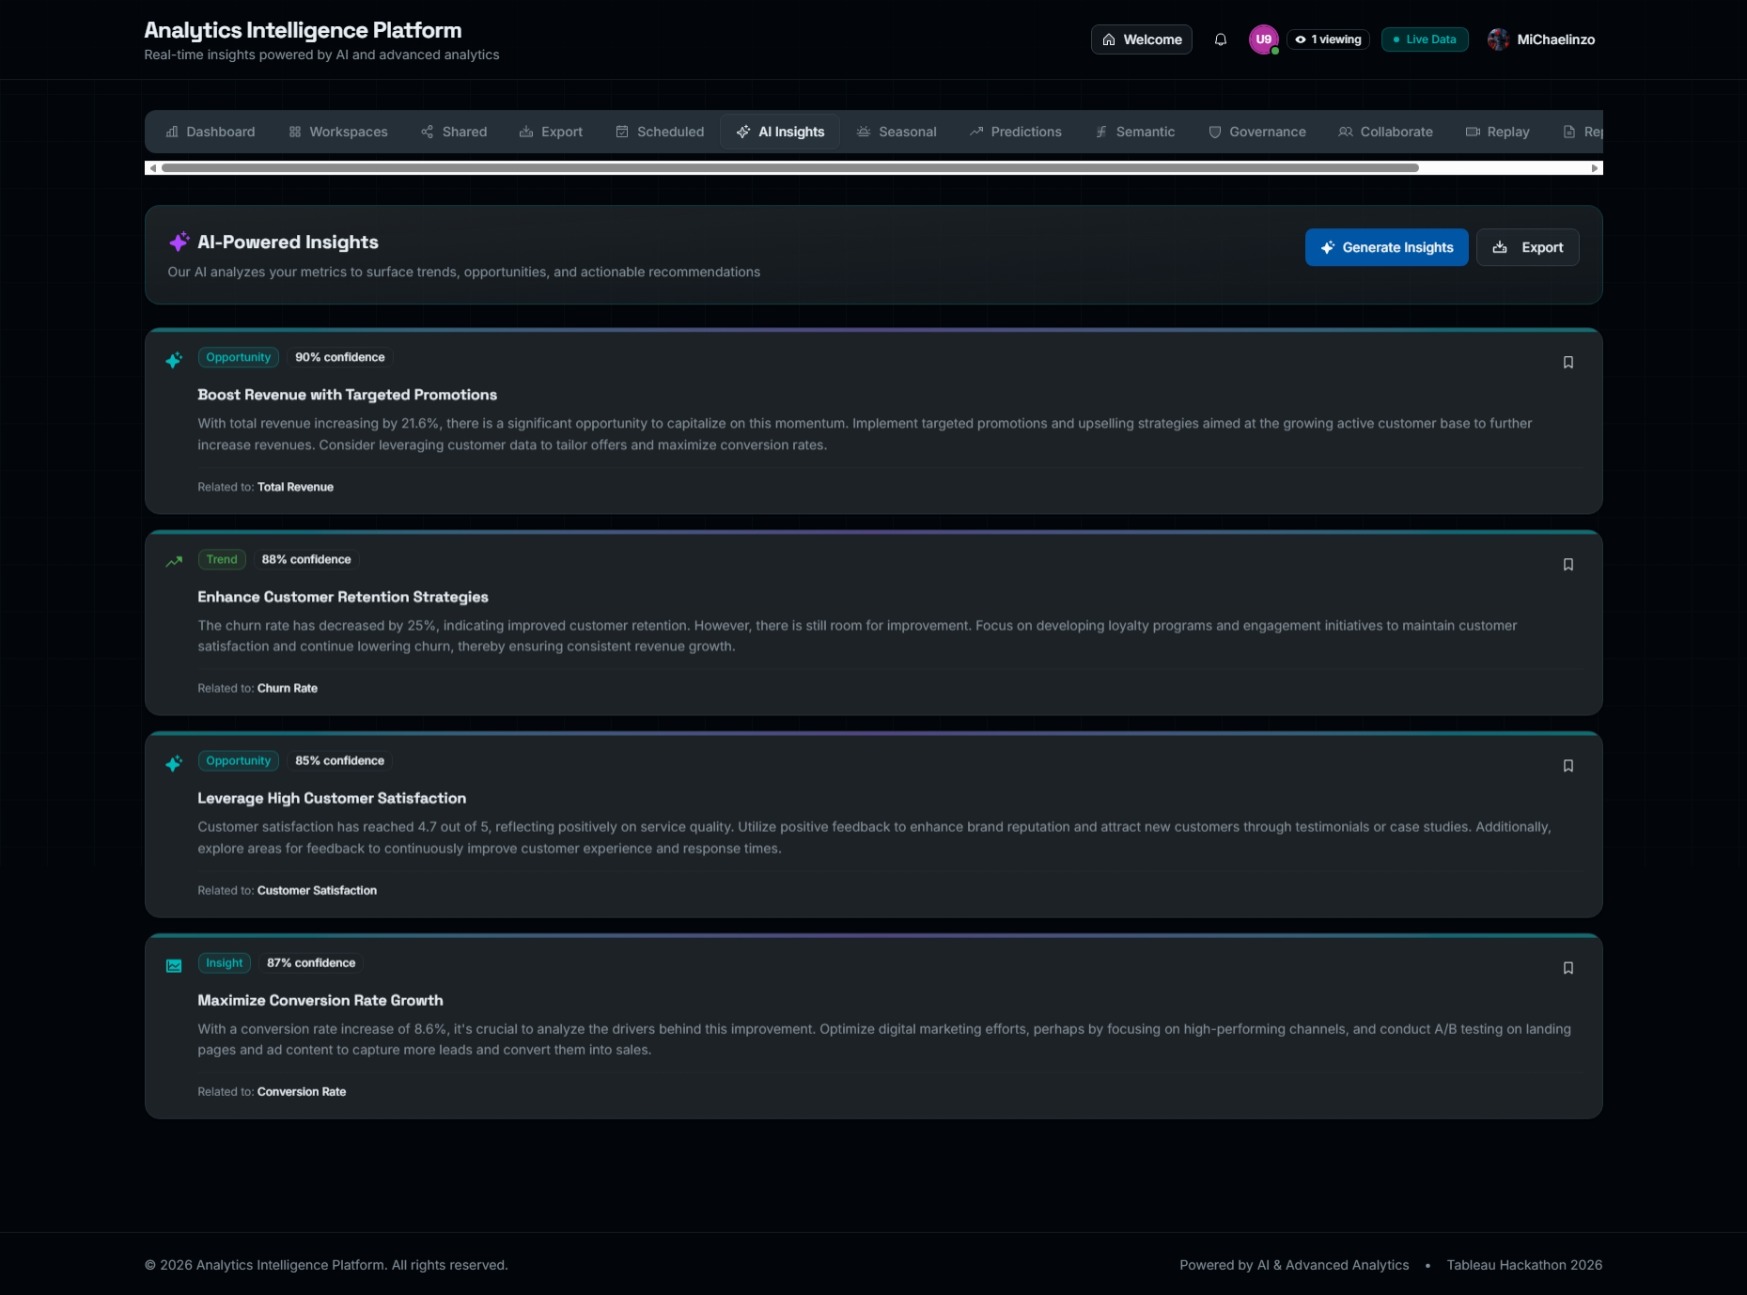
- 🤖 AI-Powered Insights & Tableau Pulse: Leverages GPT-4o to automatically analyze complex datasets, surfacing opportunities, anomalies, and warnings with confidence scores. It integrates directly with Tableau Pulse patterns to deliver proactive intelligence.
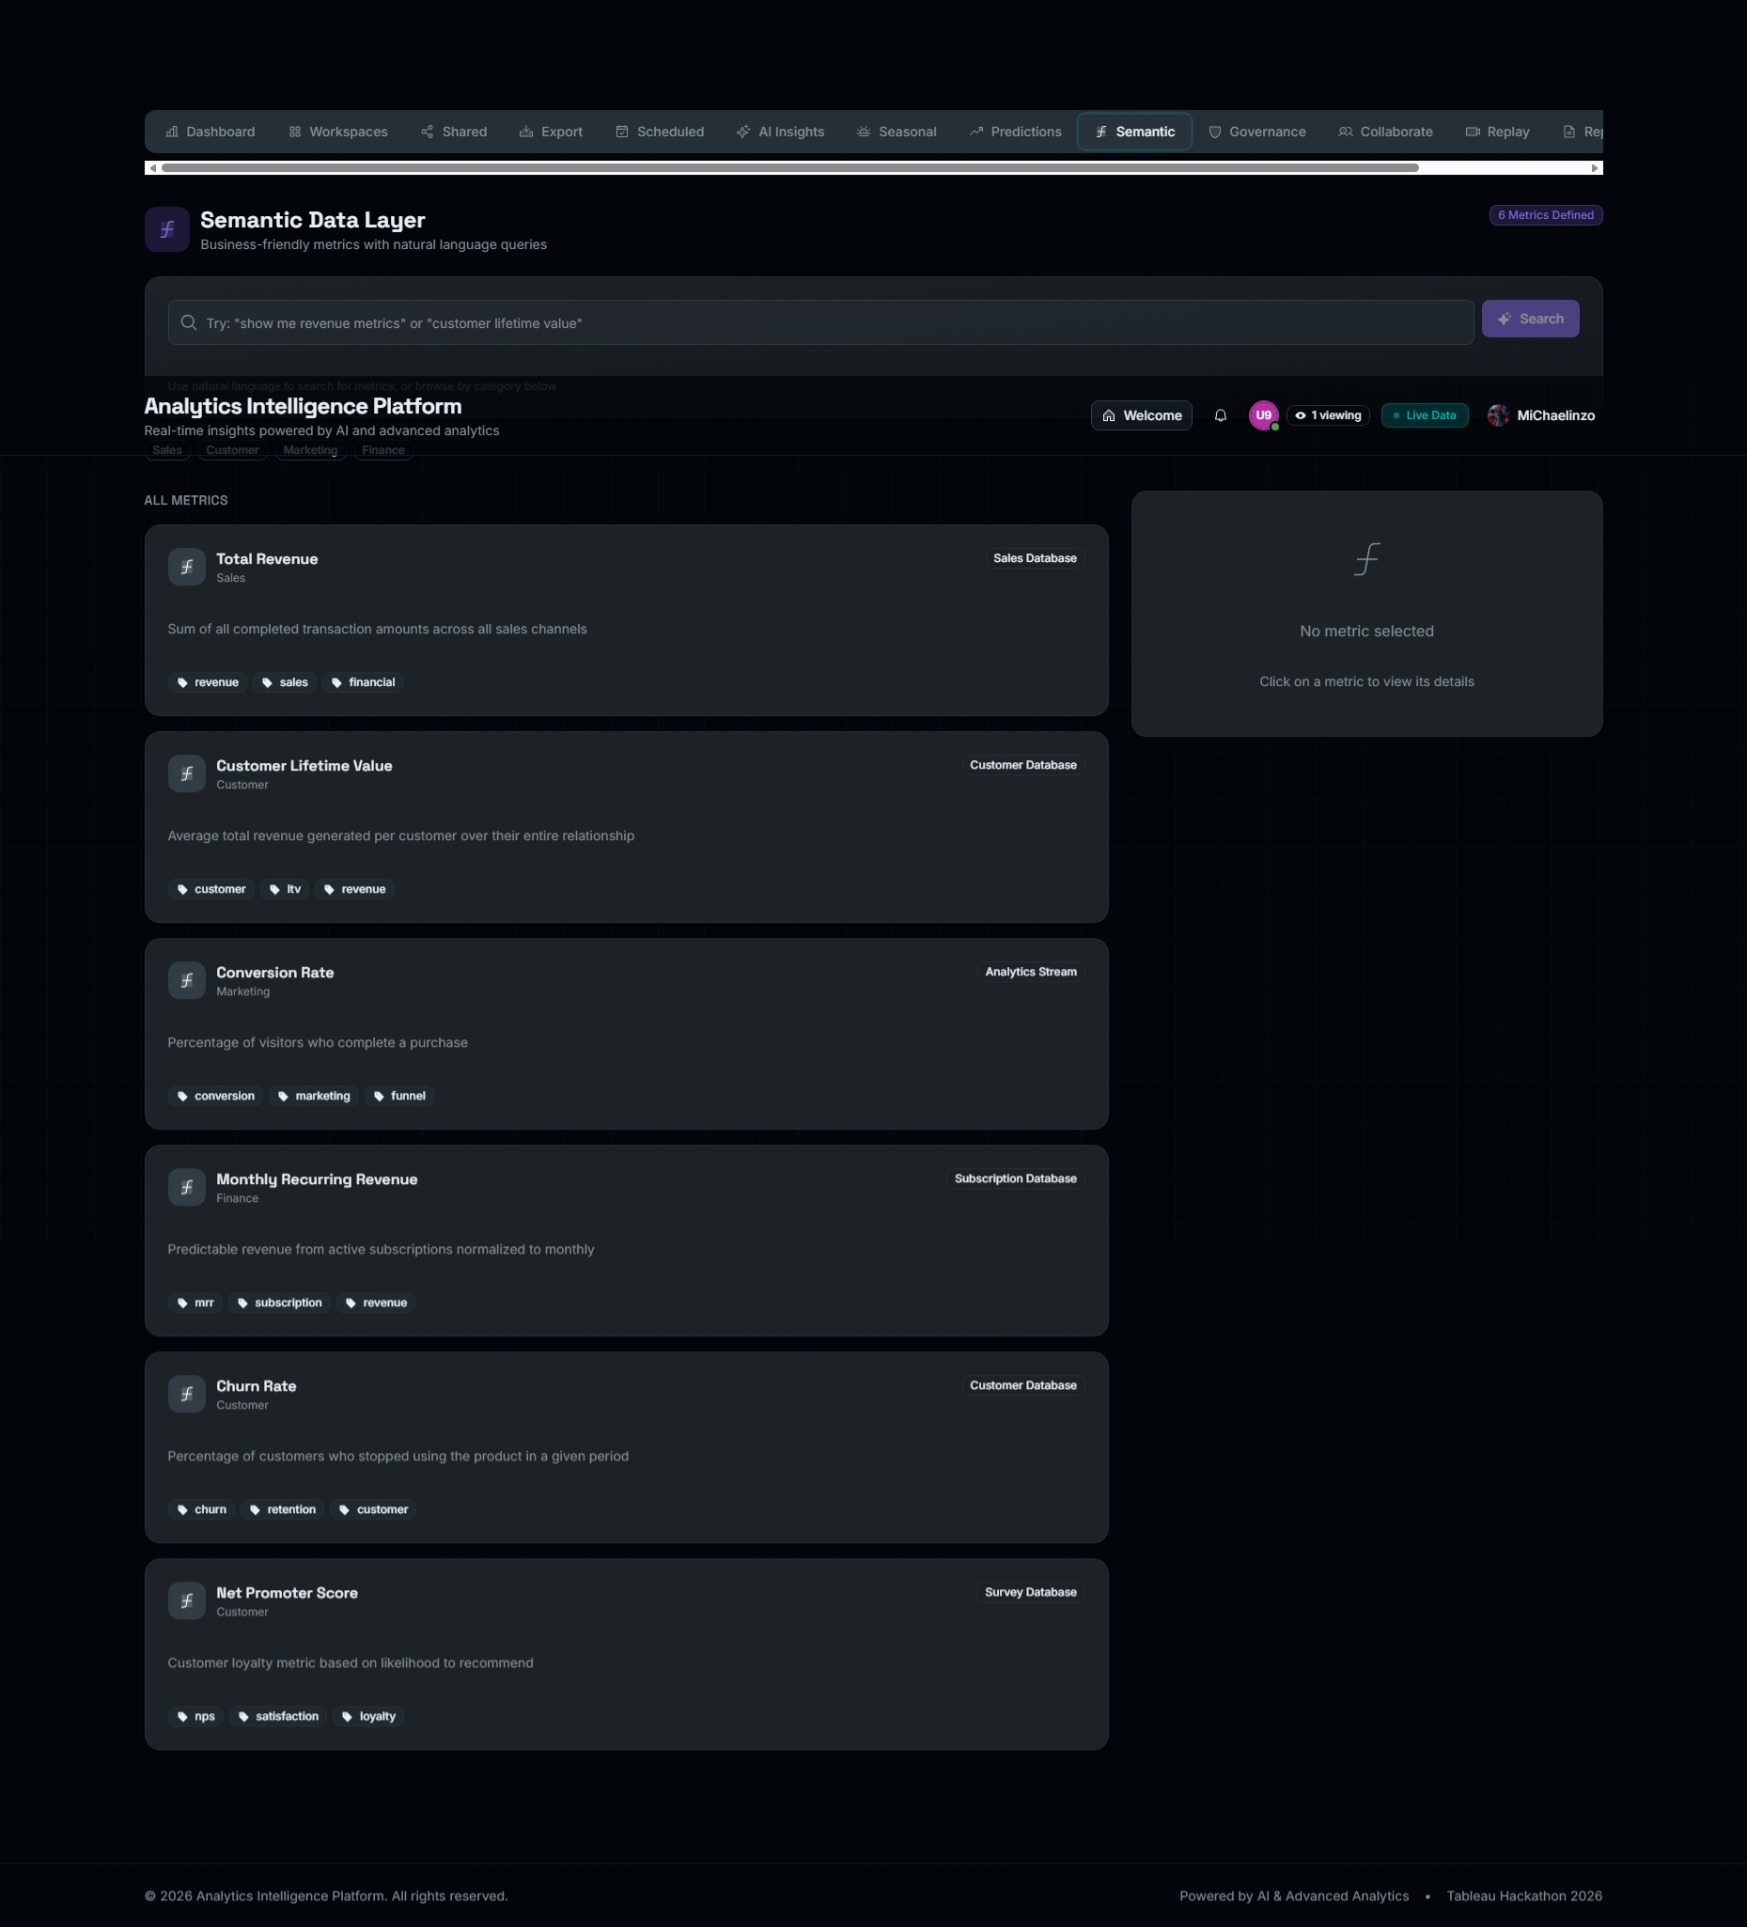
- 🗣️ Semantic Data Layer: No SQL required! Users can query data using natural language (e.g., "Show me revenue growth vs. last year"). The system understands business context, metrics, and lineage.
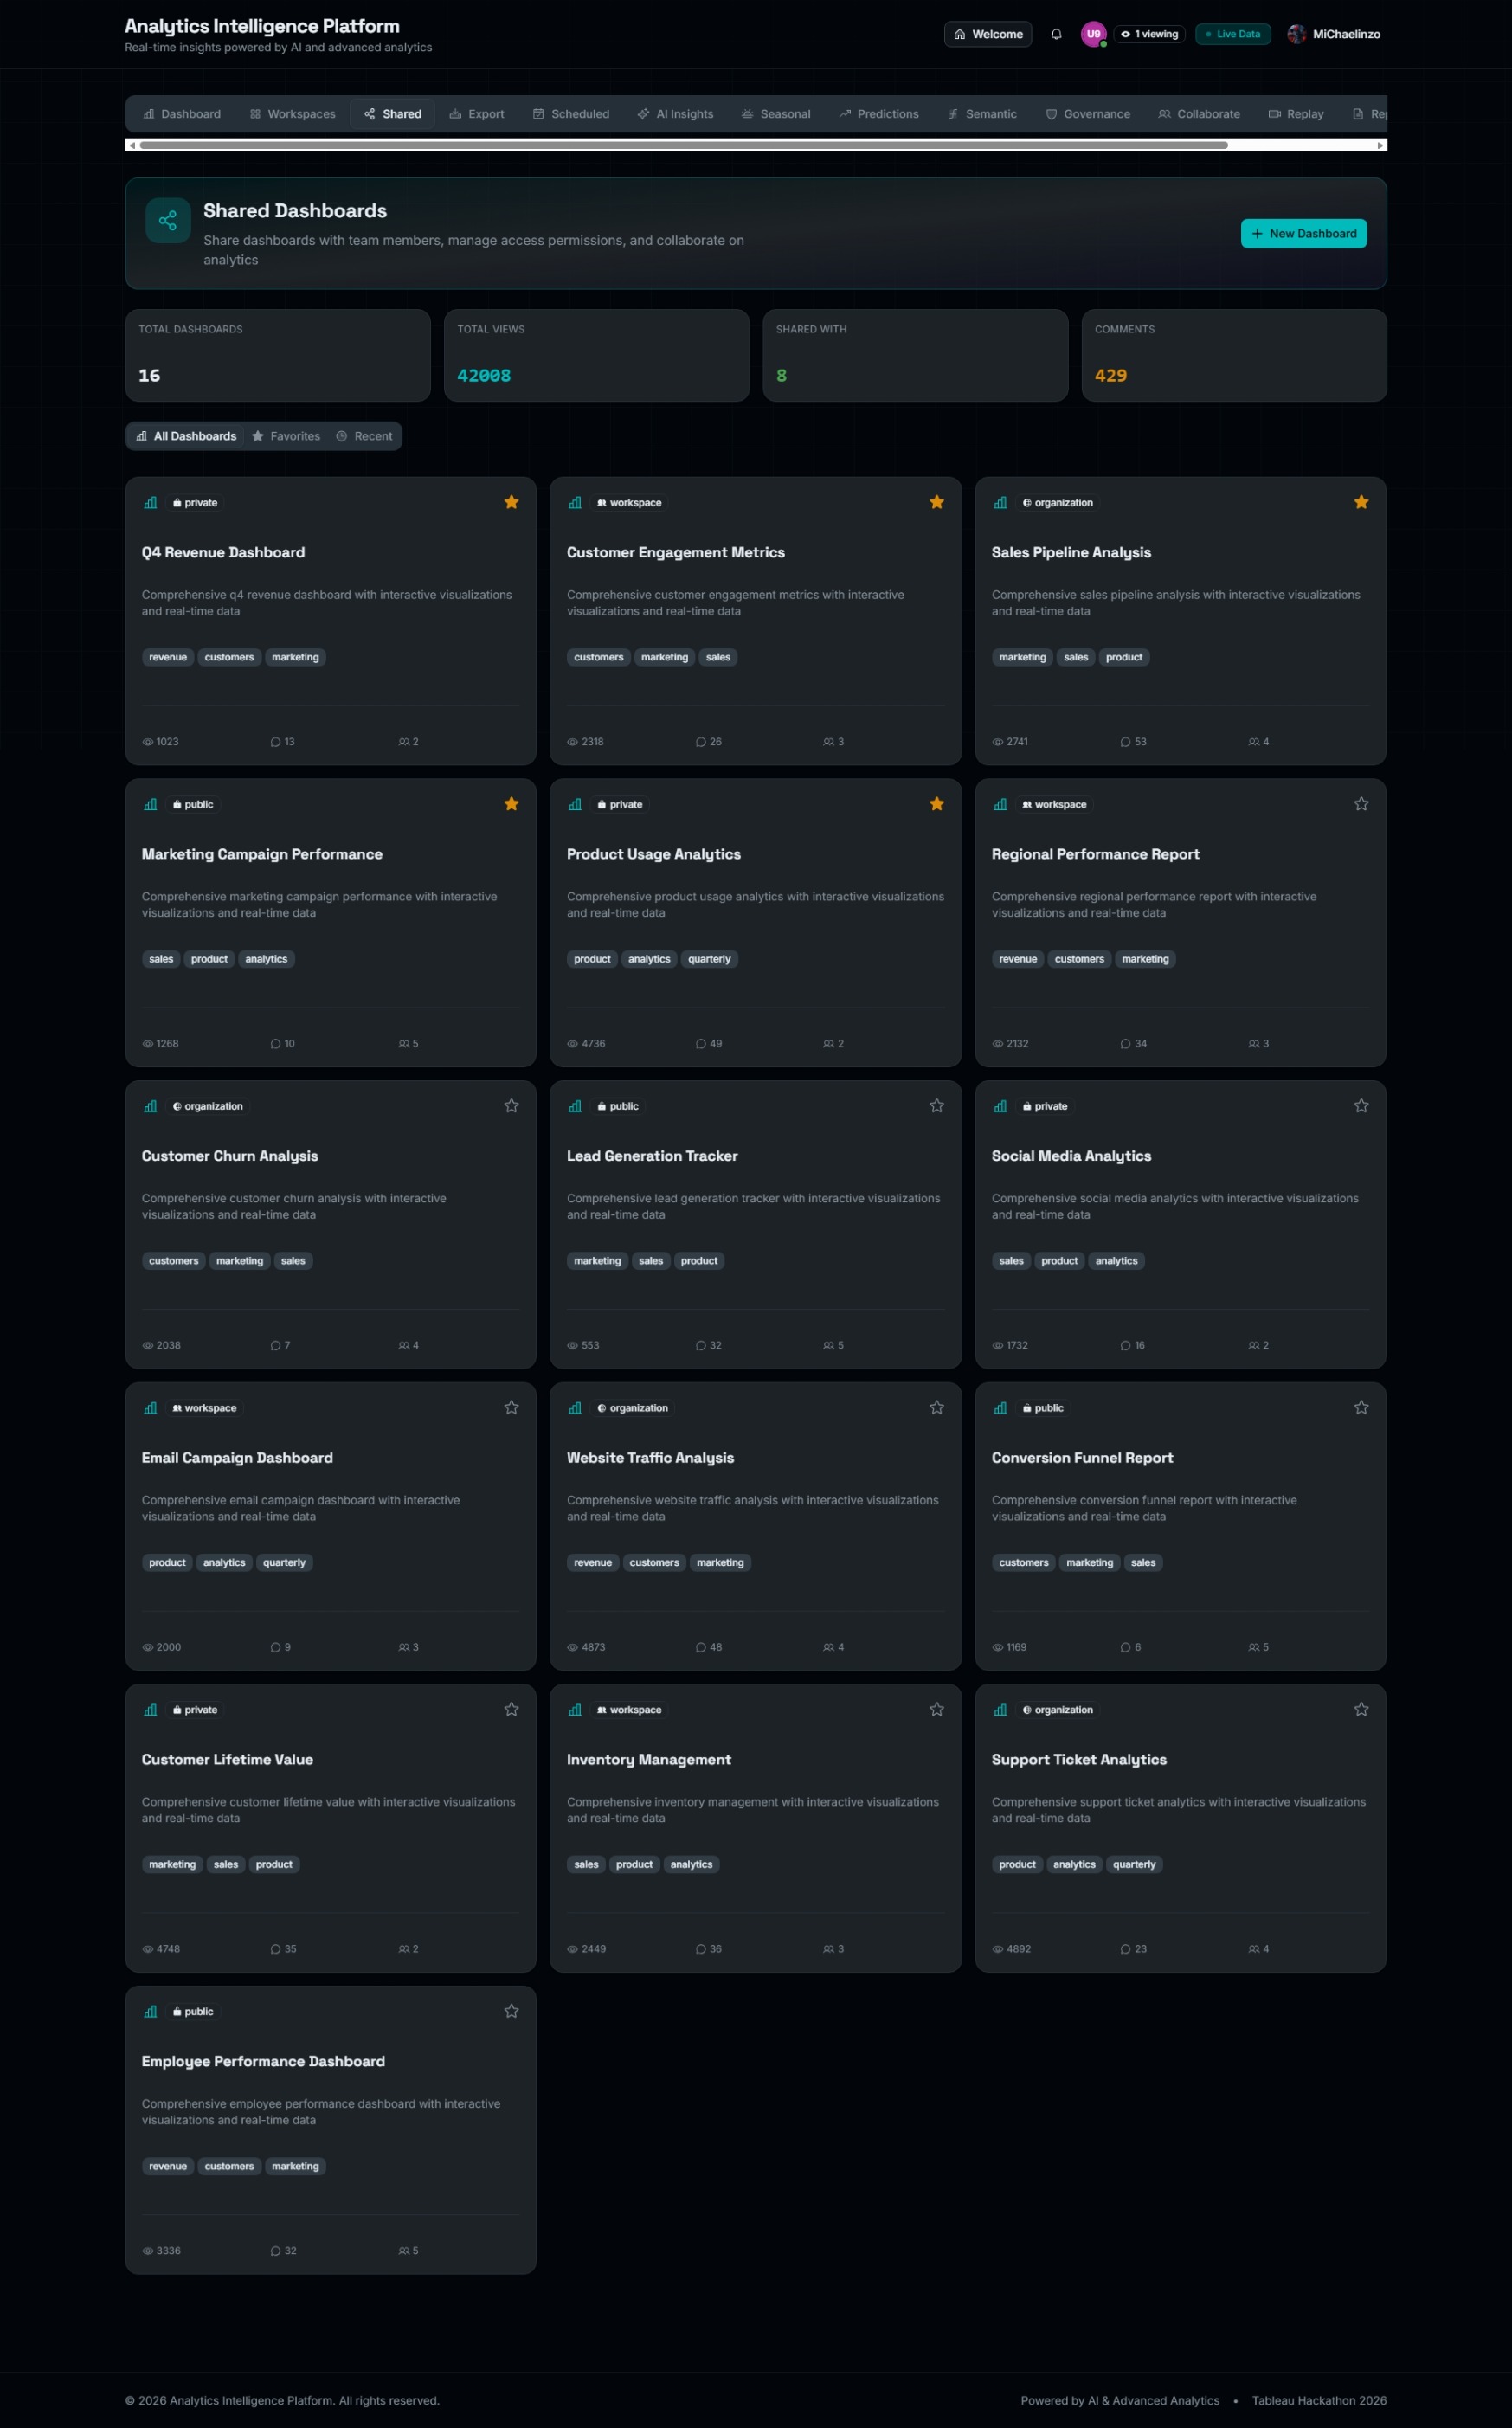
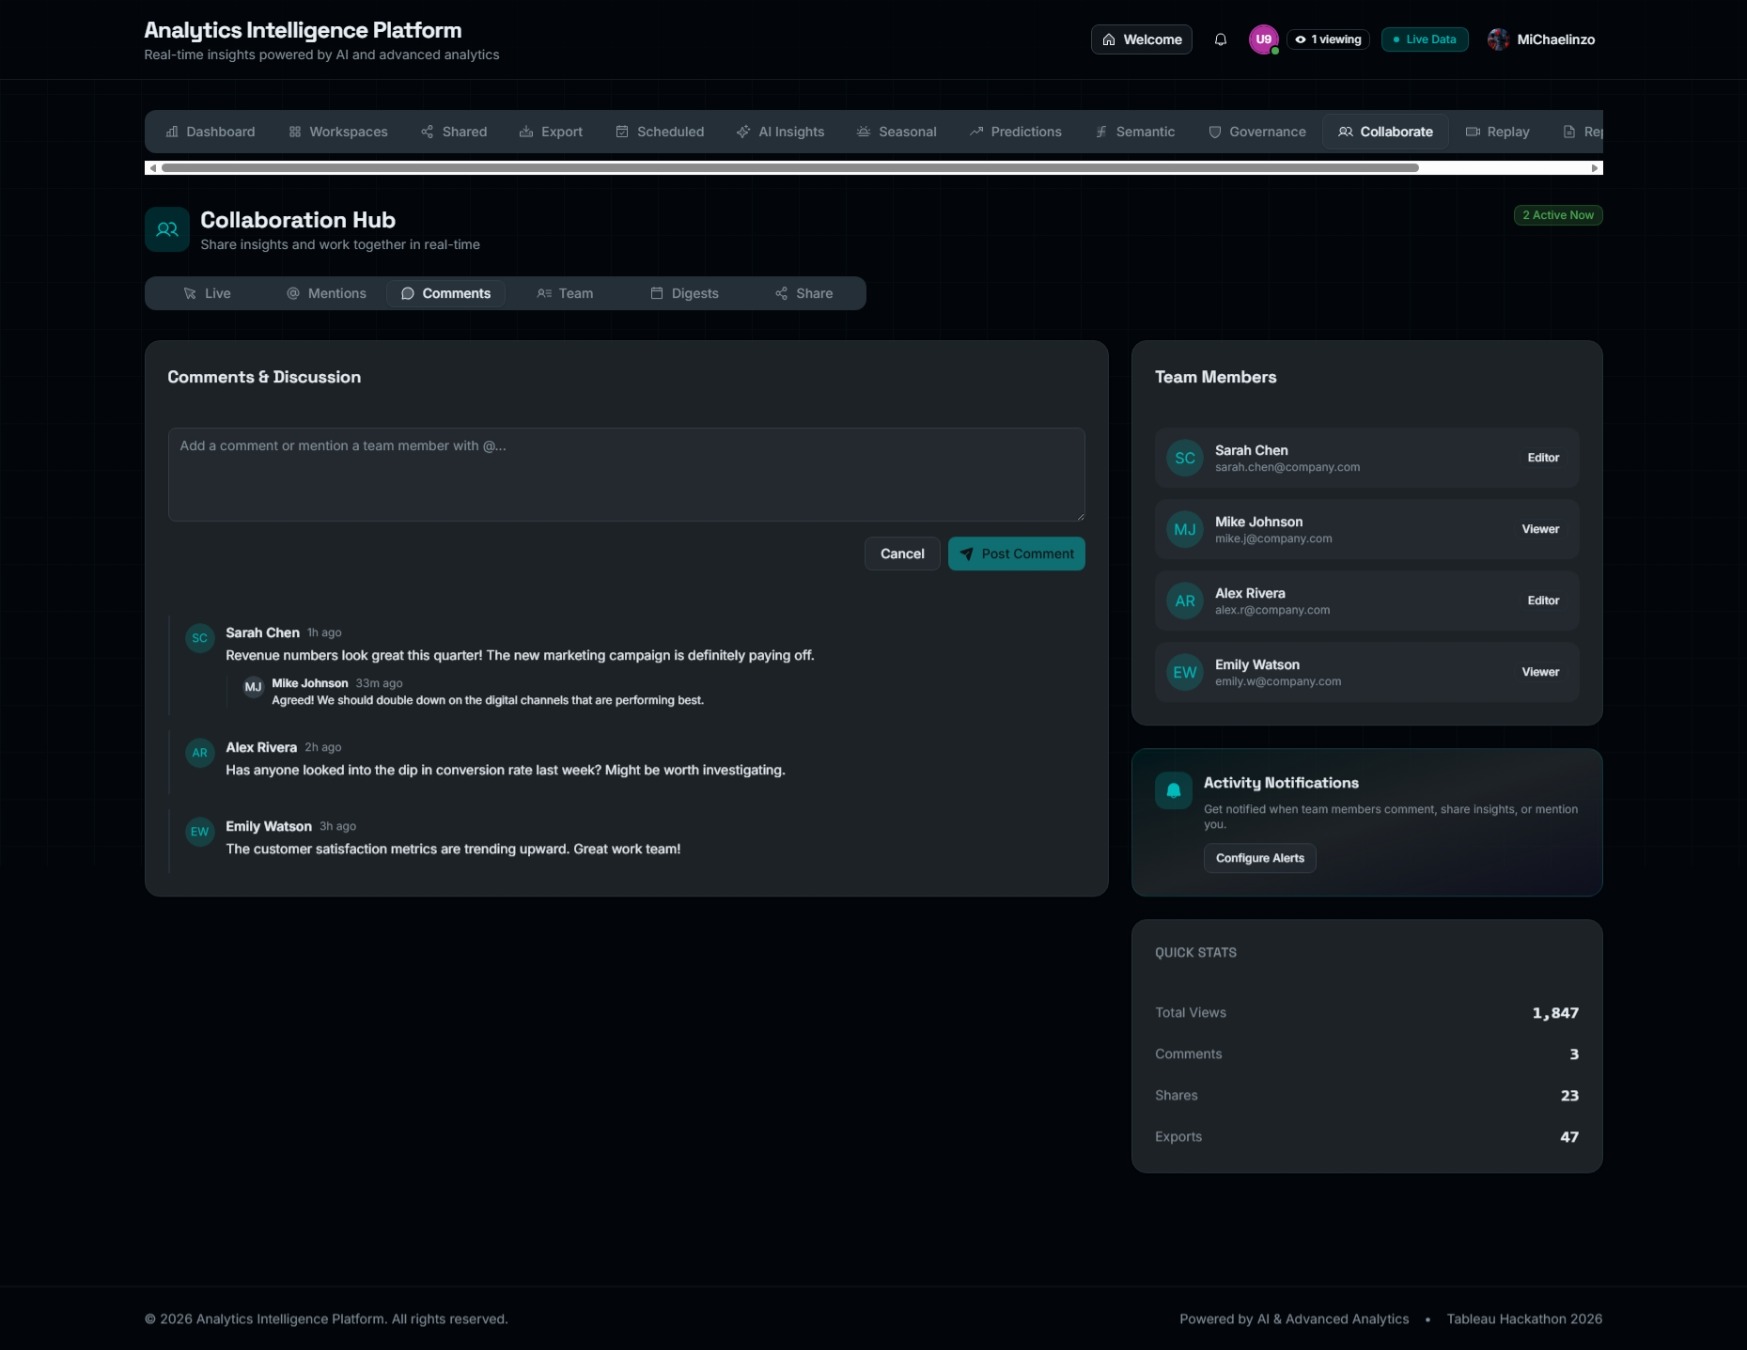
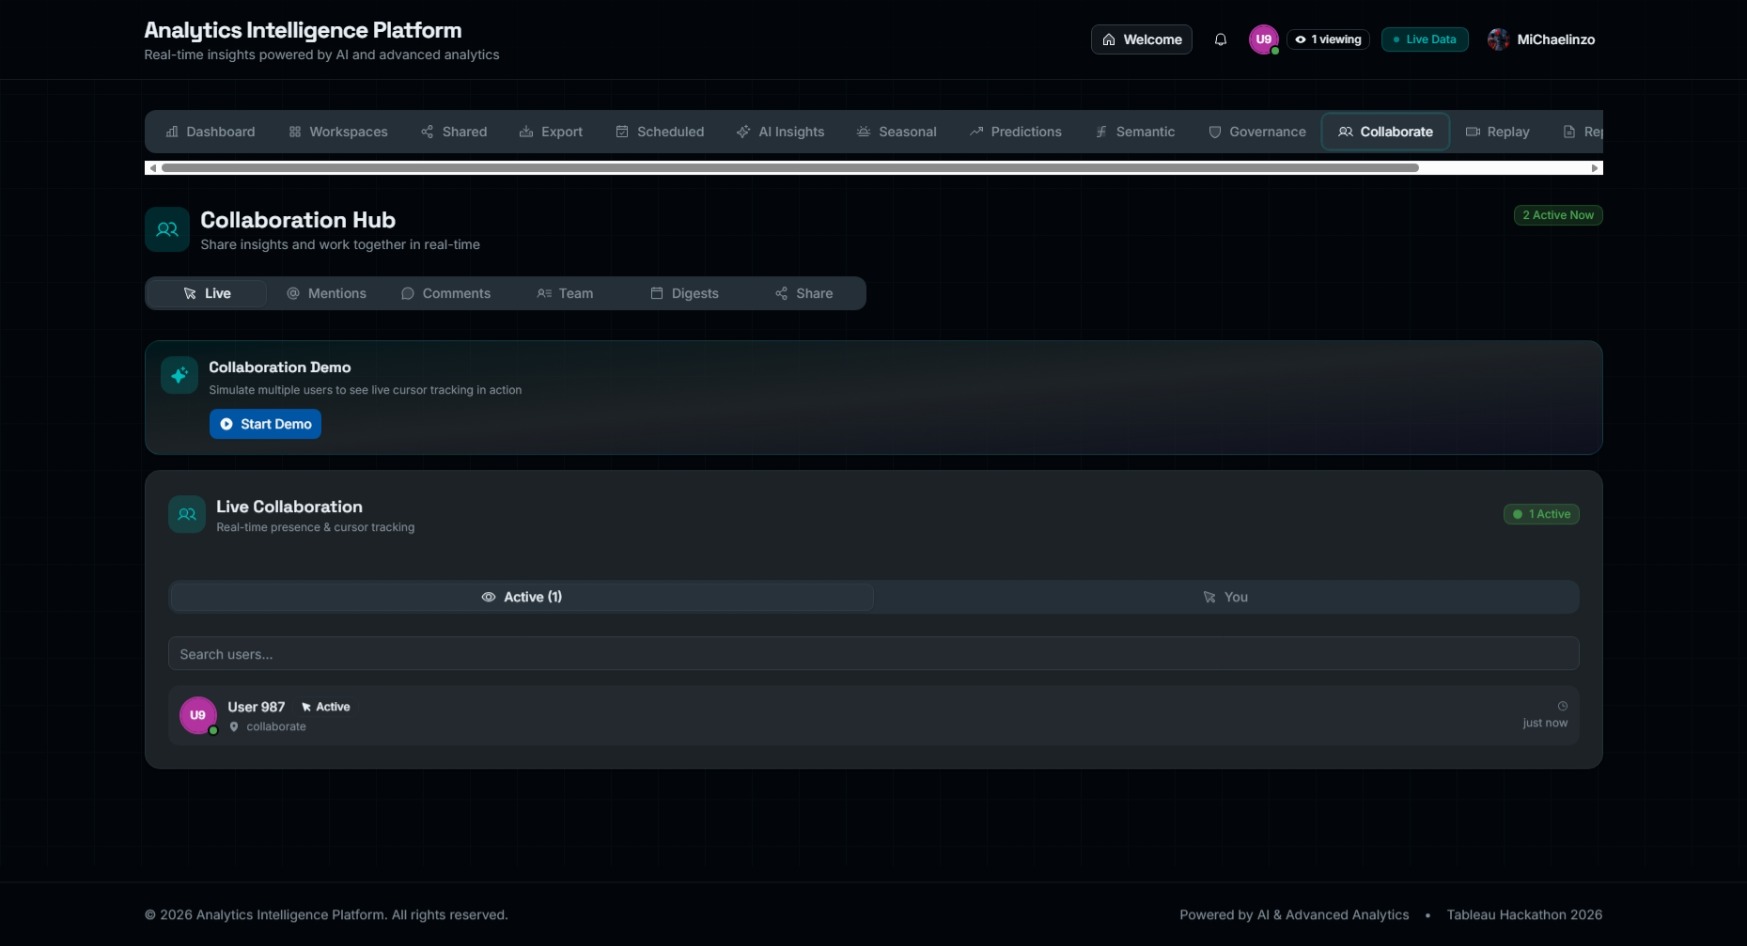
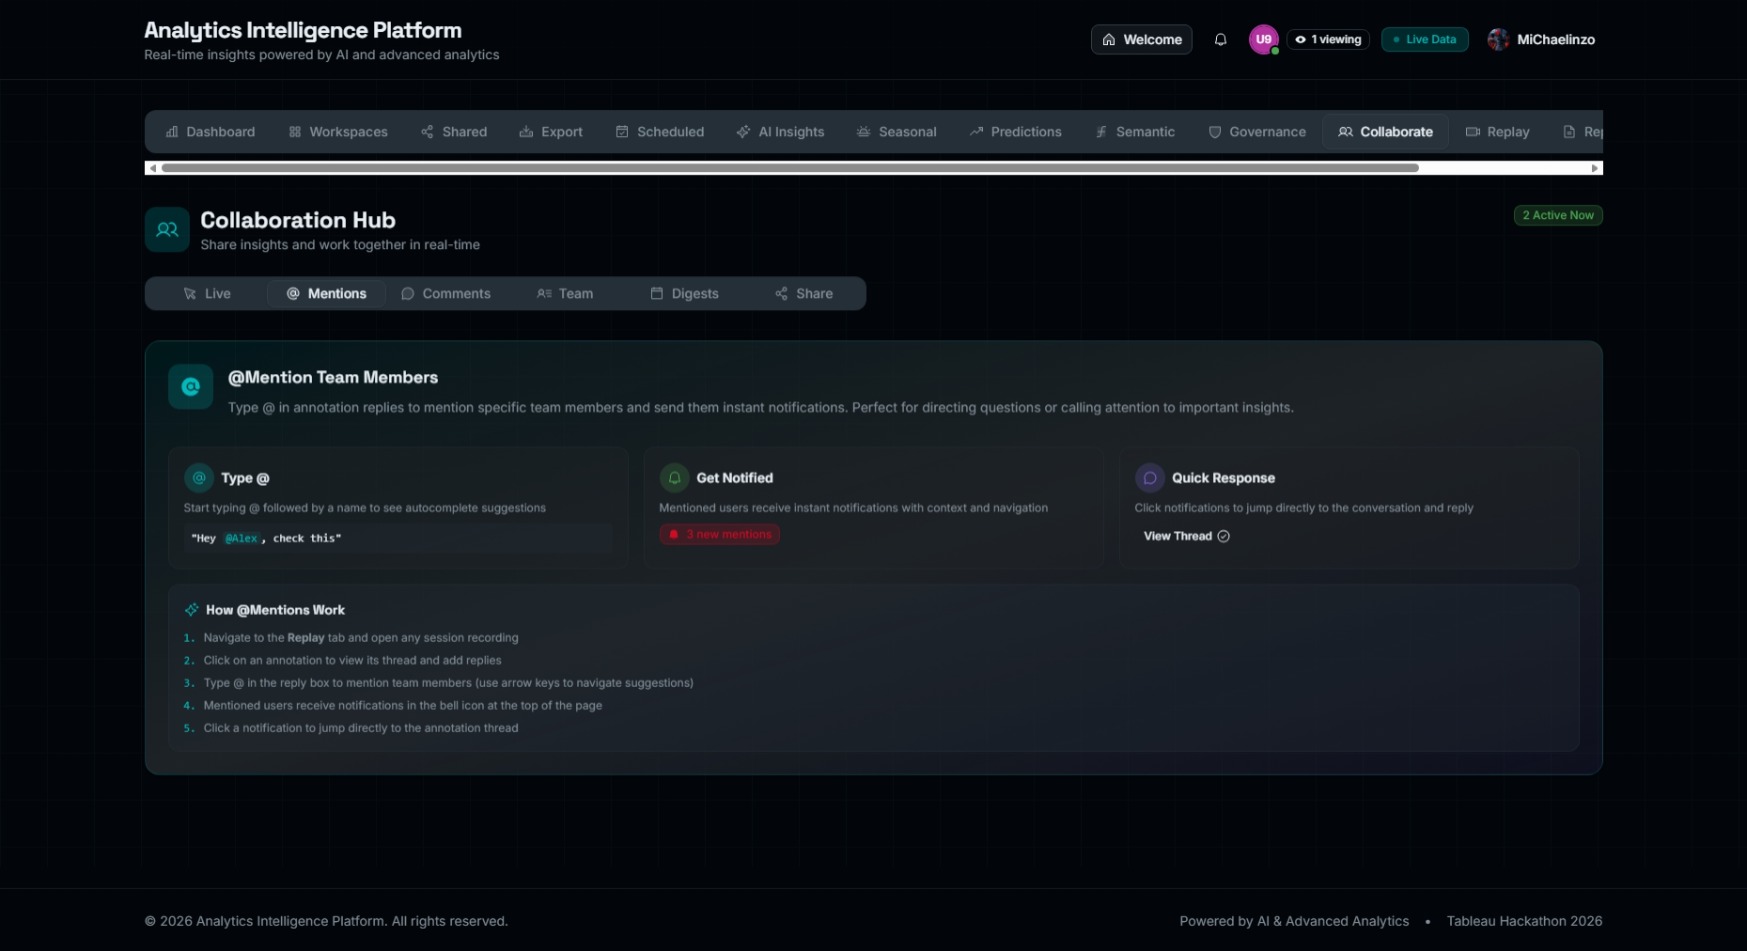
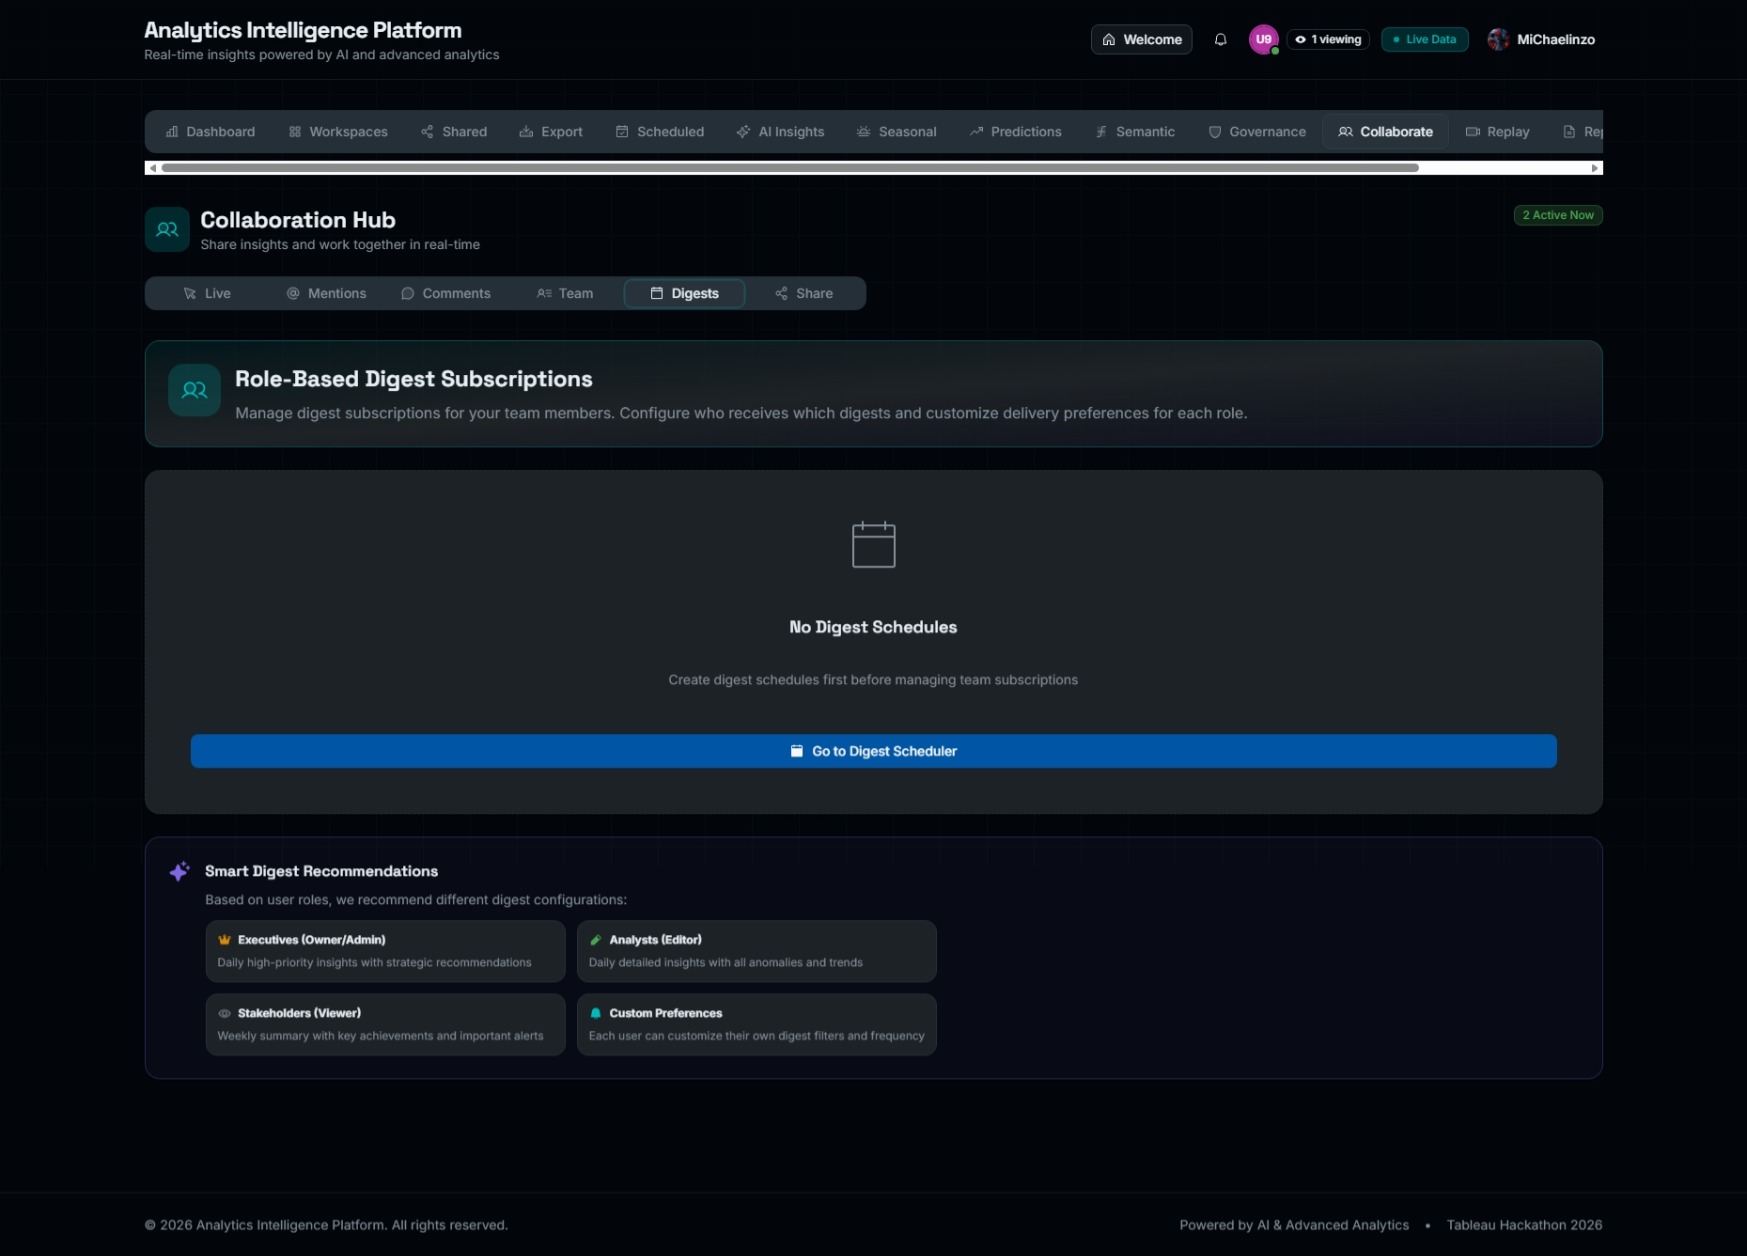
- 🤝 Real-Time "Multiplayer" Collaboration: Experience data together. We implemented live cursors, presence indicators, and real-time commenting, turning solitary analysis into a team sport.
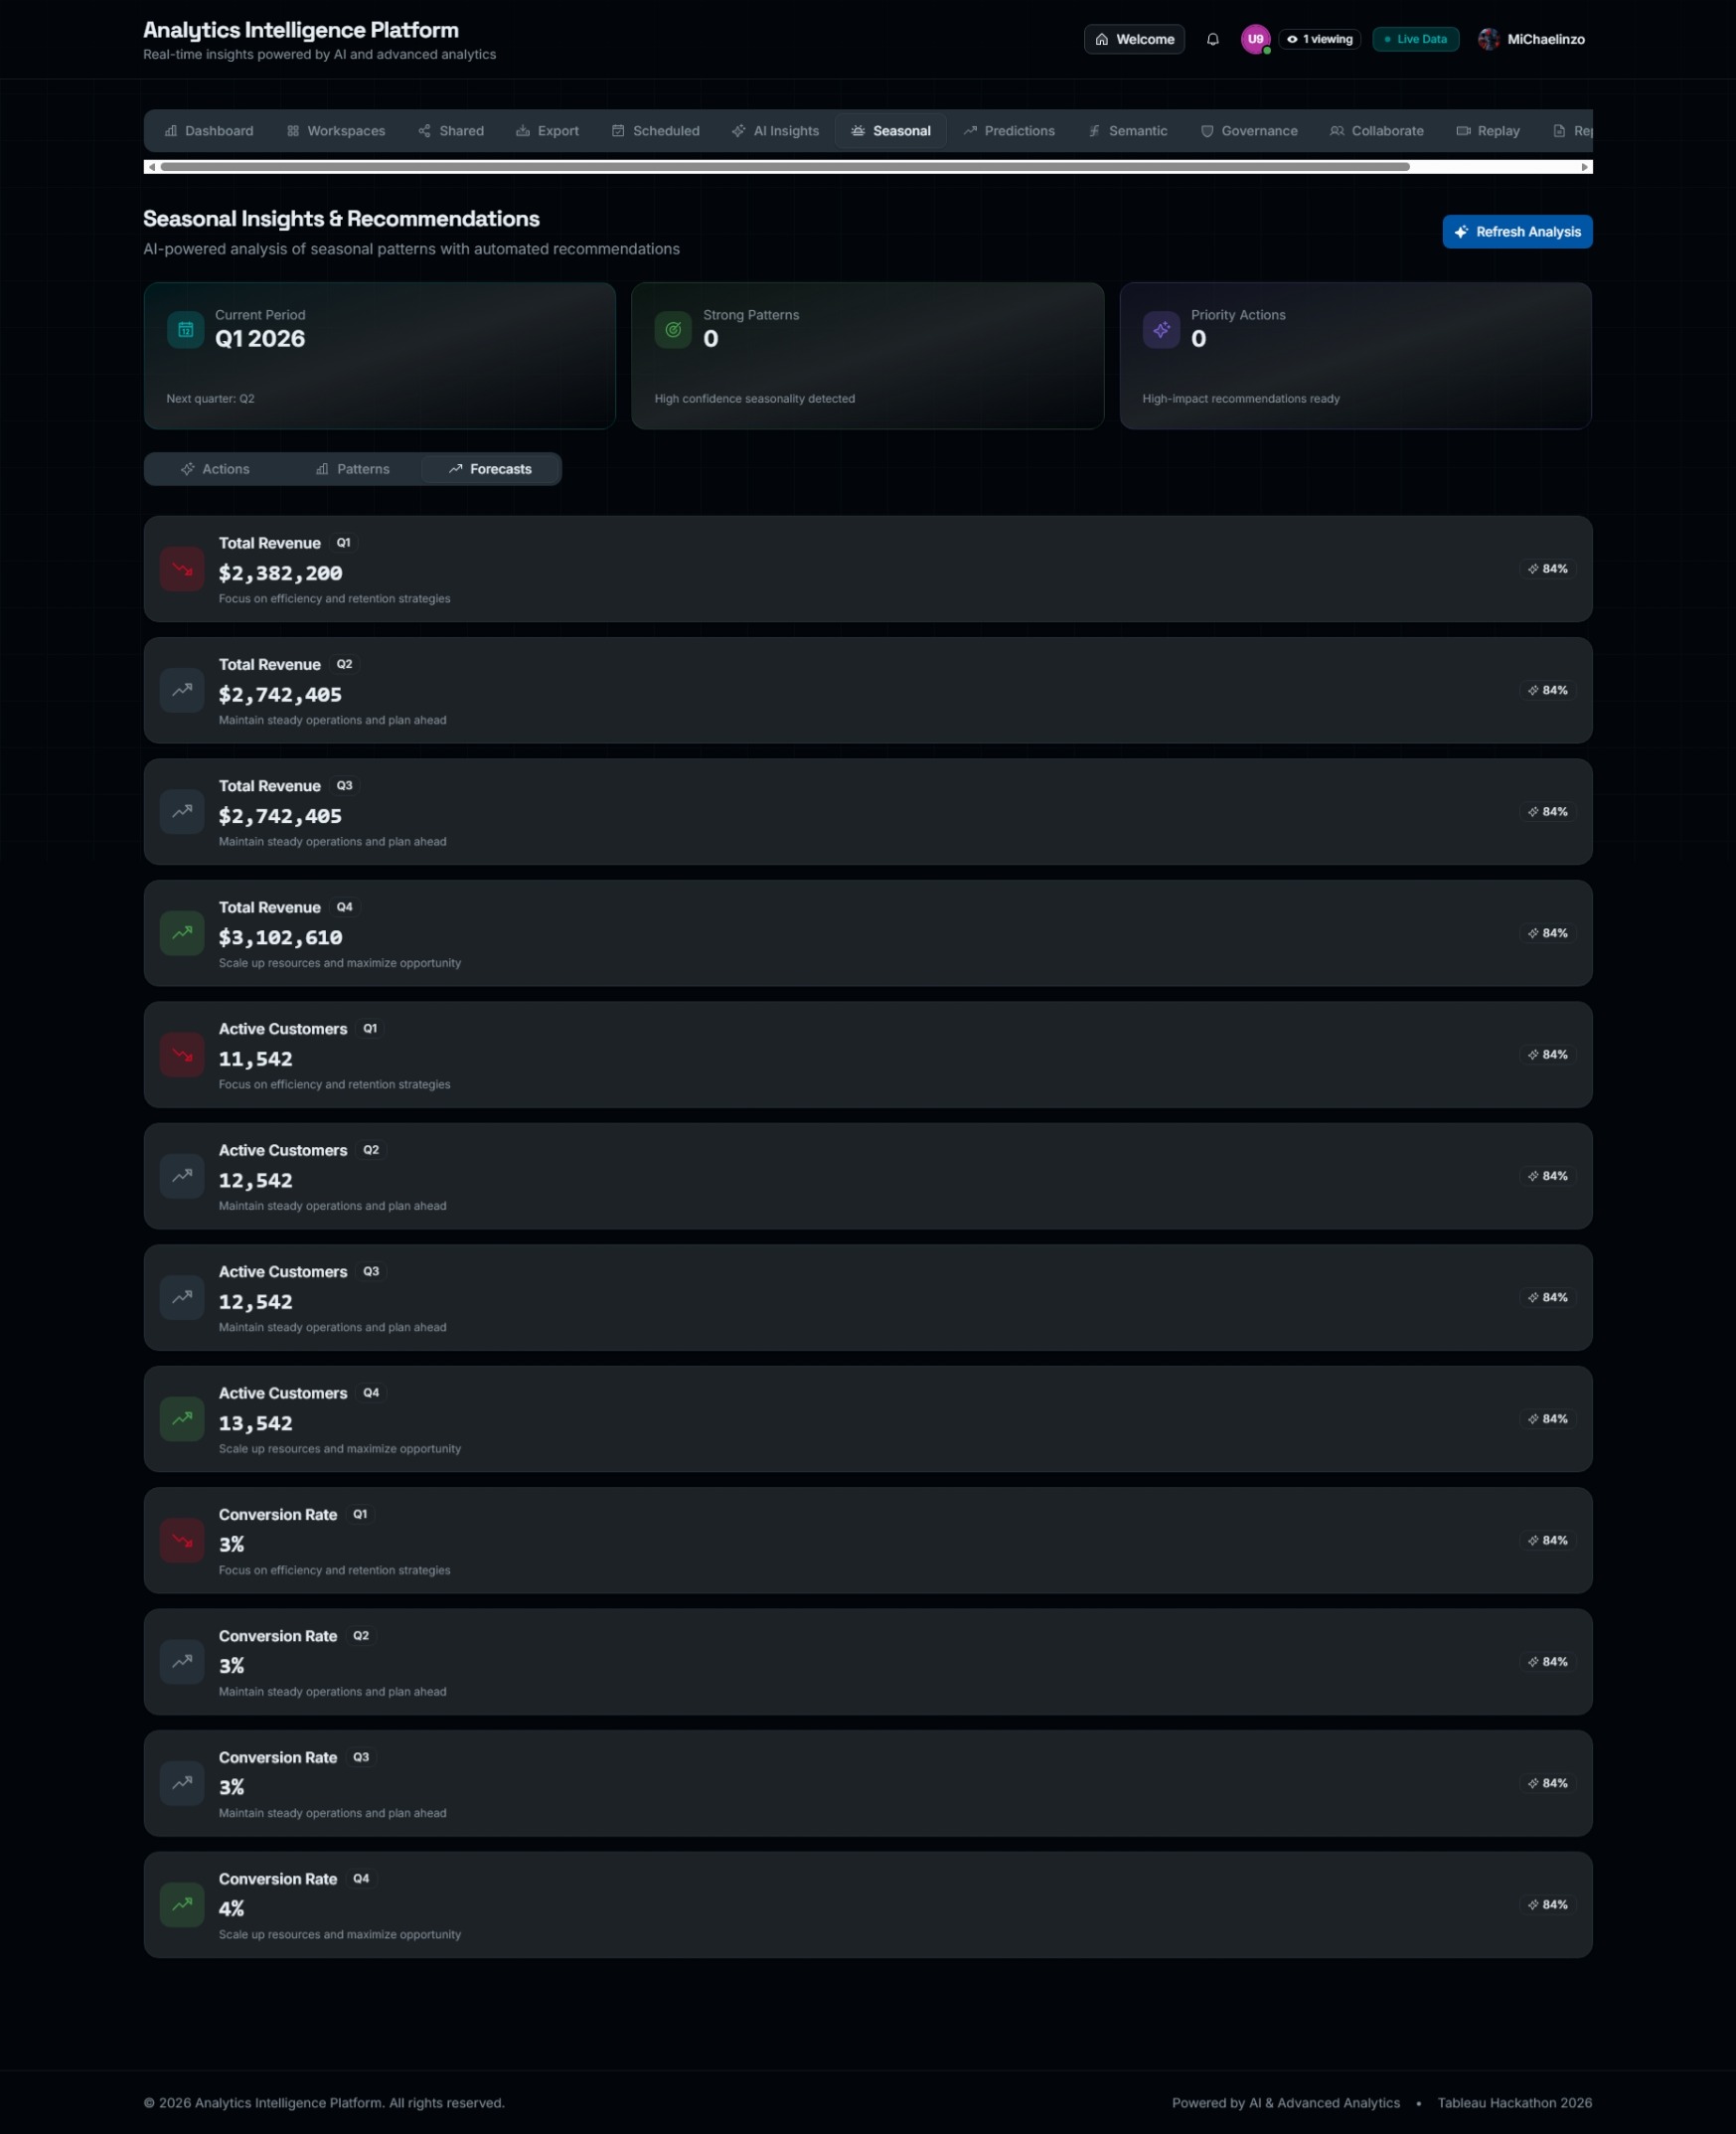
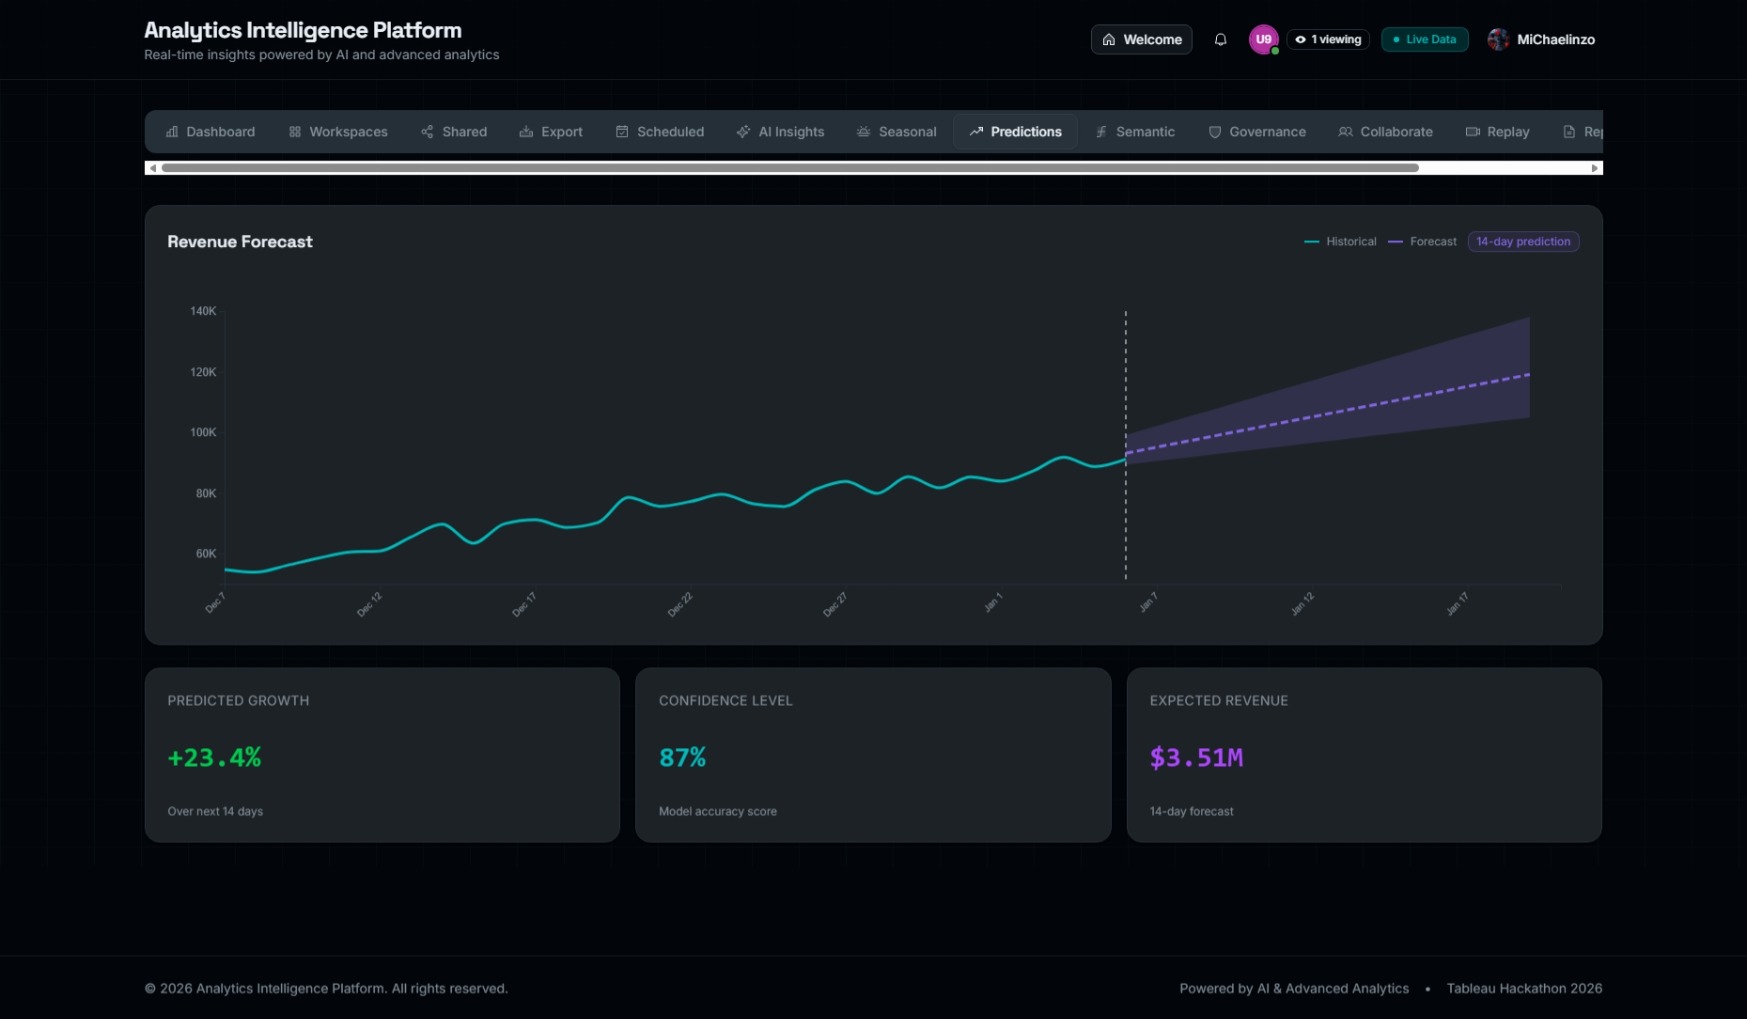
- 🔮 Predictive Analytics: Going beyond history with 14-day revenue forecasting, confidence intervals, and statistical modeling to predict future trends.
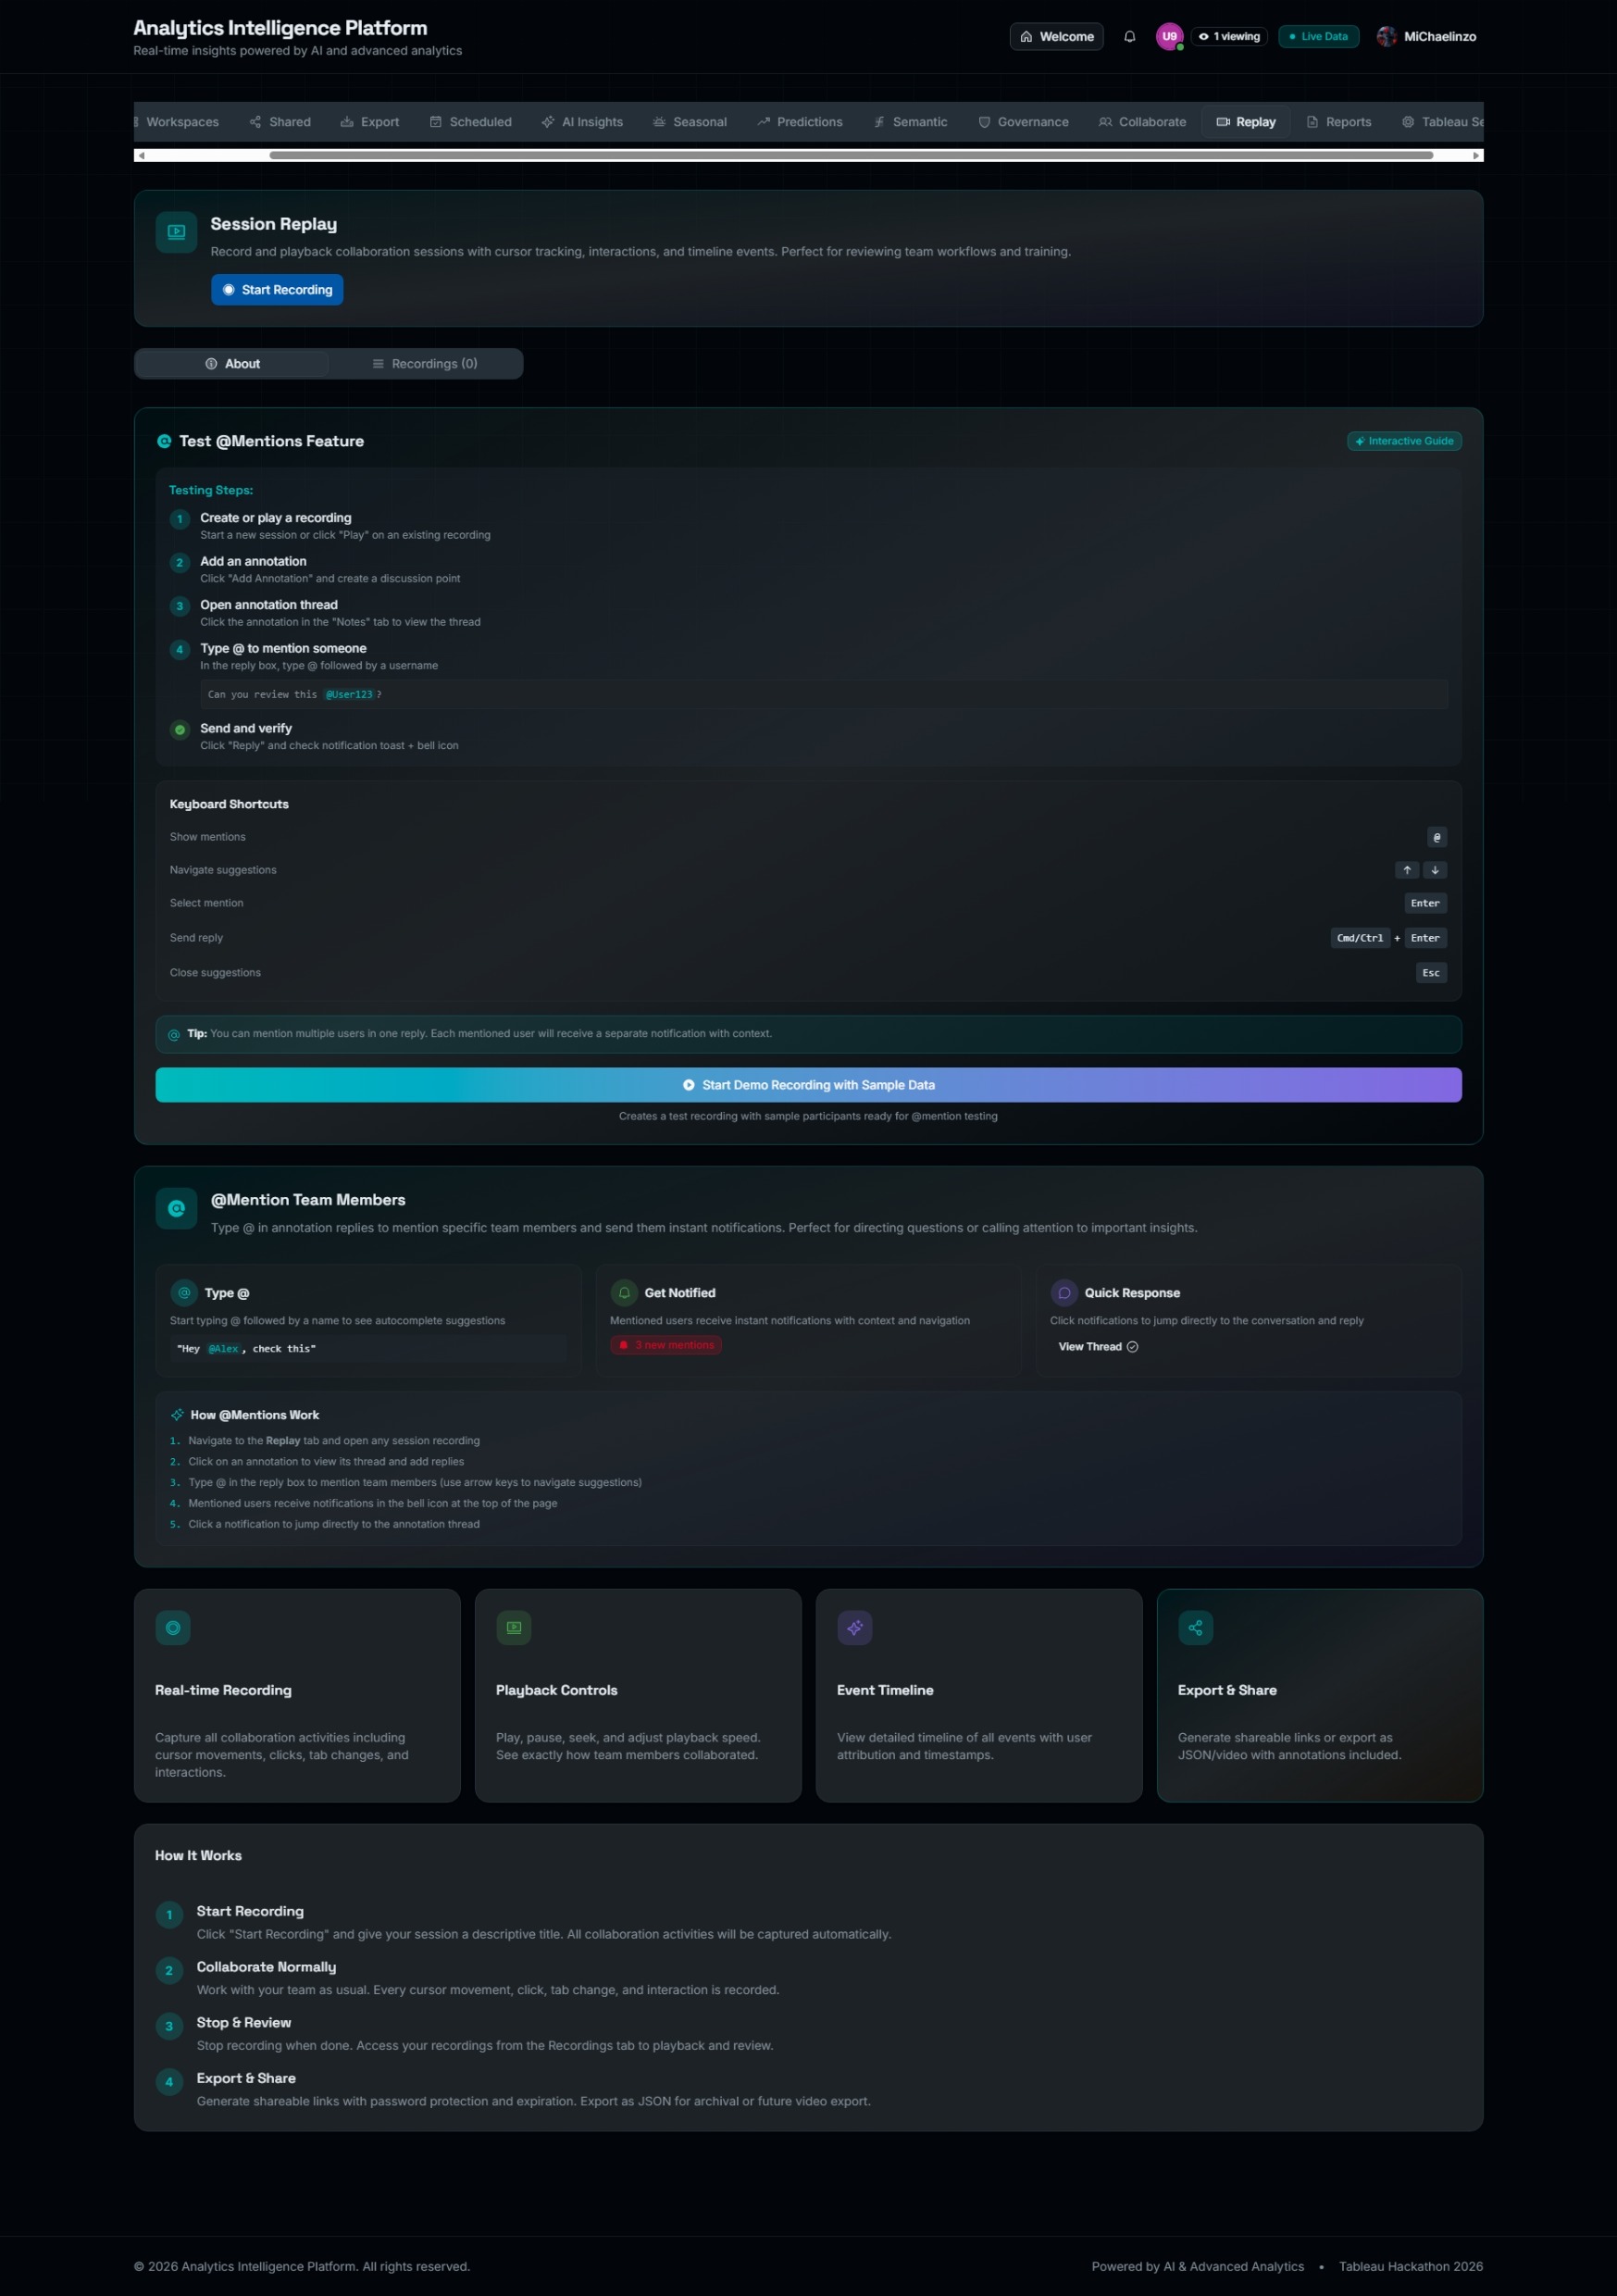
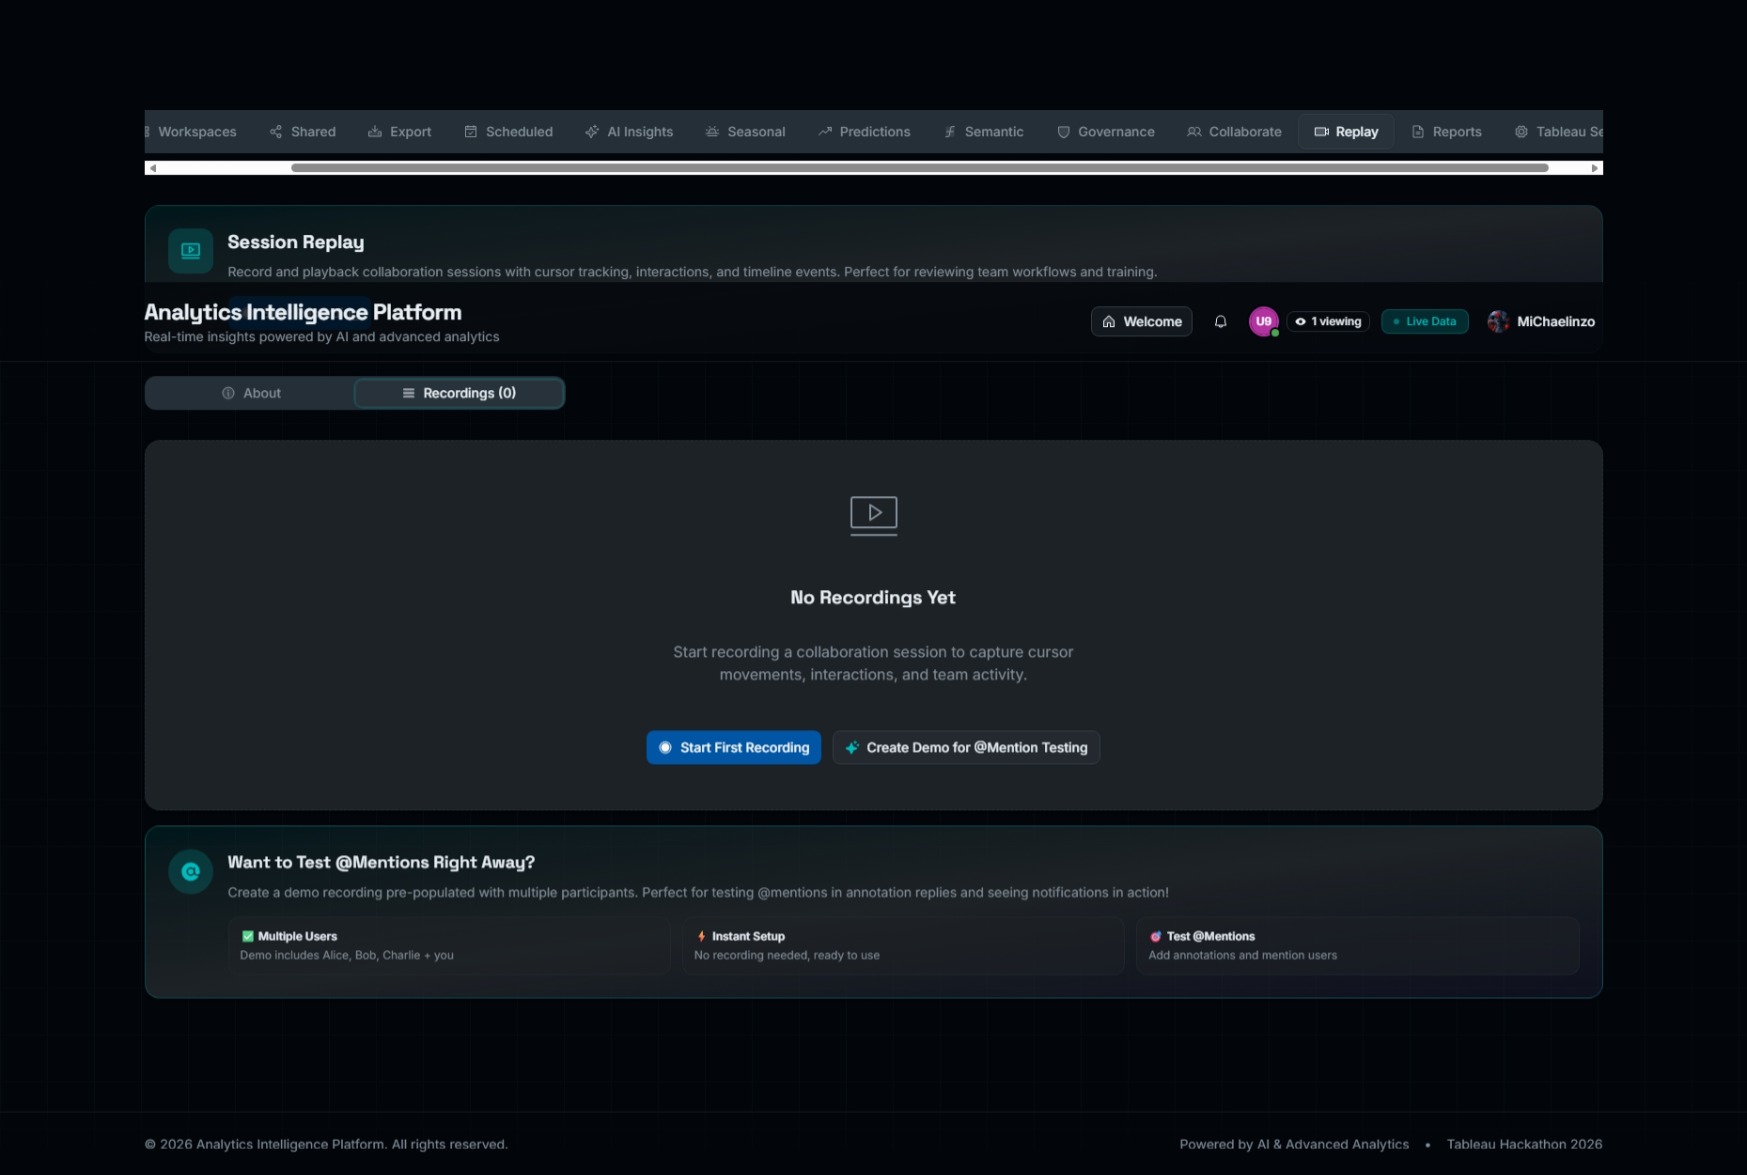
- ⏯️ Session Replay & Audit: A cutting-edge feature that records and plays back user collaboration sessions, perfect for training and compliance auditing.
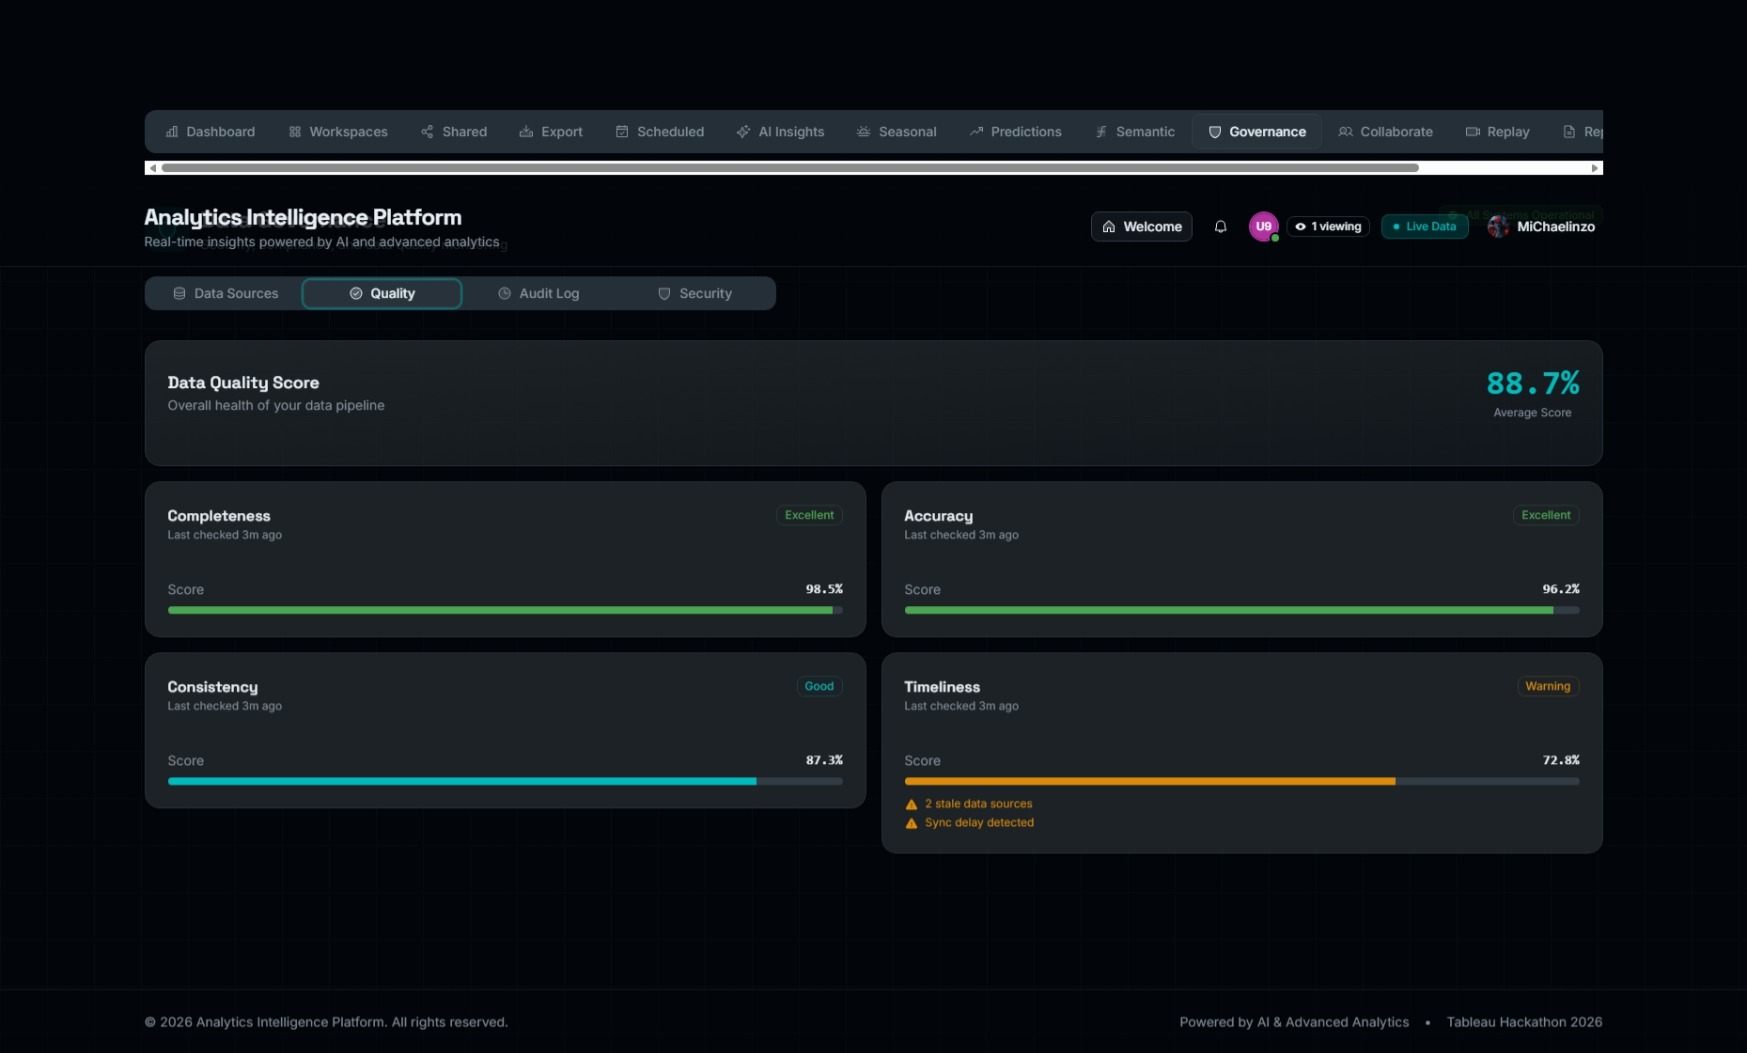
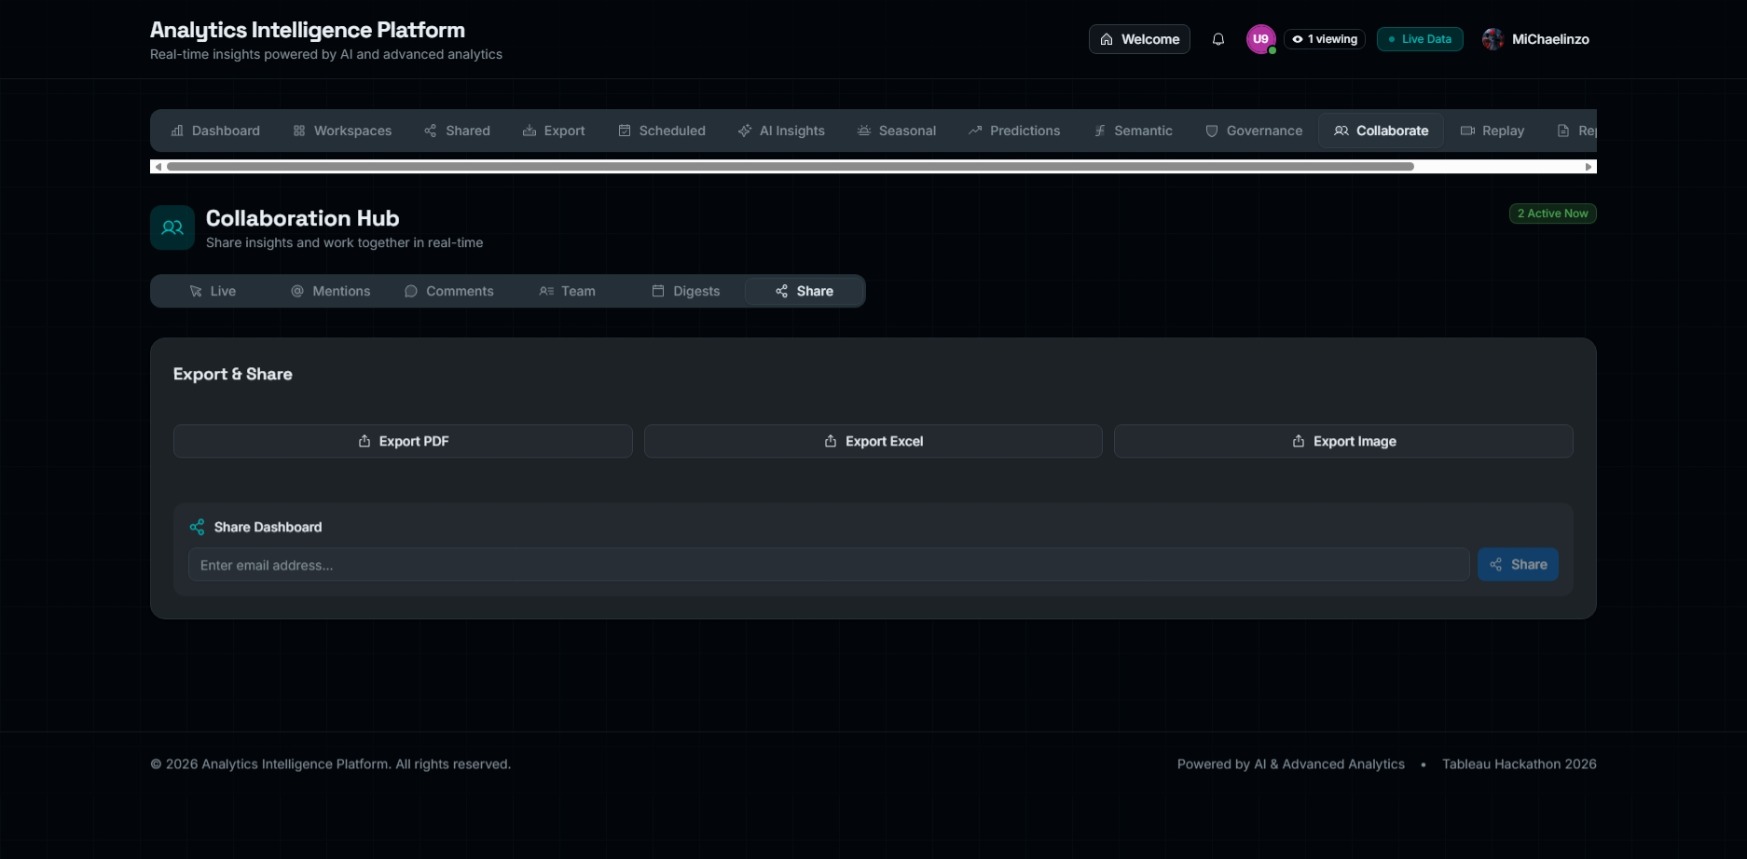
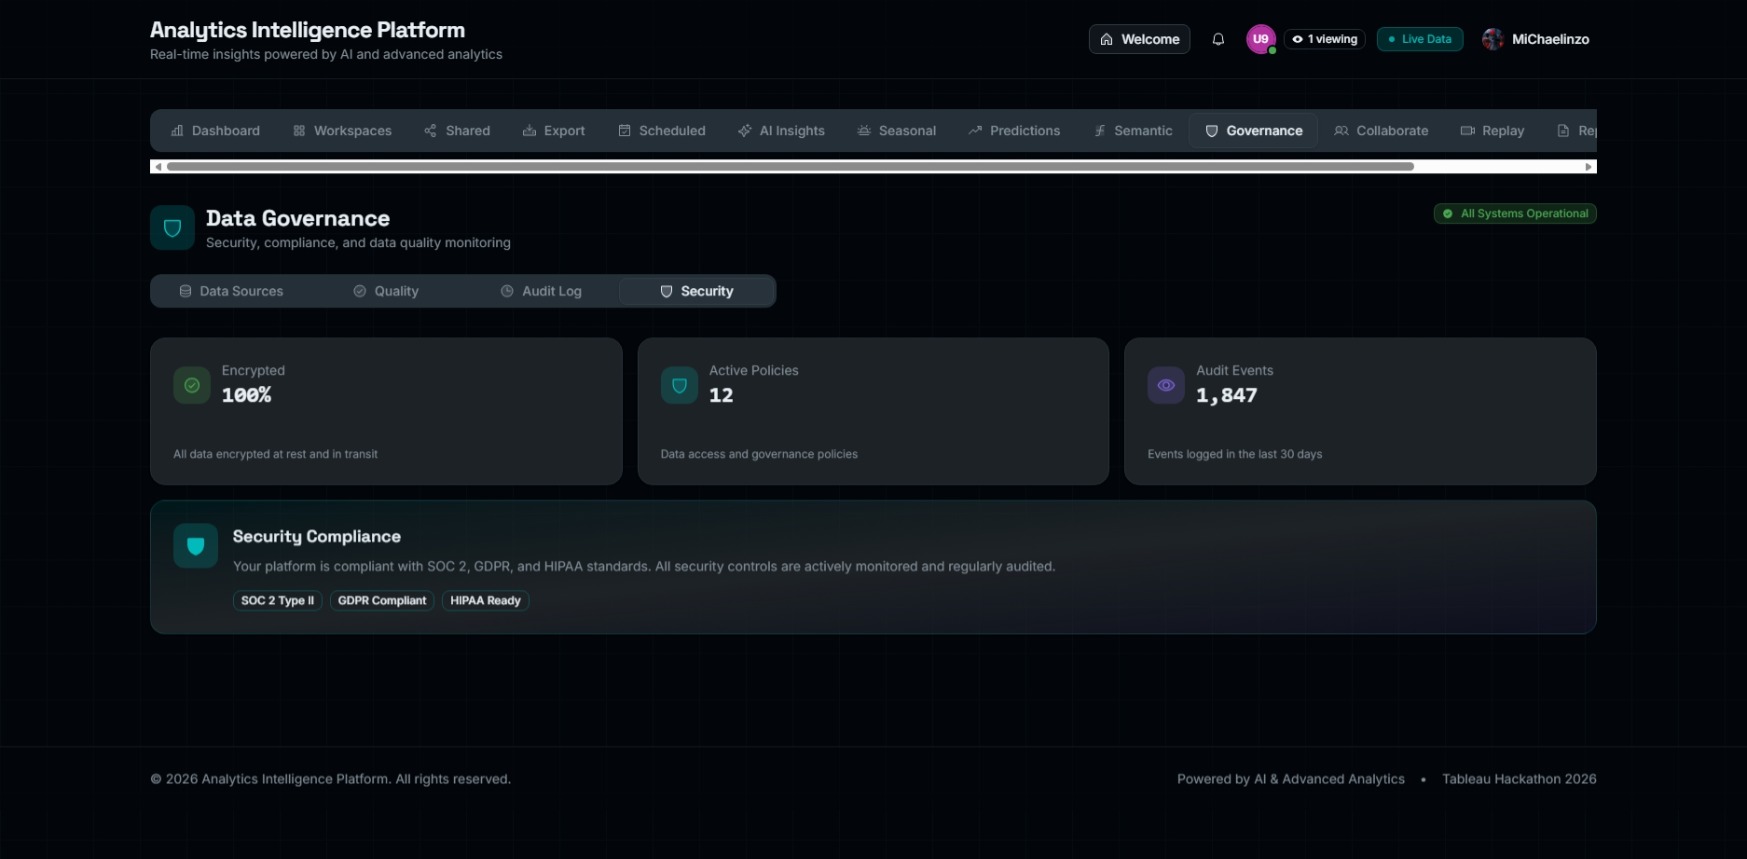
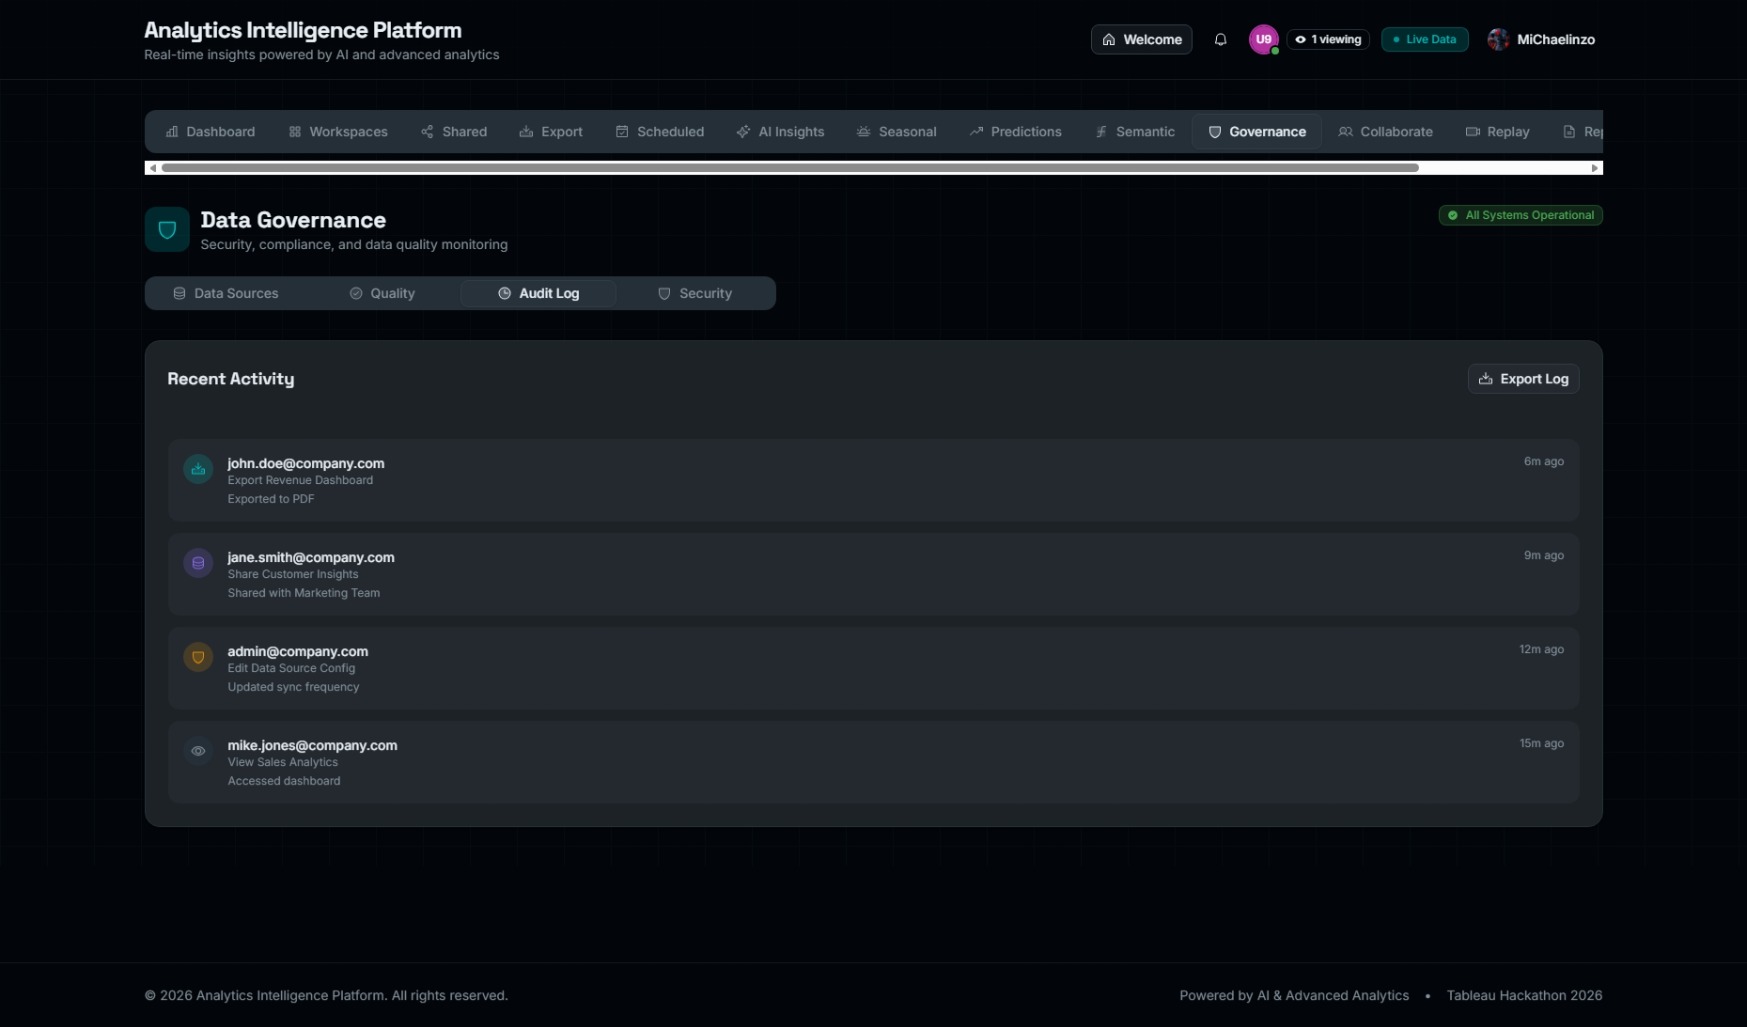
- 🛡️ Enterprise Governance: Built-in data quality monitoring (completeness, accuracy, consistency), comprehensive audit logs, and security compliance dashboards (SOC 2, GDPR).
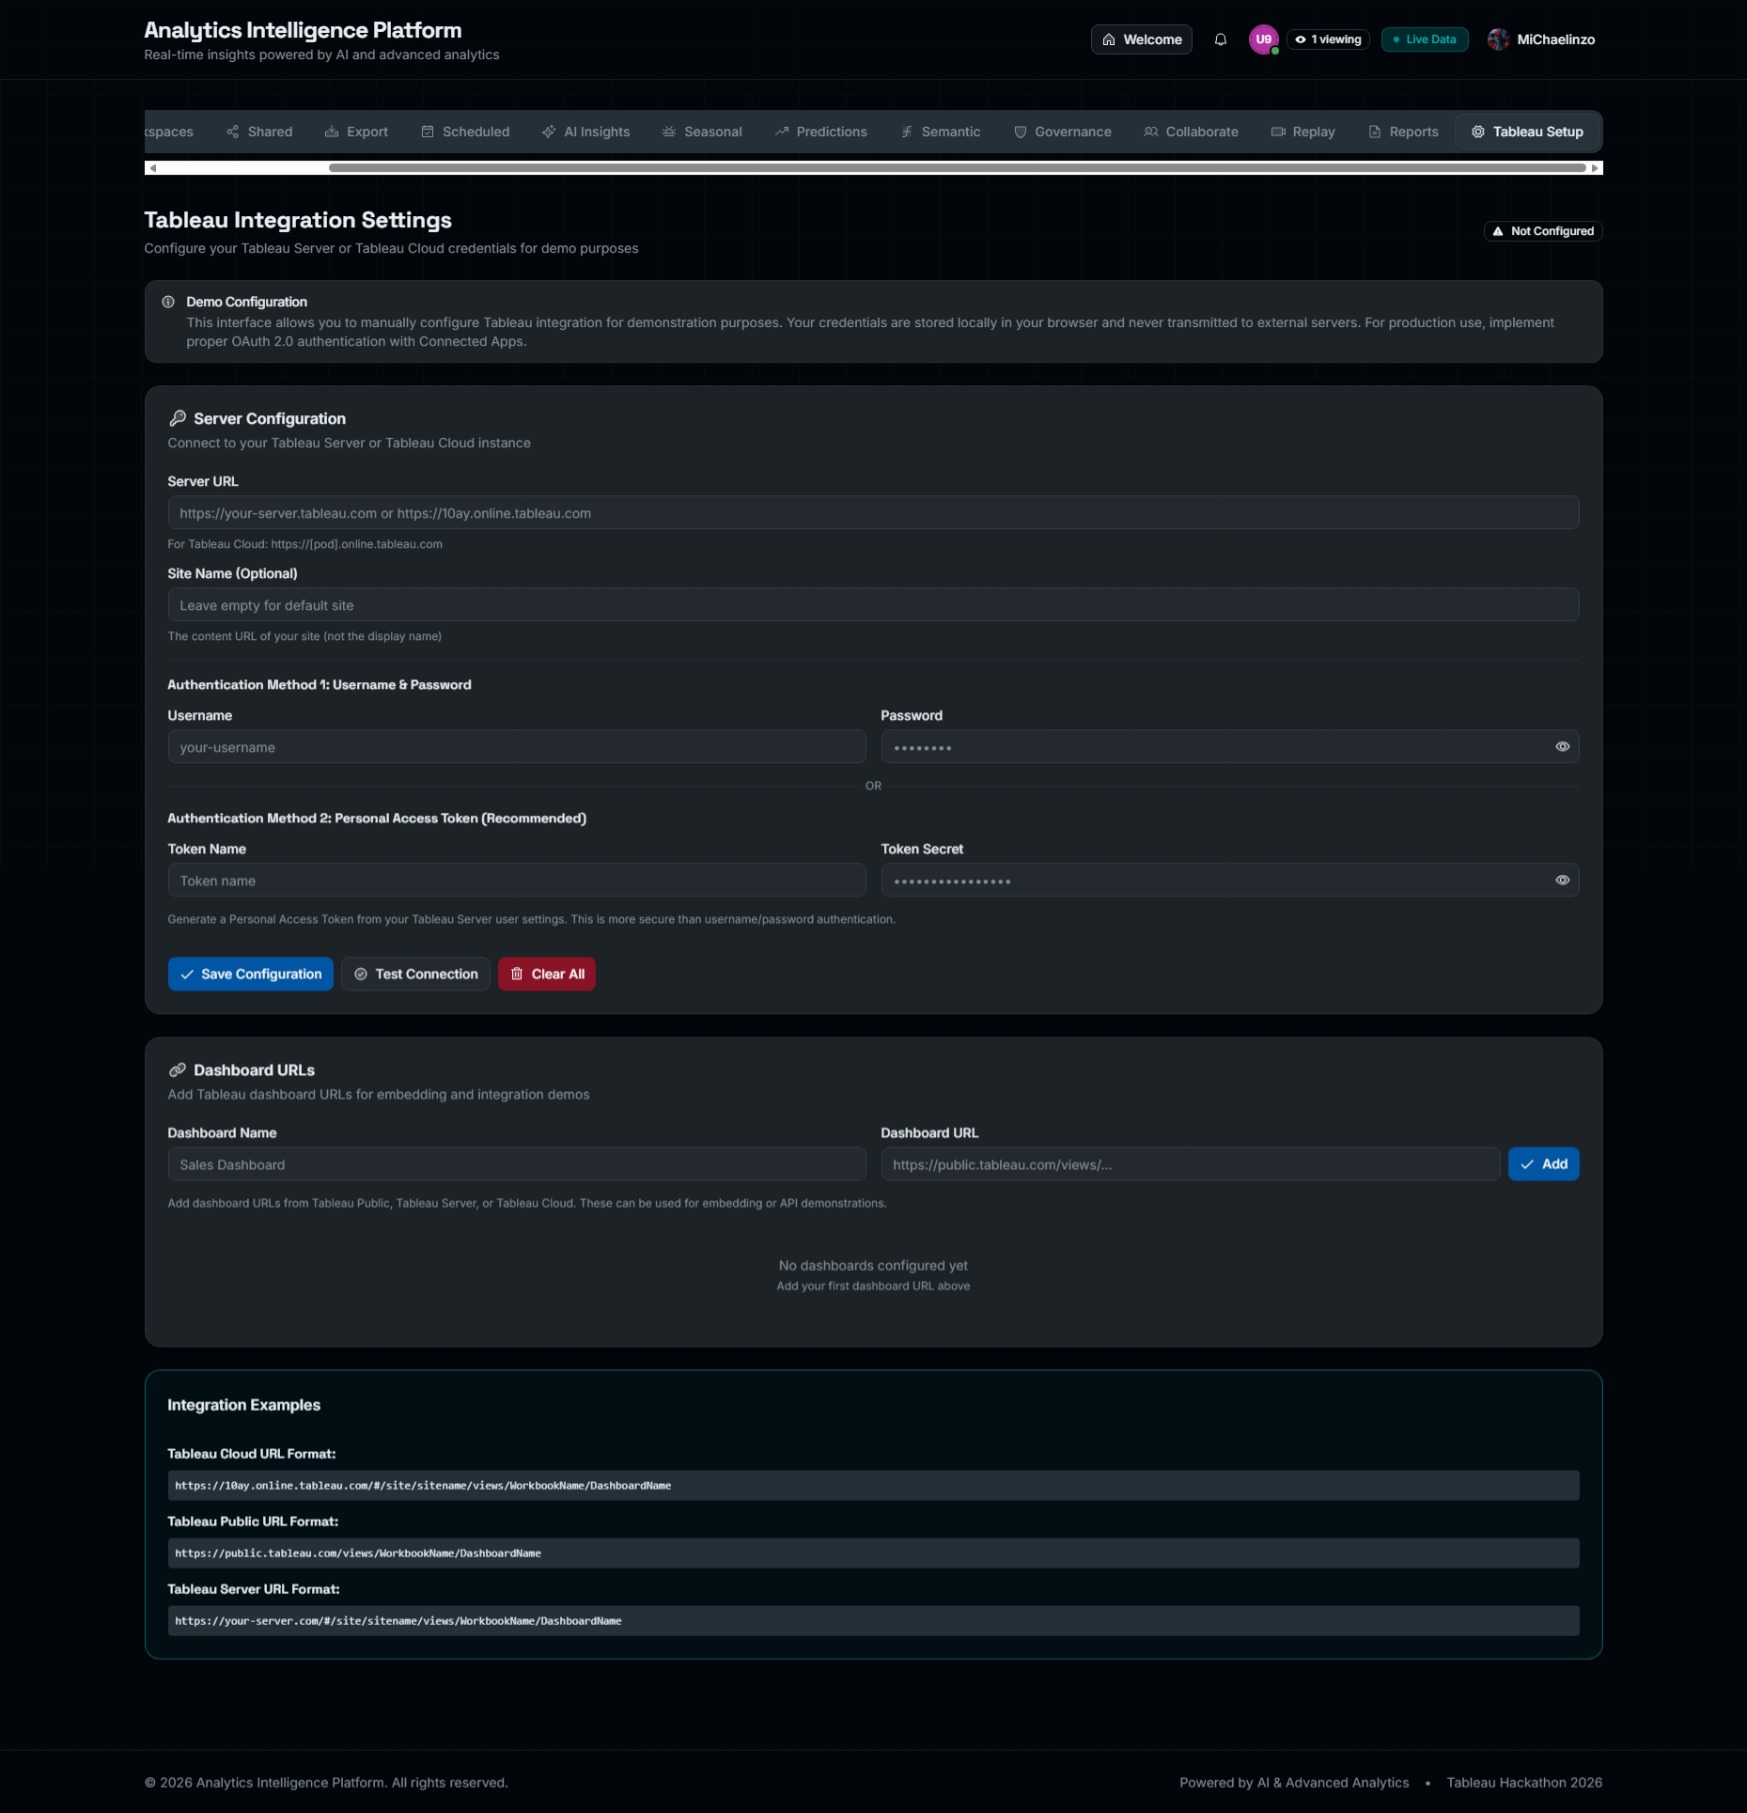
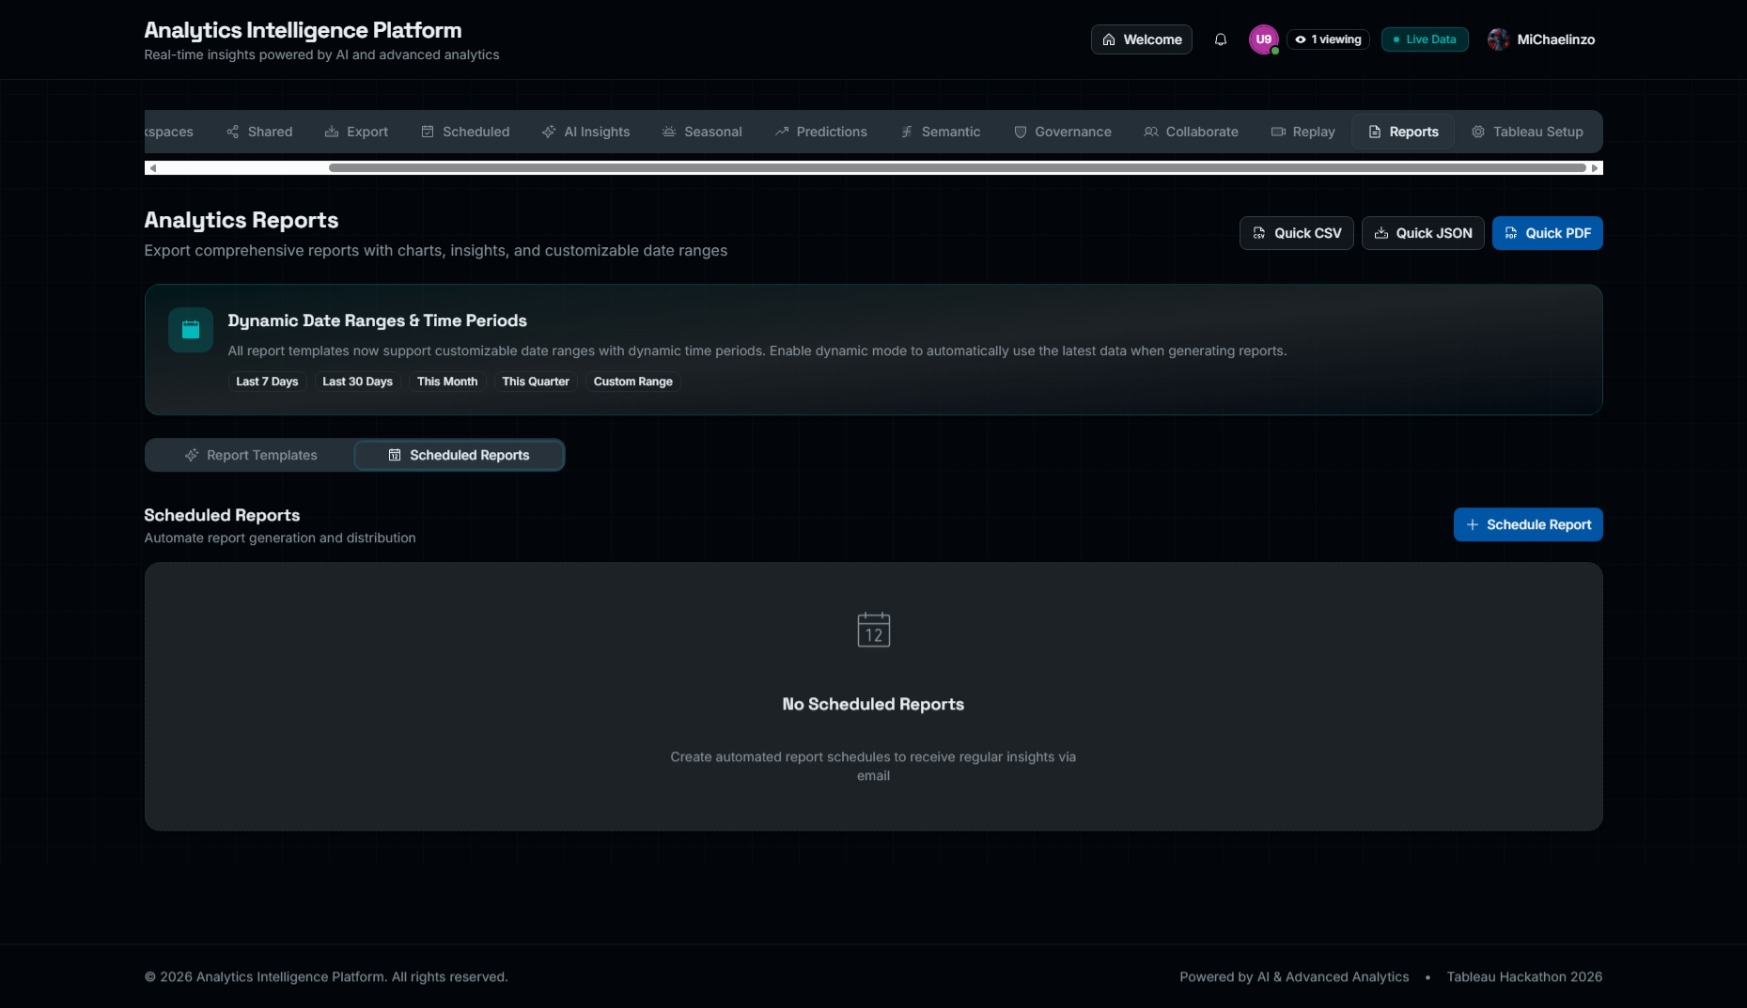
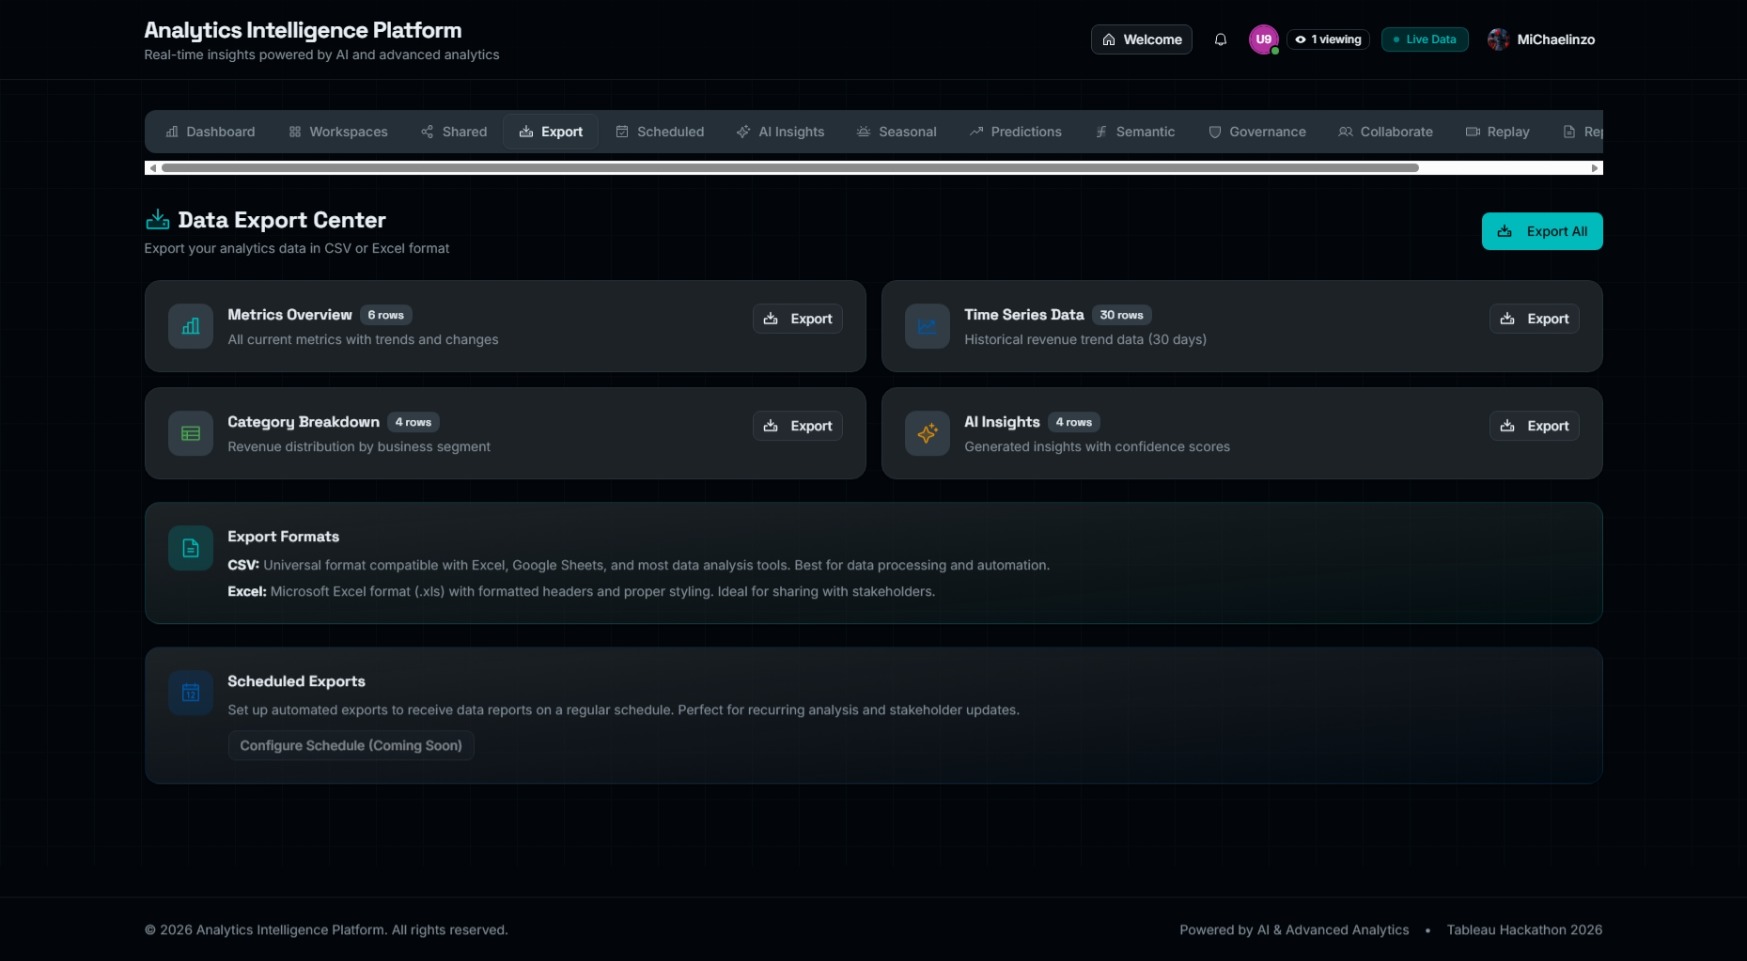
- 📈 Advanced Tableau Integration: Seamlessly embeds Tableau dashboards with REST API capabilities to manage workbooks, data sources, and users directly from the platform.
⚙️ How we built it
We utilized a cutting-edge stack focused on performance and interactivity:
- Core Framework: Built with React 19 and TypeScript 5.7 for a type-safe, high-performance frontend.
- Styling & UI: Designed with Tailwind CSS v4 and Shadcn/ui v4, featuring a custom "Command Center" aesthetic with electric blue accents and Framer Motion for fluid data animations.
- AI Engine: Integrated OpenAI GPT-4o via the Spark LLM SDK to power the Insight Generator and Semantic Layer.
- State & Persistence: Used Spark KV (Key-Value) store for persisting user preferences, workspaces, and insights, coupled with React Hooks for state management.
- Visualization: distinct combination of Recharts for native lightweight charts and Tableau Embedding API v3 for deep BI visualization.
- Collaboration: Custom-built WebSocket-style logic using
use-collaborationhooks to track cursor movements and state across different users.
🚧 Challenges we ran into
- The Semantic Gap: Translating vague natural language queries into precise database metrics was difficult. We had to build a robust "Translation Layer" that maps business terms to specific data points while handling ambiguity.
- Session Replay Logic: Implementing the Session Replay feature (recording DOM interactions and state changes to "playback" a user's journey) was technically complex, requiring careful management of timestamps and state reconstruction.
- Real-Time Sync: Synchronizing cursor movements and chart interactions between multiple users without latency or "jitter" required optimizing our state management loops.
- Tableau Context: Seamlessly passing filters and context between the native React application and the embedded Tableau frames to ensure a unified experience.
🏆 Accomplishments that we're proud of
- Integrated Session Replay: We successfully built a "DVR for Analytics"—allows teams to review exactly how an insight was discovered.
- The "Pulse" of Data: Successfully mimicking the logic of Tableau Pulse to push insights rather than just pulling reports.
- UI/UX Design: Creating a dark-mode, enterprise-grade interface that looks and feels like a futuristic command center (using the Space Grotesk and JetBrains Mono typography).
- Automated Data Governance: Implementing a system that doesn't just show data, but automatically scores its quality (Accuracy, Timeliness, Completeness).
🧠 What we learned
- AI needs Context: GPT-4o is powerful, but it's only as good as the metadata you feed it. Building a strong schema definition was key to getting good insights.
- Collaboration changes Analysis: When users can see each other's cursors and comments in real-time, the time-to-insight drops dramatically.
- React 19 Capabilities: We learned how to leverage the newest React features for smoother concurrent rendering, which is crucial for heavy data dashboards.
🚀 What's next for Analytics Intelligence Platform (AIP)
We have a bold roadmap to take AIP further:
- Salesforce Agentforce Integration: Connecting our semantic layer to Salesforce's conversational AI agents.
- Mobile Native App: Using the Tableau Mobile SDK to bring AIP to iOS and Android.
- Slack Workspace Integration: Pushing our "Pulse" insights directly into Slack channels with interactive "App Home" tabs.
- OAuth 2.0 Connected Apps: Implementing full OAuth flows for secure, seamless third-party data connections.
- Streaming Data: Moving from polling to WebSockets for sub-second data updates on the dashboard.
Built with ❤️, ☕, and 📊 for the Tableau Hackathon 2026.
Built With
- authentication
- d3.js
- framer-motion
- github
- openai-gpt-4o
- react-19
- recharts
- shadcn/ui
- spark-kv-store
- spark-sdk
- tableau-embedding-api
- tableau-pulse
- tableau-rest-api
- tailwind-css
- typescript
- vite


Log in or sign up for Devpost to join the conversation.