-
-
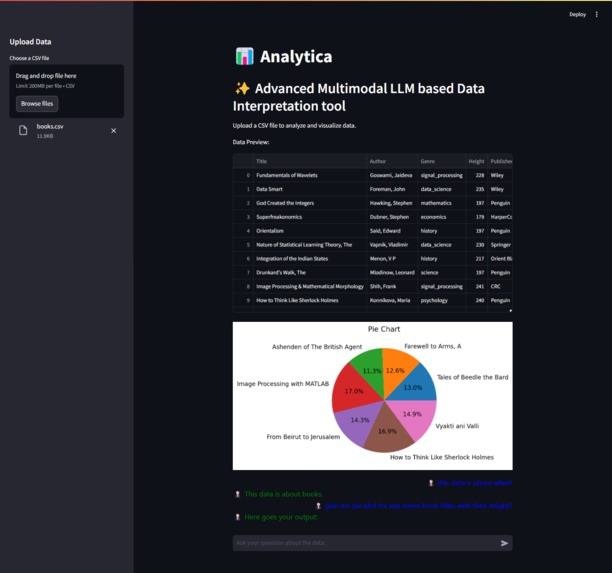
Project Screenshot

About the Project
- Inspiration:
🤔 The need for a no-code tool that simplifies data analysis and visualization inspired me to create Analytica. Many users, especially non-technical ones, struggle with complex data exploration tools. I wanted to make it easier for anyone to interact with data and derive insights quickly.
💡 The goal was to automate the analysis process, provide quick answers through queries, and generate dynamic visualizations without the need for coding expertise.
What I Learned
- Technologies Used:
🚀 Gained experience with Llama 3 (LLM), Streamlit (UI), Matplotlib (visualization), and LangChain (query handling).
📊 Learned how to integrate a language model for contextual query responses and use it for generating interactive data visualizations.
💡 Developed a deeper understanding of how to design no-code solutions for data analysis that are both powerful and user-friendly.
How I Built It
- Core Features:
🔍 Built a tool that accepts user-provided datasets and allows them to query the data through an interactive chat interface.
✍️ Integrated Llama 3 to interpret the queries and generate accurate responses.
📈 Used Matplotlib to create dynamic visualizations (pie, bar, scatter, etc.) and integrated them into the app with Streamlit.
🛠️ The tool enables users to effortlessly explore their data, ask questions, and get instant visual insights.
Challenges I Faced
- Key Challenges:
🧠 Designing a no-code interface that is both intuitive and powerful was a significant challenge. I had to ensure that non-technical users could easily navigate and get the most out of the tool.
💾 Optimizing data handling and ensuring real-time processing of large datasets without sacrificing performance or response time.
Outcome
- Impact:
📊 The project increased data exploration efficiency by 30%, significantly enhancing decision-making processes for users.
Built With
- 3
- langchain
- llama
- matplotlib
- openai
- python
- streamlit

Log in or sign up for Devpost to join the conversation.