Inspiration
I saw this post on NUSWhispers (and on reddit) long ago of someone doing data analysis on NUSWhispers confessions data.
What it does
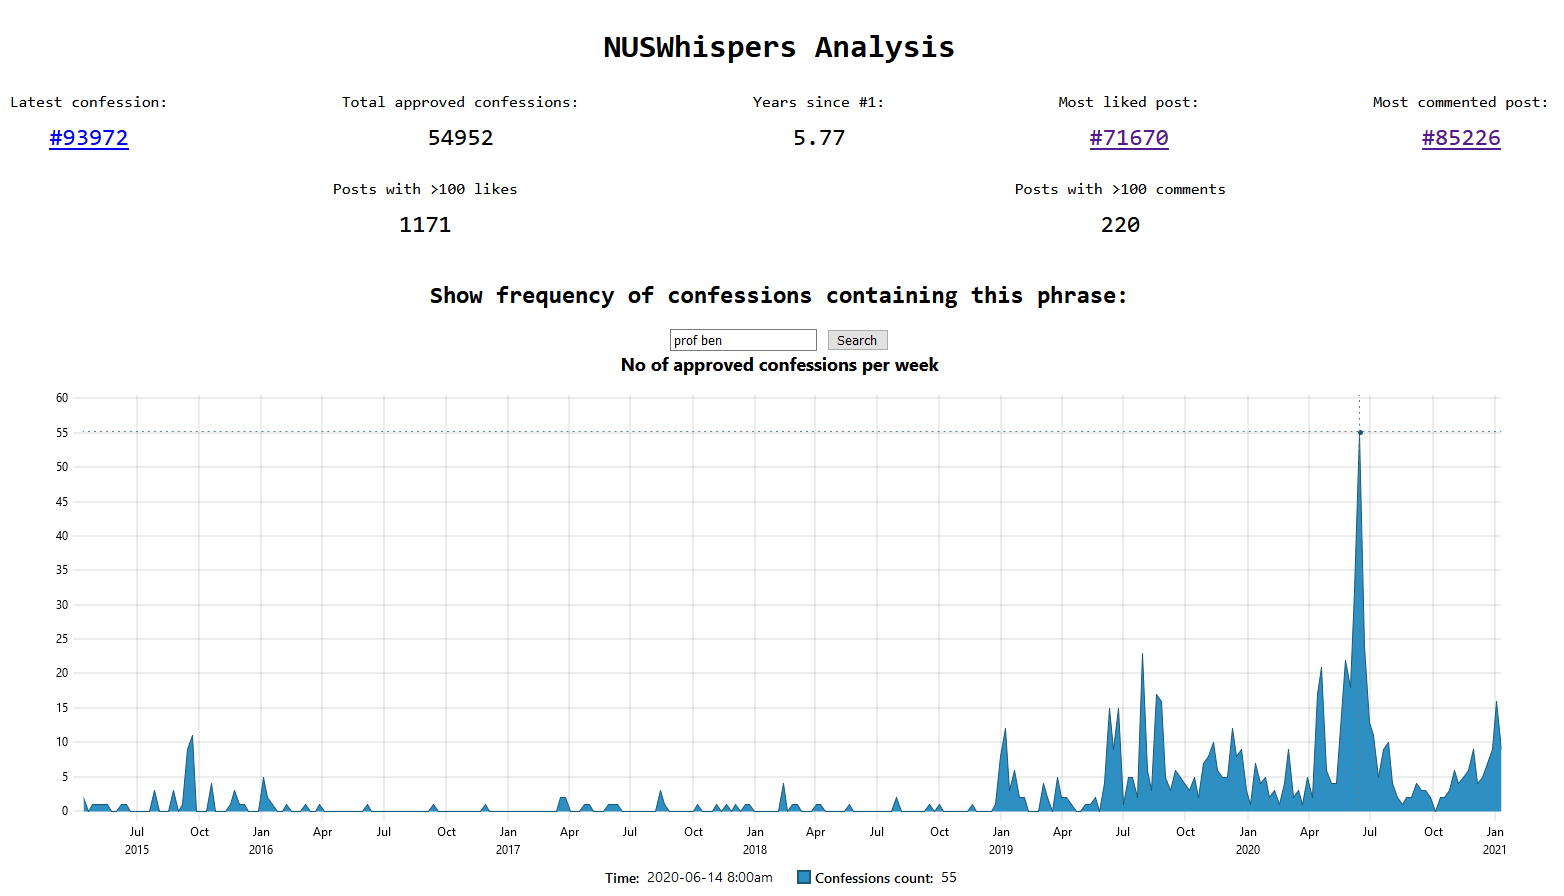
It is a static frontend with 4 uPlot graphs and 1 wordcloud, visualizing simple statistical analysis on the confessions data. 1 of the graph and the wordcloud is dynamic, showing data filtered by the text input. Other graphs are just static data.
How I built it
Github actions - scrape all >90k confessions data
numpy, pandas - data analysis tools
wordcloud - create wordcloud image
fastAPI - python web API
uPlot - charting library
Challenges I ran into
First time using fastAPI and uPlot
Accomplishments that I'm proud of
I managed to do most of what I wanted in time.
What I learned
fastAPI is quite nice to use. uPlot requires some specific formatting for the data, but otherwise, it provides some interactivity like drag to zoom.
What's next for Analysis on NUSWhispers Confessions
I still have some features to implement and some clean up to do for the data.
- top 10 posts with most likes/comments
- sentiment analysis, maybe topic modelling or text classifier
- remove outliers
Log in or sign up for Devpost to join the conversation.