Group Members
Xiaofu Li, Jing Cao, Kunyang Li
Inspiration
All of our group members are interested in mental health and we found the World Happiness Report conducted since 2012 offers people insights about worldwide bliss, so we want to have an insight about world happiness level by analyzing the data in World Happiness Report .
What it does
Create maps and plots using python functions to analyze data in World Happiness Report.
How we built it
Set up: Filter and merge all datasets Prepare smaller datasets for each research question
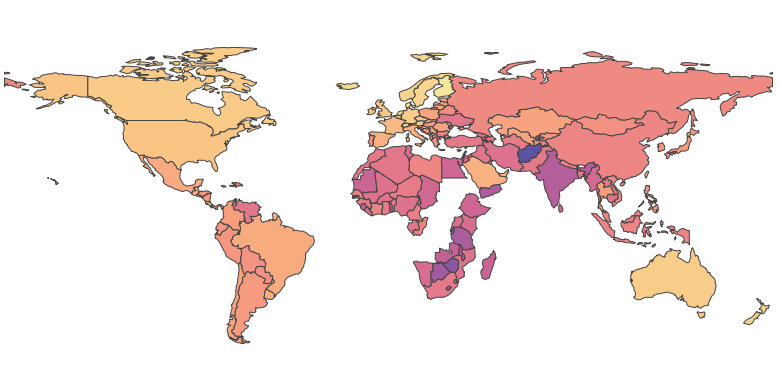
Geospatial data: Build an interactive map Visualize 2021 world happiness report
Case features: Display bar charts and line charts Analyze the top 10 happiest countries with their factors over year
Recent trends Present kernel density estimation and box plots Compare worldwide happiness levels between 2020 and 2021
Challenges we ran into
Figure out how to merge multiple datasets together Use library we did't learn in class
Accomplishments that we're proud of
Overcome challenges mentioned above
What we learned
We learned how to apply python concepts we learned in class to real world problems
What's next for Analysis of the World Happiness Report
- Expect longer period of time (20 years or so) so that historical context may be included in evaluation.
- Visualizations provided for global services or U.N. to make agendas addressing specific problems in specific regions.

Log in or sign up for Devpost to join the conversation.