Inspiration
This is inspired by using a dataset challenge for the MLH Local hack day challenge.
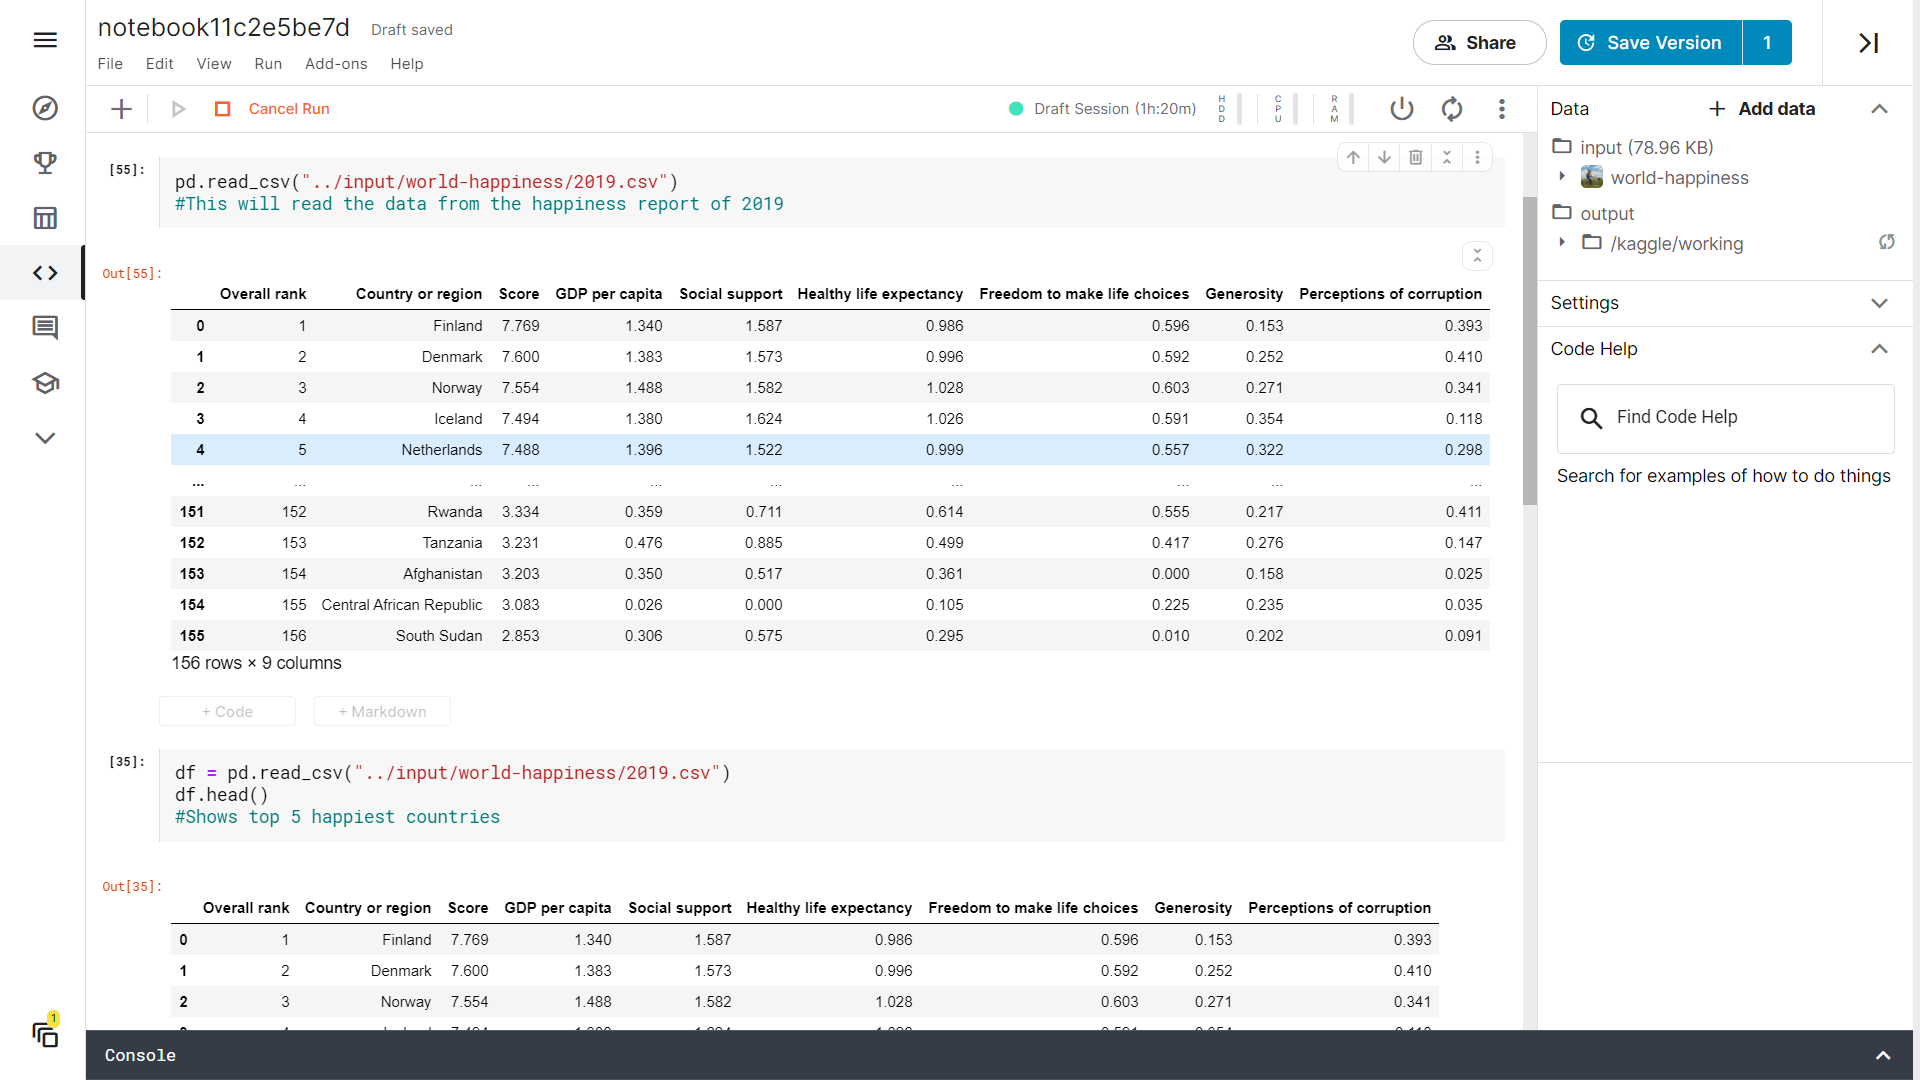
What it does
This analysis data of the world happiness report and shows various graphs etc. analysing the same.
How we built it
It is created using Jupyter notebook and uses pandas, matplotlib and numpy.
Challenges we ran into
Created a kaggle notebook for the first time.
Accomplishments that we're proud of
Worked with a dataset for the first time.
What we learned
Using Kaggle and jupyter notebooks
What's next for Analysing World Happiness report
A lot more analysis can be done.

Log in or sign up for Devpost to join the conversation.