Inspiration
To solve the real life problem which can improve my analysis skills
What it does
Three correlation factors are found and analysed, which are water level variations, running period of pumping station and power consumption distribution.
How I built it
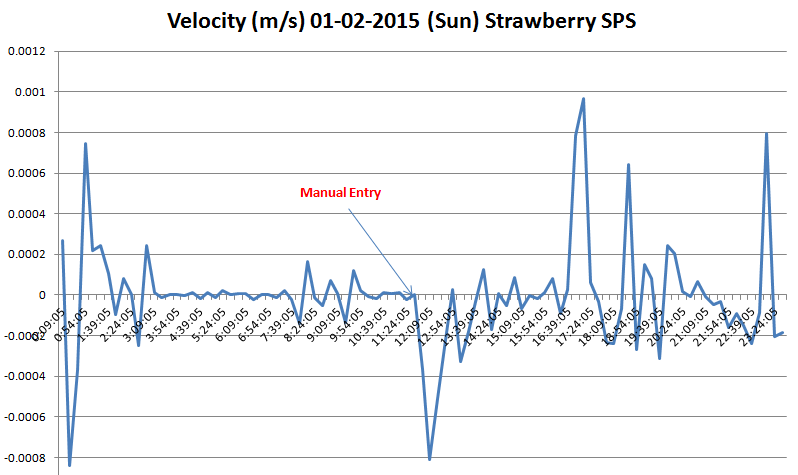
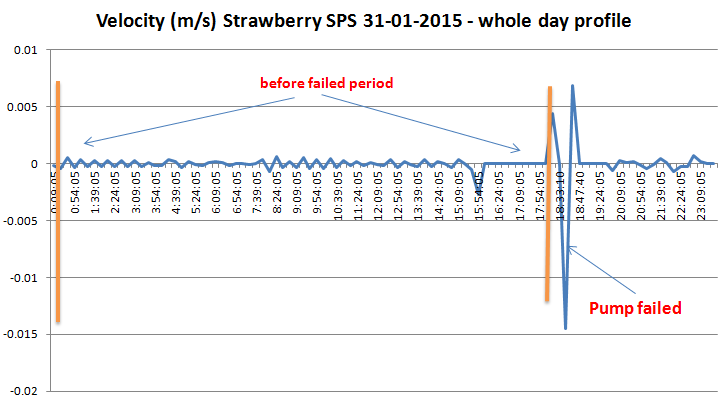
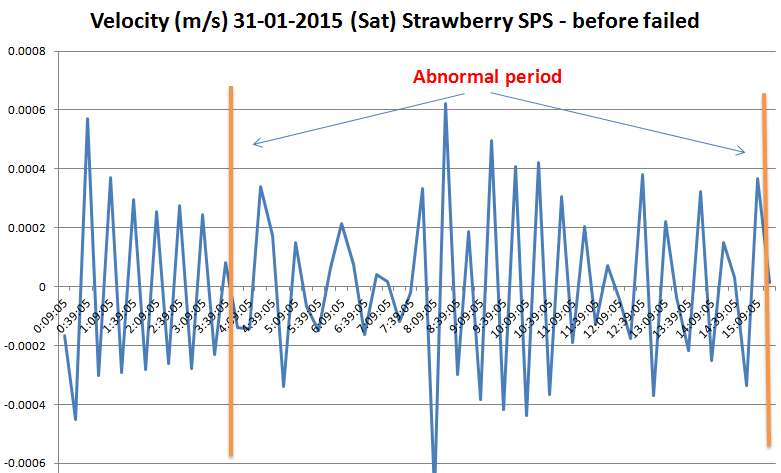
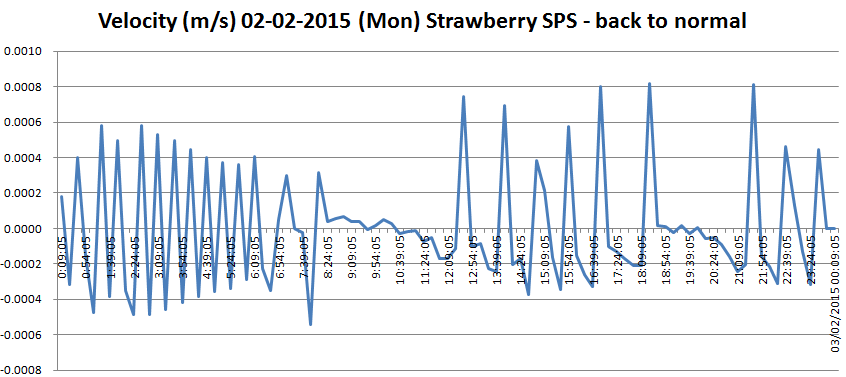
Firstly, the water level variations data is calculated, these type of data are sufficient. By compaying the normal pattern with abnormal pattern of pumping station, the trend of blockages can be identified.
Then, the running period is developed. because if the blockages enter into the pumping station, the operation time will be significantly increasing.
Last, the power consumption of pump, is another important factors which can be used to predict the failure of pump station.
Challenges I ran into
Understand the data, I have asked many questions to find the right data,many thanks to the kind staffs.
Some important data are not available, for example, normal running period data and hourly power consumption data.
Accomplishments that I'm proud of
The model is effective, it does forecast the blocakge which can prevent the pollutions in advance.
What I learned
The whole pumping station, the seweage system.
What's next for An effective model for pollutions prediction in SPS
Model improvement, the model is for example, each pumping station has its own model, which should be built individually.

Log in or sign up for Devpost to join the conversation.